PDF 原檔:報告_GS_亞德客1590_20260804_original.pdf
圖片清單(已驗證 2026-08-06)
| 檔名 | size | 分類 | 親眼所見內容 |
|---|---|---|---|
報告_GS_亞德客1590_20260804_001.png |
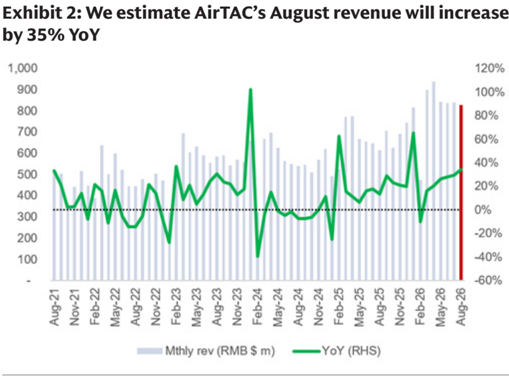
113KB | 真資料圖 | 長條圖+YoY 折線(右軸):AirTAC 月營收 RMB mn,Aug-21 至 Aug-26,標題「We estimate AirTAC's August revenue will increase by 35% YoY」,最右紅色長條為 8 月預估值 |
報告_GS_亞德客1590_20260804_002.png |
83KB | 真資料圖 | Goldman Sachs 評等與目標價歷史走勢圖(2023-2026),標示歷次目標價節點(1200→…→1725),藍線股價、灰線台股加權指數(右軸),底部 B(Buy)評等區間標示 |
原始內容
For the exclusive use of KEVINLU@LENOVO.COM
Airtac International Group (1590.TW): July Monthly revenue -3% vs. GSe; Backlog continues to accumulate
On August 4th, AirTAC reported July revenue of Rmb841mn ( fl attish MoM, +30% YoY) / NT$3,994mn (+2% MoM, +51% YoY), which was 3% below GSe in Rmb terms.
In July, AirTAC's revenue was 3% below GSe in Rmb terms, with fl attish MoM despite 9% more working days, given the company's pneumatic daily revenue declined by 8% MoM due to normal low season and is 3% lower than our estimation (Rmb29.8mn vs. GSe of Rmb30.7mn). Linear guide revenue contribution is slightly weaker than our estimation (Rmb58mn missed GSe of Rmb60mn).
Moreover, July revenue was up 30% YoY (in Rmb) with the same working days as July 2025. We believe this solid YoY revenue growth was driven by (1) strong battery demand, which continued to deliver strong monthly revenue YoY growth for more than a year, (2) YoY growth across all end markets reached double digits as China pneumatic market has entered a prolonged upcycle. However, revenue contribution from linear guides was slightly lower in July at Rmb58mn vs. GSe of Rmb60mn vs. Rmb58mn in June, and the daily average linear guides revenue is lower at Rmb2.3mn (vs. Rmb2.5mn in June), AirTAC continues to improved its brand image for its linear guide products and maintained strong price competitiveness (c.20-30% discount vs. peers) and the company continue to expect the linear guide utilization rate to trend up sequentially throughout 2026 (see here).
In terms of revenue growth by end-market segment for July (see Exhibit 1), the battery sector continued to outgrow all other sectors (+65% YoY), suggesting sustained demand. Key segments' monthly revenue YoY trend includes machine tool (40% YoY), general machinery (33% YoY), electronics (+33% YoY), textile (+31% YoY), automotive (+27% YoY), energy lighting (+18% YoY) and packaging (+15%).
Chao Wang
+886(2)2730-4195 | kuanchao.wang@gs.com Goldman Sachs (Asia) L.L.C., Taipei Branch
Yuichiro Isayama
+81(3)4587-9806 | yuichiro.isayama@gs.com Goldman Sachs Japan Co., Ltd.
Al Wang
+886(2)2730-4081 | al.wang@gs.com Goldman Sachs (Asia) L.L.C., Taipei Branch e92c7a75ab8b4efbba794e6b187208c8
All lae s monty revenue by segment al a glance
End market
1,000
900
800
700
Auto
Machine tools
600
500
Textiles
400
Packaging
300
200
Electronics
Battery
100
Energy lighting
Aug-21
Nov-21
Feb-22
May-22
For the exclusive use of KEVINLU@LENOVO.COM
% of revenue
5%
10%
7%
5%
8%
27%
16%
3%
May-24
Feb-23
May-23
Aug-23
Nov-23
Feb-24
Mthly rev (RMB $ m)
Aug-24
Nov-24
— YoY (RHS)
120%
100%
80%
60%
Exhibit 1: Strength/weakness in major segments of AirTAC
in July AirTAC's monthly revenue by segment at a glance 20%
33%
| 65% 18% |
|---|
| Feb-25 May-25 Aug-25 Nov-25 Feb-26 May-26 Aug-26 |
Revenue breakdown represents the contribution by each end-market customer for AirTAC's 'direct' sales, which represent more than 80%+ of its total revenue. Breakdown of distribution sales, which are c.20% of total sales, is not included in this data.
Source: Company data
For the month of August 2026, we estimate AirTAC's monthly revenue will slightly decline to Rmb828mn (-1% MoM, +35% YoY)/NT$3,934mn (-1% MoM, +52% YoY)
We expect August revenue will go down by 1% MoM to Rmb828mn/NT$3,934mn, mainly due to 6% less working days in Mainland China, while the growth remains strong from key customers (including battery, electronics and machine tools) and overall pneumatic UTR remains high at 100% despite in the low seasons. The company's backlog continues to increase as of the end of July, and we expect shipment to be solid in August in order to ful fi ll these undelivered orders, thus we believe the overall daily revenue in August should be higher than July (Rmb31.0mn vs. Rmb29.8mn).
Source: Company data, Goldman Sachs Global Investment Research
Investment view: Shipment and order continue to be better than expected since 2026 start. Maintain positive view on AirTAC
We reiterate our Buy rating on AirTAC, as we remain positive on the company's previous comment on the (1) solid 2026 revenue outlook, which is expected to see 20%+ YoY growth (see here), and (2) a prolonged upcycle that could last longer at 2-3 years this time with robust performance expected to sustain across multiple end markets, including battery/electronics/automotive/machine tools. Furthermore, the company will
Aug-22
Nov-22
YoY (%)
33%
27%
e92c7a75ab8b4efbba794e6b187208c8
For the exclusive use of KEVINLU@LENOVO.COM
continue to enhance internal operational e ffi ciency to mitigate the ongoing risk of higher raw material costs amid geopolitical uncertainties. Moreover, the company remains committed to maintain a stable pricing strategy in the China pneumatic market, which we believe should support further market share gains. We continue to see backlog accumulation and expect the company to maintain a high UTR to e ff ectively digest the growing order backlog.
Also, we believe AirTAC's strong B/S and healthy cash fl ow position will help the company to overcome potential industry demand risks, and further supporting market share gains during industry downturns (AirTAC's share gains have accelerated during industry downcycles historically, due to its solid B/S and cash fl ow management). We expect the company's ROE to continue to rise in the coming years (ROE should improve to 26.2% in 2028E per GSe vs. 16%-17% in 2022-25) supporting a high dividend payout ratio (50%-60%+ per year per GSe) in coming years.
Maintain Buy on AirTAC with an unchanged 12m TP of NT$1,925.
Investment Thesis - AirTAC
AirTAC is the 2nd-largest pneumatic supplier in mainland China with 28% market share in 2025, outpacing most local competitors, owing to its low-cost yet high quality product, and service quality reputation in most key cities in mainland China. We forecast its market share will reach 30% in 2026E and expect AirTAC to be the structural winner in a de fl ationary market, due to its: (1) strong market growth and leadership: AirTAC continues to expand its market share in mainland China driven by competitive pricing that is more than 10% lower vs. international peers (with 45%+ GM / 30-35% OPM) and high demand elasticity among mainland China customers; and (2) superior cost structure and fi nancial health: with best-in-class cash cost and a solid balance sheet, featuring positive net cash over FCF since 2023/2024, we believe AirTAC is well-equipped to weather industry downturns and capitalize on market restructuring.
Overall, we believe AirTAC will see better revenue/pro fi tability in the long term given its share gainer position in the China pneumatic market and potential to gain share in the linear guide market (improved demand in the next 1-2 years). This should lead to strengthened valuation, vs. its recent trading range (trading below its 10-year avg. P/E multiple). We are Buy rated on AirTAC.
Price target risks and methodology - AirTAC
Valuation methodology: Our 12m TP of NT$1,925 is based on a target P/E of 26.0x on our 2027E EPS (0.25x STDV above avg of the last pneumatic upcycle).
Key downside risks: (1) Stronger competition from peers; (2) sharper-than-expected Rmb depreciation, and (3) a longer-than-expected end-market demand downtrend in mainland China.
e92c7a75ab8b4efbba794e6b187208c8
For the exclusive use of KEVINLU@LENOVO.COM
1590.TW
12m Price Target:
NT$1,925.00
Price:
NT$1,425.00
Upside:
35.1%
| Buy | GS Forecast | ||||
|---|---|---|---|---|---|
| 1 2/25 | 1 2/26E | 1 2/27E | 1 2/28E | ||
| Market c ap: NT$272.5b n / $ 8 . 4 b n En terpr is e v a lu e: NT$2 6 2.2b n / $ 8 . 1 b n 3m AD T V : NT$ 1 . 3 b n / $ 39 .5 mn Ta iw a n Ta iw a n El e c tr onic Com p on e n t s M &A R a n k: 3 L ea s e s incl . in n et d ebt & EV? : N o | Revenue (NT$ mn) E BITDA (NT$ mn) E PS (NT$) | 34,329.9 | 45,643.9 | 53,446.1 | 60,126.1 |
| Market c ap: NT$272.5b n / $ 8 . 4 b n En terpr is e v a lu e: NT$2 6 2.2b n / $ 8 . 1 b n 3m AD T V : NT$ 1 . 3 b n / $ 39 .5 mn Ta iw a n Ta iw a n El e c tr onic Com p on e n t s M &A R a n k: 3 L ea s e s incl . in n et d ebt & EV? : N o | 12,865.9 | 17,645.7 | 21,223.6 | 24,179.9 | |
| Market c ap: NT$272.5b n / $ 8 . 4 b n En terpr is e v a lu e: NT$2 6 2.2b n / $ 8 . 1 b n 3m AD T V : NT$ 1 . 3 b n / $ 39 .5 mn Ta iw a n Ta iw a n El e c tr onic Com p on e n t s M &A R a n k: 3 L ea s e s incl . in n et d ebt & EV? : N o | 42.00 | 61.95 | 74.00 | 85.29 | |
| Market c ap: NT$272.5b n / $ 8 . 4 b n En terpr is e v a lu e: NT$2 6 2.2b n / $ 8 . 1 b n 3m AD T V : NT$ 1 . 3 b n / $ 39 .5 mn Ta iw a n Ta iw a n El e c tr onic Com p on e n t s M &A R a n k: 3 L ea s e s incl . in n et d ebt & EV? : N o | P/ E (X) | 20.9 | 23.0 | 19.3 | 16.7 |
| Market c ap: NT$272.5b n / $ 8 . 4 b n En terpr is e v a lu e: NT$2 6 2.2b n / $ 8 . 1 b n 3m AD T V : NT$ 1 . 3 b n / $ 39 .5 mn Ta iw a n Ta iw a n El e c tr onic Com p on e n t s M &A R a n k: 3 L ea s e s incl . in n et d ebt & EV? : N o | P/B (X) | 3.3 | 5.0 | 4.6 | 4.2 |
| Market c ap: NT$272.5b n / $ 8 . 4 b n En terpr is e v a lu e: NT$2 6 2.2b n / $ 8 . 1 b n 3m AD T V : NT$ 1 . 3 b n / $ 39 .5 mn Ta iw a n Ta iw a n El e c tr onic Com p on e n t s M &A R a n k: 3 L ea s e s incl . in n et d ebt & EV? : N o | Dividend yield (%) | 3.3 | 2.8 | 3.4 | 3.9 |
| Market c ap: NT$272.5b n / $ 8 . 4 b n En terpr is e v a lu e: NT$2 6 2.2b n / $ 8 . 1 b n 3m AD T V : NT$ 1 . 3 b n / $ 39 .5 mn Ta iw a n Ta iw a n El e c tr onic Com p on e n t s M &A R a n k: 3 L ea s e s incl . in n et d ebt & EV? : N o | N debt/ E BITDA (ex lease,X) | (0.3) | (0.6) | (0.7) | (0.8) |
| Market c ap: NT$272.5b n / $ 8 . 4 b n En terpr is e v a lu e: NT$2 6 2.2b n / $ 8 . 1 b n 3m AD T V : NT$ 1 . 3 b n / $ 39 .5 mn Ta iw a n Ta iw a n El e c tr onic Com p on e n t s M &A R a n k: 3 L ea s e s incl . in n et d ebt & EV? : N o | CR O CI (%) | 19.2 | 24.0 | 27.8 | 30.2 |
| Market c ap: NT$272.5b n / $ 8 . 4 b n En terpr is e v a lu e: NT$2 6 2.2b n / $ 8 . 1 b n 3m AD T V : NT$ 1 . 3 b n / $ 39 .5 mn Ta iw a n Ta iw a n El e c tr onic Com p on e n t s M &A R a n k: 3 L ea s e s incl . in n et d ebt & EV? : N o | F C F yield (%) | 2.8 | 4.3 | 4.0 | 5.0 |
| Market c ap: NT$272.5b n / $ 8 . 4 b n En terpr is e v a lu e: NT$2 6 2.2b n / $ 8 . 1 b n 3m AD T V : NT$ 1 . 3 b n / $ 39 .5 mn Ta iw a n Ta iw a n El e c tr onic Com p on e n t s M &A R a n k: 3 L ea s e s incl . in n et d ebt & EV? : N o | 6/26 | 9/26E | 1 2/26E | 3/27E | |
| Market c ap: NT$272.5b n / $ 8 . 4 b n En terpr is e v a lu e: NT$2 6 2.2b n / $ 8 . 1 b n 3m AD T V : NT$ 1 . 3 b n / $ 39 .5 mn Ta iw a n Ta iw a n El e c tr onic Com p on e n t s M &A R a n k: 3 L ea s e s incl . in n et d ebt & EV? : N o | E PS (NT$) | 16.55 | 16.64 | 15.40 | 16.11 |
Source: Company data, Goldman Sachs Research estimates, FactSet. Price as of 4 Aug 2026 close.
e92c7a75ab8b4efbba794e6b187208c8
For the exclusive use of KEVINLU@LENOVO.COM