PDF 原檔:報告_Daiwa_順德2351_20260807_original.pdf
圖片清單(已驗證 2026-08-10)
| 檔名 | size | 分類 | 親眼所見內容 |
|---|---|---|---|
報告_Daiwa_順德2351_20260807_001.png |
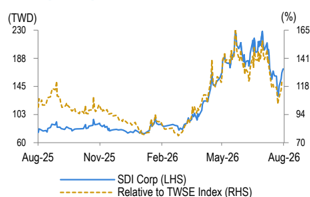
26KB | 真資料圖 | 順德股價(TWD,藍線)與相對 TWSE 指數(橘虛線)走勢圖,橫軸 Aug-25 至 Aug-26 |
報告_Daiwa_順德2351_20260807_002.png |
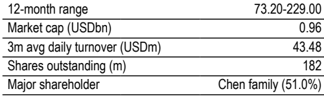
19KB | 真資料圖 | 公司數據小卡:12-month range 73.20-229.00、Market cap (USDbn) 0.96、3m avg daily turnover (USDm) 43.48、Shares outstanding (m) 182、Major shareholder Chen family (51.0%) |
報告_Daiwa_順德2351_20260807_003.png |
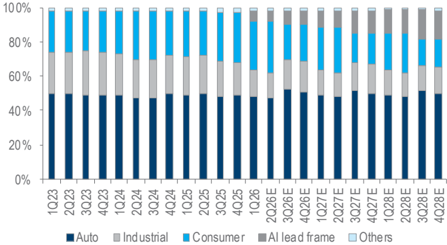
37KB | 真資料圖 | 營收結構堆疊長條圖(Auto/Industrial/Consumer/AI lead frame/Others 占比),橫軸 1Q23 至 4Q28E |
報告_Daiwa_順德2351_20260807_004.png |
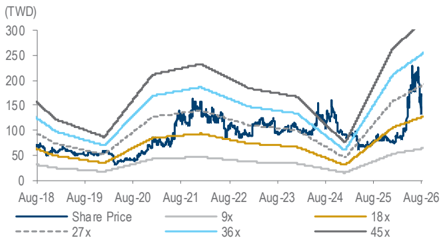
51KB | 真資料圖 | 1-year forward PER 帶狀圖(9x/18x/27x/36x/45x 各倍數線+股價線),橫軸 Aug-18 至 Aug-26 |
原始內容
Taiwan
SDI Corp (2351 TT)
Target price:
TWD265.00 (from TWD265.00)
Share price (7 Aug): TWD170.00 |
Up/downside: +55.9%
2Q26 review: net profit beat expectations
- AI lead frame revenue ramping up YTD
- Heat spreader products have started to contribute revenue in 2026
- Reaffirming our Buy (1) call with an unchanged 12M TP of TWD265
What's new: We had an update with SDI today (7 August). We see a brighter-than-expected revenue and gross margin outlook over 2H26, thanks to SDI's better-than-expected auto and consumer electronic segments plus upside potential for its AI lead frame and heat spreader sales. We reaffirm our Buy (1) call (see our latest memo, 2Q26 results review: EPS beat consensus , 6 August).
What's the impact: Key highlights for 2Q26 results: SDI's gross margin came in at 20.7% in 2Q26, higher than 19.1% in 1Q26 and 10.5% in 2Q25, and beating both our (19.5%) and the Bloomberg consensus (18.8%) estimates. We attribute this to a higher utilisation rate and efficiency (+2pp impact), cost control (+2.7pp) and price hike effect YTD despite an unfavourable copper price trend (-3pp). However, given a more favourable copper and currency environment as well as larger revenue scale and better segment mix (rising auto and AI lead frame revenue), we expect its 2H26 gross margin to be sustained at the 1H26 level.
Brighter lead frame outlook in 2H26 with rising AI lead frame and heat spreader revenue. The company expects its 2H26 revenue to grow by a high-single-digit % HoH. In 2H26, we expect its auto segment to keep the strongest momentum compared to its industrial and consumer segments due to the low inventory at its clients, demand recovery, localisation trend in China, electrification trend and new products' contribution (eg, ADAS). Its AI lead frames accounted for 6% of revenue in 2Q26, and management targets the revenue to expand QoQ in 2H26. SDI highlighted that it has received many rush orders for AI lead frames, and 40 new AI-related products are expected to be contribute >TWD150m per month. For its heat spreader, the company has won orders from US-based clients and should have some revenue contribution in the next 6 months. SDI plans to have a new production site outside China and Taiwan in the next 1-2 years, mainly for lead frame products. We lift our 2026-28E EPS by 3-11%, mainly on our more aggressive gross and operating margins forecasts.
What we recommend: We reaffirm our Buy (1) rating with an unchanged 12M TP of TWD265, now based on a target PER of 35x (from 39x), still at the lower end of its past-5-year range of 12-72x [average PER: 30x]) given its decelerating earnings trajectory (net profit CAGR of 31.1% over 202628E, from 125.5% over 2025-27E) on our 1-year forward EPS. Key downside risks: worse-than-expected end demand; worse-than-expected gross-margin expansion.
How we differ: Our 2026-28E EPS are 3-5% below the Bloomberg consensus, likely due to our slightly conservative view on its revenue.
Daiwa
5
3
→
2
1
Buy
Helen Chien
Helen Chien
(886) 2 8758 6254
helen.chien@daiwacm-cathay.com.tw
Neil Teng, CFA (886) 2 8758 6256 neil.teng@daiwacm-cathay.com.tw
Forecast revisions (%)
| Year to 31 Dec | 26E | 27E | 28E |
|---|---|---|---|
| Revenue change | 2.1 | 1.4 | 0.9 |
| Net profit change | 4.2 | 2.5 | 11 |
| Core EPS (FD) change | 4.2 | 2.5 | 11 |
Source: Daiwa forecasts
Share price performance
| 12-month range | 73.20-229.00 |
|---|---|
| Market cap (USDbn) | 0.96 |
| 3m avg daily turnover (USDm) | 43.48 |
| Shares outstanding (m) | 182 |
| Major shareholder | Chen family (51.0%) |
Financial summary (TWD)
| Year to 31 Dec | 26E | 27E | 28E |
|---|---|---|---|
| Revenue (m) | 13,358 | 15,657 | 17,858 |
| Operating profit (m) | 1,555 | 2,060 | 2,646 |
| Net profit (m) | 1,167 | 1,541 | 2,005 |
| Core EPS (fully-diluted) | 5.868 | 7.753 | 10.083 |
| EPS change (%) | 257.8 | 32.1 | 30.0 |
| Daiwa vs Cons. EPS (%) | (2.5) | (3.0) | (4.8) |
| PER (x) | 29.0 | 21.9 | 16.9 |
| Dividend yield (%) | 2.4 | 3.1 | 4.1 |
| DPS | 4.0 | 5.3 | 6.9 |
| PBR (x) | 4.0 | 3.7 | 3.3 |
| EV/EBITDA (x) | 14.8 | 12.1 | 10.0 |
| ROE (%) | 15.5 | 18.4 | 21.8 |
Source: FactSet, Daiwa forecasts
SDI: revisions to revenue and earnings forecasts
| (TWDm) | 2026E | 2026E | 2026E | 2027E | 2027E | 2027E | 2028E | 2028E | 2028E |
|---|---|---|---|---|---|---|---|---|---|
| New | Previous | Change | New | Previous | Change | New | Previous | Change | |
| Sales | 13,358 | 13,078 | 2.1% | 15,657 | 15,435 | 1.4% | 17,858 | 17,694 | 0.9% |
| Gross profit | 2,716 | 2,502 | 8.6% | 3,266 | 3,088 | 5.8% | 3,892 | 3,511 | 10.8% |
| Gross profit margin | 20.3% | 19.1% | 1.2pp | 20.9% | 20.0% | 0.8pp | 21.8% | 19.8% | 1.9pp |
| Operating profit | 1,555 | 1,465 | 6.2% | 2,060 | 1,972 | 4.4% | 2,646 | 2,355 | 12.3% |
| Operating profit margin | 11.6% | 11.2% | 0.4pp | 13.2% | 12.8% | 0.4pp | 14.8% | 13.3% | 1.5pp |
| Net profit | 1,167 | 1,120 | 4.2% | 1,541 | 1,504 | 2.5% | 2,005 | 1,806 | 11.0% |
| Net profit margin | 8.7% | 8.6% | 0.2pp | 9.8% | 9.7% | 0.1pp | 11.2% | 10.2% | 1pp |
| Diluted EPS (TWD) | 5.87 | 5.63 | 4.2% | 7.75 | 7.56 | 2.5% | 10.08 | 9.09 | 11.0% |
Source: Daiwa forecasts
SDI: 2Q26 results vs. Daiwa and Bloomberg forecasts
| (TWDm) | SDI's 2Q26 results | Daiwa forecast | Differ | Bloomberg consensus | Differ |
|---|---|---|---|---|---|
| Revenue | 3,559 | 3,421 | 4.0% | 3,420 | 4.1% |
| Gross profit | 737 | 667 | 10.6% | 642 | 14.9% |
| Operating profit | 417 | 411 | 1.4% | 362 | 15.1% |
| Profit before tax | 414 | 408 | 1.6% | 363 | 14.1% |
| Net profit | 303 | 307 | -1.4% | 273 | 10.9% |
| Basic EPS (TWD) | 1.60 | 1.69 | -5.0% | 1.46 | 9.9% |
| Margin | |||||
| Gross margin | 20.7% | 19.5% | 1.2pp | 18.8% | 2pp |
| Operating margin | 11.7% | 12.0% | -0.3pp | 10.6% | 1.1pp |
| Pre-tax margin | 11.6% | 11.9% | -0.3pp | 10.6% | 1pp |
| Net margin | 8.5% | 9.0% | -0.5pp | 8.0% | 0.5pp |
Source: Company, Bloomberg, Daiwa forecasts
SDI: quarterly P&L
| 2026E | 2026E | 2026E | 2026E | 2027E | 2026E | 2027E | 2028E | ||||
|---|---|---|---|---|---|---|---|---|---|---|---|
| (TWDm) | 1Q26 | 2Q26E | 3Q26E | 4Q26E | 1Q27E | 2Q27E | 3Q27E | 4Q27E | |||
| Revenue | 2,805 | 3,559 | 3,577 | 3,417 | 3,249 | 4,121 | 4,233 | 4,054 | 13,358 | 15,657 | 17,858 |
| Gross profit | 536 | 737 | 742 | 701 | 643 | 825 | 921 | 876 | 2,716 | 3,266 | 3,892 |
| Operating profit | 272 | 417 | 456 | 411 | 354 | 526 | 612 | 567 | 1,555 | 2,060 | 2,646 |
| Pre-tax profit | 292 | 414 | 453 | 408 | 351 | 523 | 610 | 564 | 1,567 | 2,048 | 2,635 |
| Net profit | 222 | 303 | 339 | 303 | 258 | 394 | 462 | 427 | 1,167 | 1,541 | 2,005 |
| Basic EPS (TWD) | 1.22 | 1.60 | 1.79 | 1.60 | 1.37 | 2.08 | 2.45 | 2.26 | 6.21 | 8.15 | 10.60 |
| Margin | |||||||||||
| Gross margin | 19.1% | 20.7% | 20.7% | 20.5% | 19.8% | 20.0% | 21.8% | 21.6% | 20.3% | 20.9% | 21.8% |
| Operating margin | 9.7% | 11.7% | 12.7% | 12.0% | 10.9% | 12.8% | 14.5% | 14.0% | 11.6% | 13.2% | 14.8% |
| Pre-tax margin | 10.4% | 11.6% | 12.7% | 11.9% | 10.8% | 12.7% | 14.4% | 13.9% | 11.7% | 13.1% | 14.8% |
| Net margin | 7.9% | 8.5% | 9.5% | 8.9% | 7.9% | 9.6% | 10.9% | 10.5% | 8.7% | 9.8% | 11.2% |
| YoY | |||||||||||
| Revenue | 11.0% | 37.2% | 40.7% | 32.2% | 15.8% | 15.8% | 18.3% | 18.6% | 30.4% | 17.2% | 14.1% |
| Gross profit | 45.6% | 170.9% | 134.6% | 71.6% | 19.9% | 11.9% | 24.2% | 25.0% | 99.0% | 20.2% | 19.2% |
| Operating profit | 85.0% | 486.2% | 339.9% | 132.0% | 30.3% | 26.2% | 34.4% | 38.0% | 211.8% | 32.4% | 28.5% |
| Pre-tax profit | 92.3% | n.m. | 256.3% | 105.6% | 20.3% | 26.3% | 34.6% | 38.3% | 256.7% | 30.7% | 28.6% |
| Net profit | 97.1% | n.m. | 287.6% | 108.1% | 16.5% | 30.1% | 36.6% | 40.7% | 284.7% | 32.1% | 30.0% |
| QoQ | |||||||||||
| Revenue | 8.6% | 26.9% | 0.5% | -4.5% | -4.9% | 26.8% | 2.7% | -4.2% | |||
| Gross profit | 31.4% | 37.5% | 0.6% | -5.5% | -8.2% | 28.3% | 11.7% | -4.9% | |||
| Operating profit | 53.5% | 53.4% | 9.3% | -9.8% | -13.8% | 48.6% | 16.4% | -7.4% | |||
| Pre-tax profit | 47.1% | 41.9% | 9.3% | -9.9% | -13.9% | 49.0% | 16.5% | -7.4% | |||
| Net profit | 52.2% | 36.7% | 11.7% | -10.5% | -14.8% | 52.7% | 17.3% | -7.7% |
Source: Company, Daiwa forecasts
SDI: revenue breakdown by application
Source: Company, Daiwa Forecasts
SDI Corp (2351 TT): 7 August 2026
SDI: 1-year forward PER
Source: Bloomberg, Daiwa forecasts
Daiwa
Financial summary
Key assumptions
| Year to 31 Dec | 2021 | 2022 | 2023 | 2024 | 2025 | 2026E | 2027E | 2028E |
|---|---|---|---|---|---|---|---|---|
| Auto revenue growth (%) | 78.2 | 26.0 | (1.4) | (4.1) | (2.8) | 37.2 | 20 | 15 |
| Industrial revenue growth (%) | 9.7 | (0.3) | (11.4) | (8.6) | (12.7) | 7.5 | 10 | 10 |
| Consumer revenue growth (%) | 26.9 | (10.0) | (7.7) | 11.3 | (2.0) | 23 | 2 | 2 |
Profit and loss (TWDm)
| Year to 31 Dec | 2021 | 2022 | 2023 | 2024 | 2025 | 2026E | 2027E | 2028E |
|---|---|---|---|---|---|---|---|---|
| Electronics | 9,455 | 10,112 | 9,418 | 9,277 | 8,865 | 12,053 | 14,353 | 16,554 |
| Stationery | 1,697 | 1,612 | 1,439 | 1,538 | 1,382 | 1,305 | 1,305 | 1,305 |
| Other Revenue | 0 | 0 | 0 | 0 | 0 | 0 | 0 | 0 |
| Total Revenue | 11,153 | 11,724 | 10,857 | 10,815 | 10,247 | 13,358 | 15,657 | 17,858 |
| Other income | 0 | 0 | 0 | 0 | 0 | 0 | 0 | 0 |
| COGS | (9,043) | (9,646) | (9,002) | (9,094) | (8,882) | (10,642) | (12,391) | (13,966) |
| SG&A | (637) | (655) | (633) | (633) | (597) | (716) | (756) | (776) |
| Other op.expenses | (248) | (254) | (242) | (259) | (269) | (445) | (450) | (470) |
| Operating profit | 1,225 | 1,169 | 979 | 829 | 499 | 1,555 | 2,060 | 2,646 |
| Net-interest inc./(exp.) | (57) | (71) | (50) | (50) | (52) | (57) | (56) | (56) |
| Assoc/forex/extraord./others | (1) | 172 | 72 | 118 | (7) | 68 | 45 | 45 |
| Pre-tax profit | 1,168 | 1,270 | 1,001 | 897 | 439 | 1,567 | 2,048 | 2,635 |
| Tax | (257) | (270) | (220) | (167) | (95) | (332) | (430) | (553) |
| Min. int./pref. div./others | (58) | (59) | (38) | (55) | (42) | (68) | (77) | (77) |
| Net profit (reported) | 852 | 941 | 743 | 675 | 303 | 1,167 | 1,541 | 2,005 |
| Net profit (adjusted) | 852 | 941 | 743 | 675 | 303 | 1,167 | 1,541 | 2,005 |
| EPS (reported)(TWD) | 4.679 | 5.164 | 4.078 | 3.706 | 1.665 | 6.214 | 8.151 | 10.600 |
| EPS (adjusted)(TWD) | 4.679 | 5.164 | 4.078 | 3.706 | 1.665 | 6.214 | 8.151 | 10.600 |
| EPS (adjusted fully-diluted)(TWD) | 4.679 | 5.164 | 4.078 | 3.706 | 1.640 | 5.868 | 7.753 | 10.083 |
| DPS (TWD) | 3.000 | 3.200 | 2.600 | 2.500 | 1.100 | 4.039 | 5.298 | 6.890 |
| EBIT | 1,225 | 1,169 | 979 | 829 | 499 | 1,555 | 2,060 | 2,646 |
| EBITDA | 1,899 | 1,830 | 1,651 | 1,535 | 1,200 | 2,325 | 2,898 | 3,552 |
Cash flow (TWDm)
| Year to 31 Dec | 2021 | 2022 | 2023 | 2024 | 2025 | 2026E | 2027E | 2028E |
|---|---|---|---|---|---|---|---|---|
| Profit before tax | 1,168 | 1,270 | 1,001 | 897 | 439 | 1,567 | 2,048 | 2,635 |
| Depreciation and amortisation | 674 | 661 | 672 | 707 | 701 | 769 | 838 | 906 |
| Tax paid | (257) | (270) | (220) | (167) | (95) | (332) | (430) | (553) |
| Change in working capital | (1,358) | 188 | 375 | (105) | 276 | (1,566) | (1,067) | (956) |
| Other operational CF items | 294 | 148 | (102) | (142) | (37) | (72) | (49) | (49) |
| Cash flow from operations | 521 | 1,996 | 1,726 | 1,190 | 1,284 | 366 | 1,340 | 1,982 |
| Capex | (1,194) | (815) | (695) | (587) | (933) | (1,300) | (1,300) | (1,300) |
| Net (acquisitions)/disposals | 3 | 2 | 23 | 6 | 6 | 0 | 0 | 0 |
| Other investing CF items | (32) | (26) | (17) | 25 | (77) | 0 | 0 | 0 |
| Cash flow from investing | (1,223) | (838) | (689) | (556) | (1,005) | (1,300) | (1,300) | (1,300) |
| Change in debt | 1,023 | (204) | (617) | 121 | (997) | 1,077 | 0 | 500 |
| Net share issues/(repurchases) | 0 | 0 | 0 | 0 | 0 | 0 | 0 | 0 |
| Dividends paid | (328) | (546) | (583) | (474) | (455) | (200) | (758) | (1,002) |
| Other financing CF items | (53) | (52) | (57) | (50) | 1,125 | 0 | 0 | 0 |
| Cash flow from financing | 642 | (803) | (1,257) | (402) | (328) | 877 | (758) | (502) |
| Forex effect/others | (2) | 1 | (1) | 4 | 2 | 0 | 0 | 0 |
| Change in cash | (62) | 356 | (222) | 236 | (46) | (57) | (718) | 180 |
| Free cash flow | (673) | 1,182 | 1,031 | 603 | 351 | (934) | 40 | 682 |
Source: FactSet, Daiwa forecasts
SDI Corp (2351 TT): 7 August 2026
Daiwa
Financial summary continued …
Balance sheet (TWDm)
| Year to 31 Dec | 2021 | 2022 | 2023 | 2024 | 2025 | 2026E | 2027E | 2028E |
|---|---|---|---|---|---|---|---|---|
| Cash & short-term investment | 702 | 1,059 | 837 | 1,073 | 1,026 | 970 | 252 | 432 |
| Inventory | 4,087 | 3,866 | 3,578 | 3,654 | 3,807 | 4,419 | 5,229 | 5,846 |
| Accounts receivable | 2,563 | 2,140 | 1,933 | 2,129 | 2,033 | 2,616 | 3,070 | 3,500 |
| Other current assets | 223 | 195 | 186 | 193 | 202 | 202 | 202 | 202 |
| Total current assets | 7,575 | 7,260 | 6,534 | 7,049 | 7,068 | 8,207 | 8,753 | 9,980 |
| Fixed assets | 4,951 | 5,191 | 5,178 | 5,062 | 5,232 | 5,780 | 6,259 | 6,670 |
| Goodwill & intangibles | 74 | 57 | 52 | 57 | 78 | 78 | 78 | 78 |
| Other non-current assets | 444 | 418 | 381 | 368 | 358 | 358 | 358 | 358 |
| Total assets | 13,045 | 12,926 | 12,145 | 12,535 | 12,736 | 14,422 | 15,447 | 17,086 |
| Short-term debt | 1,002 | 1,201 | 1,189 | 1,205 | 1,250 | 2,327 | 2,327 | 2,327 |
| Accounts payable | 2,202 | 1,752 | 1,535 | 1,526 | 1,804 | 1,241 | 1,544 | 1,685 |
| Other current liabilities | 345 | 432 | 370 | 274 | 214 | 205 | 205 | 205 |
| Total current liabilities | 3,549 | 3,386 | 3,094 | 3,004 | 3,269 | 3,774 | 4,077 | 4,217 |
| Long-term debt | 2,381 | 1,998 | 1,381 | 1,535 | 1,616 | 1,616 | 1,616 | 2,116 |
| Other non-current liabilities | 581 | 556 | 554 | 578 | 574 | 574 | 574 | 574 |
| Total liabilities | 6,511 | 5,940 | 5,028 | 5,117 | 5,459 | 5,964 | 6,267 | 6,908 |
| Share capital | 1,821 | 1,821 | 1,821 | 1,821 | 1,821 | 1,877 | 1,891 | 1,891 |
| Reserves/R.E./others | 4,365 | 4,806 | 4,946 | 5,234 | 5,140 | 6,196 | 6,828 | 7,749 |
| Shareholders' equity | 6,187 | 6,628 | 6,767 | 7,055 | 6,961 | 8,074 | 8,719 | 9,640 |
| Minority interests | 346 | 358 | 350 | 363 | 316 | 385 | 461 | 538 |
| Total equity & liabilities | 13,045 | 12,926 | 12,145 | 12,535 | 12,736 | 14,422 | 15,447 | 17,086 |
| EV | 33,992 | 33,463 | 33,046 | 32,994 | 33,120 | 34,322 | 35,117 | 35,513 |
| Net debt/(cash) | 2,681 | 2,141 | 1,732 | 1,667 | 1,840 | 2,974 | 3,692 | 4,011 |
| BVPS (TWD) | 33.967 | 36.388 | 37.154 | 38.735 | 38.219 | 43.006 | 46.105 | 50.978 |
Key ratios (%)
| Year to 31 Dec | 2021 | 2022 | 2023 | 2024 | 2025 | 2026E | 2027E | 2028E |
|---|---|---|---|---|---|---|---|---|
| Sales (YoY) | 32.0 | 5.1 | (7.4) | (0.4) | (5.2) | 30.4 | 17.2 | 14.1 |
| EBITDA (YoY) | 46.4 | (3.6) | (9.8) | (7.0) | (21.9) | 93.8 | 24.7 | 22.6 |
| Operating profit (YoY) | 103.7 | (4.6) | (16.3) | (15.4) | (39.8) | 211.8 | 32.4 | 28.5 |
| Net profit (YoY) | 144.1 | 10.4 | (21.0) | (9.1) | (55.1) | 284.7 | 32.1 | 30 |
| Core EPS (fully-diluted) (YoY) | 144.1 | 10.4 | (21.0) | (9.1) | (55.8) | 257.8 | 32.1 | 30 |
| Gross-profit margin | 18.9 | 17.7 | 17.1 | 15.9 | 13.3 | 20.3 | 20.9 | 21.8 |
| EBITDA margin | 17.0 | 15.6 | 15.2 | 14.2 | 11.7 | 17.4 | 18.5 | 19.9 |
| Operating-profit margin | 11.0 | 10.0 | 9.0 | 7.7 | 4.9 | 11.6 | 13.2 | 14.8 |
| Net profit margin | 7.6 | 8.0 | 6.8 | 6.2 | 3.0 | 8.7 | 9.8 | 11.2 |
| ROAE | 14.4 | 14.7 | 11.1 | 9.8 | 4.3 | 15.5 | 18.4 | 21.8 |
| ROAA | 7.2 | 7.2 | 5.9 | 5.5 | 2.4 | 8.6 | 10.3 | 12.3 |
| ROCE | 13.4 | 11.6 | 9.9 | 8.4 | 4.9 | 13.8 | 16.1 | 19.1 |
| ROIC | 11.4 | 10.0 | 8.5 | 7.5 | 4.3 | 11.9 | 13.4 | 15.4 |
| Net debt to equity | 43.3 | 32.3 | 25.6 | 23.6 | 26.4 | 36.8 | 42.3 | 41.6 |
| Effective tax rate | 22.0 | 21.3 | 22.0 | 18.6 | 21.5 | 21.2 | 21 | 21 |
| Accounts receivable (days) | 73.7 | 73.2 | 68.5 | 68.5 | 74.1 | 63.5 | 66.3 | 67.1 |
| Current ratio (x) | 2.1 | 2.1 | 2.1 | 2.3 | 2.2 | 2.2 | 2.1 | 2.4 |
| Net interest cover (x) | 21.4 | 16.4 | 19.5 | 16.4 | 9.5 | 27.4 | 36.6 | 47 |
| Net dividend payout | 64.1 | 62.0 | 63.8 | 67.4 | 66.1 | 65.0 | 65 | 65 |
| Free cash flow yield | n.a. | 3.8 | 3.3 | 1.9 | 1.1 | n.a. | 0.1 | 2.2 |
Source: FactSet, Daiwa forecasts
Company profile
Founded in 1967, SDI started out as a stationery producer and set up its electronics department in 1983. SDI is currently the No.1 power lead frame manufacturer in the world, whose major segments are automotive (42% of total revenue in 2025), industrial (18%), consumer (24%), stationery (13%) and others (2%). Its electrical business accounted for 87% of total revenue in 2025. The company was listed on Taiwan's main board in April 1996.
SDI Corp (2351 TT): 7 August 2026
Daiwa
ESG analysis
ESG risks
| Risks | Risks | Management | Analyst comments |
|---|---|---|---|
| G | Executive/board quality | 2 | The CEO and chairperson of SDI are not the same individual. SDI's board has 10 members, including 4 independent directors (40% of total). This ratio is higher than the regulatory requirement of at least 20%. There is a compensation committee overseen by SDI's board. |
| Capital management | 1 | SDI's payout ratio has been stable over the past decade (generally c.60%). SDI's dividend payout ratio was 66% in 2025; we believe SDI's long-term goal is to maintain a highly stable dividend payout policy. | |
| S | Related party & transaction Supply chain management | 2 1 | Revenue generated from related-party transactions is <1%, and the transaction conditions are no different than normal transactions. Thus, we see limited risk. SDI has set several evaluation standards for its existing and new suppliers; the company's supply chain adopts the Hazardous Substance Process Management standard in accordance with the IECQ QC080000 standard. The company also requires its direct materials suppliers |
| E | Water & wastewater management | 2 | We note that SDI has made efforts in lowering water consumption, with three chemical treatment systems for processing waste water, one biological treatment system and one small-scale batch treatment system with a high-concentration degreasing agent. |
Note: Management score represents a company's ability to manage/benefit from certain ESG topics. The scores range from 1 to 3, with 1 being the strongest.
Update Date: 27 May 2026 Source: Daiwa, Company
SDI Corp (2351 TT): 7 August 2026
Daiwa