PDF 原檔:報告_Daiwa_金像電2368_20260811_original.pdf
圖片清單(已驗證 2026-08-13)
| 檔名 | size | 分類 | 親眼所見內容 |
|---|---|---|---|
260811_daiwa_GCE_001.png |
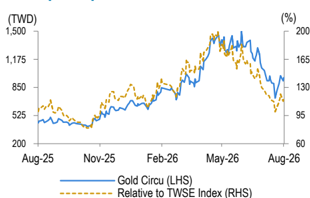
28KB | 真資料圖 | 股價表現圖:GCE 股價(左軸)vs 相對 TWSE 指數表現(右軸),2025-08 至 2026-08 |
260811_daiwa_GCE_002.png |
20KB | 真資料圖 | 12-month range/市值/日均成交量/股數/大股東(Yang Chang-Yi 19.7%)數據表 |
260811_daiwa_GCE_003.png |
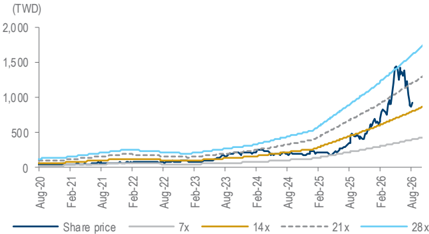
33KB | 真資料圖 | 1 年期遠期 P/E 估值帶(7x/14x/21x/28x),股價 2020-08 至 2026-08 |
260811_daiwa_GCE_004.png |
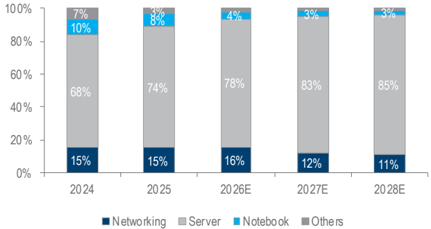
25KB | 真資料圖 | 營收結構堆疊圖:Networking/Server/Notebook/Others 占比,2024-2028E(Server 占比由 68%→85%) |
圖片清單已於 2026-08-13 逐張 Read 驗證,本份報告雖全數 <40KB(低於常規篩選門檻),因報告僅 4 張圖且皆為文字引用之明確資料圖,故逐張補驗;全數為真資料圖,無裝飾/文字卡。
原始內容
Taiwan
Gold Circuit Electronics (2368 TT)
Target price:
TWD1,650.00 (from TWD1,650.00)
Share price (11 Aug): TWD964.00 | Up/downside: +71.2%
2Q26 results review: profitability missed slightly
- Near-term fundamentals are largely on track
- Investors' concern over HDI technology is excessive
- Maintaining our Buy (1) rating and 12M TP of TWD1,650
What's new: We provide updates after its 2Q26 results on 11 August.
What's the impact: 2Q26 core business miss on profitability. GCE's 2Q26 earnings came in at TWD4.78bn (EPS: TWD9.4), which was 9% and 8% higher than our and consensus estimates on a lower tax rate. While revenue was 5% higher than expectation on solid AI server demand, 2Q26 gross margin decreased by 0.1pp QoQ to 34.7% due likely to a c.30% price hike by its CCL vendors in 2Q26. GCE could not pass through the cost immediately to end customers. Meanwhile, the operating margin fell by 0.4pp QoQ to 26.4% on the gross margin contraction and higher-thanexpected opex ratio (increased 0.2pp QoQ despite the 26% revenue QoQ growth in 2Q26). Lastly, net income was impacted by a higher nonoperating loss of TWD118m in 2Q26, although it was offset by lower tax rate of 24.1% in 2Q26 (vs. 32-33% in 2024-25).
Business outlook. GCE's share price has corrected 36% from the recent peak in June. We believe investors' concern about potential spec changes are one reason. Given higher computing power requirements and I/O support, AI server mainboards from the next generation (eg, Trainium 4 or TPU v9) would also shift from a pure high layer count (HLC) board to a fusion between HLC board and high-density interconnect (HDI), with the surface layer adopting HDI so that it can input more traces due to its strength of a smaller trace/space ratio. However, as GCE has specialised in HLC for many years, investors are worried about GCE's capability with HDI. We believe the concern is unwarranted given GCE's excellent track record in execution. Second, given the strong price hikes within the PCB sector, investors might shift from GCE to other companies, which might case a derating given limited funding. We believe GCE's progress is largely on track as it controls the highest market share from its key CSP client, and it is likely to penetrate a second CSP from 1H27. In this note, we factor in the capacities from the Suzhou and Taiwan plants in 2027-28, which support a 32% upward revision in the 2028E revenue.
What we recommend: We raise our 2026-28E EPS by 10-38% to reflect the capacity ramp-ups and ongoing ASP increases by GCE. We reaffirm our Buy (1) call and maintain our 12M TP of TWD1,650, with a lower PER target of 26x (from 35x; high end of its past-3-year range of 7-28x), on our 4-quarter forward diluted EPS forecast, to reflect market concerns over HDI. Key downside risk: worse-than-expected AI server demand.
How we differ: Our 2026-28E earnings are 8-14% higher than the consensus, due likely to our higher revenue assumptions.
11 August 2026
5
Daiwa
3
2
1
→
Buy
Sheng Cheng (886) 2 8758 6253 sheng.cheng@daiwacm-cathay.com.tw
Allan Wang (886) 2 8758 6249 allan.wang@daiwacm-cathay.com.tw
Forecast revisions (%)
| Year to 31 Dec | 26E | 27E | 28E |
|---|---|---|---|
| Revenue change | 9.3 | 15.9 | 31.8 |
| Net profit change | 11.5 | 18.4 | 39.2 |
| Core EPS (FD) change | 10.3 | 17.2 | 37.8 |
Source: Daiwa forecasts
Share price performance
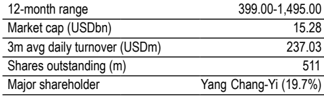
| 12-month range | 399.00-1,495.00 |
|---|---|
| Market cap (USDbn) | 15.28 |
| 3m avg daily turnover (USDm) | 237.03 |
| Shares outstanding (m) | 511 |
| Major shareholder | Yang Chang-Yi (19.7%) |
Financial summary (TWD)
| Year to 31 Dec | 26E | 27E | 28E |
|---|---|---|---|
| Revenue (m) | 107,164 | 157,914 | 218,256 |
| Operating profit (m) | 29,573 | 48,569 | 73,797 |
| Net profit (m) | 21,082 | 34,600 | 52,511 |
| Core EPS (fully-diluted) | 41.295 | 67.772 | 102.856 |
| EPS change (%) | 117.1 | 64.1 | 51.8 |
| Daiwa vs Cons. EPS (%) | 7.5 | 9.0 | 13.6 |
| PER (x) | 23.3 | 14.2 | 9.4 |
| Dividend yield (%) | 1.0 | 2.0 | 3.1 |
| DPS | 10.0 | 19.0 | 30.0 |
| PBR (x) | 9.9 | 6.6 | 4.4 |
| EV/EBITDA (x) | 16.3 | 10.1 | 6.5 |
| ROE (%) | 50.8 | 55.8 | 56.5 |
Source: FactSet, Daiwa forecasts
GCE: Daiwa's revenue and earnings forecasts vs. consensus
| 2026E | 2026E | 2026E | 2027E | 2027E | 2027E | 2028E | 2028E | 2028E | |
|---|---|---|---|---|---|---|---|---|---|
| (TWDm) | Previous | New | Consensus | Previous | New | Consensus | Previous | New | Consensus |
| Revenue | 98,075 | 107,164 | 99,504 | 136,201 | 157,914 | 142,210 | 165,608 | 218,256 | 180,508 |
| Diff (%) | 9.3% | 7.7% | 15.9% | 11.0% | 31.8% | 20.9% | |||
| Gross Margin (%) | 36.4% | 35.5% | 36.3% | 38.8% | 38.0% | 38.3% | 40.6% | 40.2% | 38.6% |
| Operating profit | 27,739 | 29,573 | 28,870 | 42,041 | 48,569 | 46,773 | 54,328 | 73,797 | 65,013 |
| Op Margin (%) | 28.3% | 27.6% | 29.0% | 30.9% | 30.8% | 32.9% | 32.8% | 33.8% | 36.0% |
| Net profit | 18,905 | 21,082 | 19,614 | 29,219 | 34,600 | 31,740 | 37,715 | 52,511 | 46,213 |
| EPS (TWD) | 37.43 | 41.29 | 38.42 | 57.84 | 67.77 | 62.17 | 74.66 | 102.86 | 90.52 |
| Diff (%) | 10.3% | 7.5% | 17.2% | 9.0% | 37.8% | 13.6% |
Source: Bloomberg, Daiwa forecasts
GCE: quarterly and annual P&L statement
| 2026E | 2026E | 2026E | 2026E | 2027E | 2025 | 2026 | 2027E | 2028E | ||||
|---|---|---|---|---|---|---|---|---|---|---|---|---|
| (TWDm) | 1Q | 2Q | 3QE | 4QE | 1QE | 2QE | 3QE | 4QE | ||||
| Net revenue | 19,313 | 24,279 | 31,849 | 31,723 | 32,792 | 38,161 | 41,962 | 44,999 | 60,004 | 107,164 | 157,914 | 218,256 |
| COGS | -12,590 | -15,866 | -20,398 | -20,213 | -20,744 | -23,902 | -25,849 | -27,478 | -40,321 | -69,068 | -97,974 | -130,552 |
| Gross profit | 6,722 | 8,413 | 11,451 | 11,510 | 12,048 | 14,259 | 16,113 | 17,521 | 19,683 | 38,097 | 59,941 | 87,704 |
| Operating expenses | -1,538 | -1,996 | -2,484 | -2,506 | -2,492 | -2,748 | -2,937 | -3,195 | -5,640 | -8,524 | -11,372 | -13,907 |
| Operating profit | 5,185 | 6,418 | 8,967 | 9,004 | 9,556 | 11,511 | 13,175 | 14,326 | 14,043 | 29,573 | 48,569 | 73,797 |
| Non-operating profit | -97 | -118 | 39 | 40 | 41 | 41 | 41 | 40 | 130 | -136 | 163 | 163 |
| Pre-tax profit | 5,088 | 6,299 | 9,006 | 9,043 | 9,597 | 11,552 | 13,216 | 14,366 | 14,173 | 29,437 | 48,732 | 73,960 |
| Income taxes | -1,604 | -1,516 | -2,612 | -2,623 | -2,783 | -3,350 | -3,833 | -4,166 | -4,567 | -8,354 | -14,132 | -21,448 |
| Net profit | 3,484 | 4,783 | 6,394 | 6,421 | 6,814 | 8,202 | 9,384 | 10,200 | 9,607 | 21,082 | 34,600 | 52,511 |
| Net EPS (TWD) | 6.82 | 9.37 | 12.53 | 12.58 | 13.35 | 16.07 | 18.38 | 19.98 | 19.02 | 41.29 | 67.77 | 102.86 |
| Operating Ratios | ||||||||||||
| Gross margin | 34.8% | 34.7% | 36.0% | 36.3% | 36.7% | 37.4% | 38.4% | 38.9% | 32.8% | 35.5% | 38.0% | 40.2% |
| Operating margin | 26.8% | 26.4% | 28.2% | 28.4% | 29.1% | 30.2% | 31.4% | 31.8% | 23.4% | 27.6% | 30.8% | 33.8% |
| Pre-tax margin | 26.3% | 25.9% | 28.3% | 28.5% | 29.3% | 30.3% | 31.5% | 31.9% | 23.6% | 27.5% | 30.9% | 33.9% |
| Net margin | 18.0% | 19.7% | 20.1% | 20.2% | 20.8% | 21.5% | 22.4% | 22.7% | 16.0% | 19.7% | 21.9% | 24.1% |
| YoY (%) | ||||||||||||
| Net revenue | 60% | 75% | 80% | 93% | 70% | 57% | 32% | 42% | 54% | 79% | 47% | 38% |
| Gross profit | 78% | 105% | 82% | 108% | 79% | 69% | 41% | 52% | 73% | 94% | 57% | 46% |
| Operating profit | 104% | 124% | 93% | 126% | 84% | 79% | 47% | 59% | 74% | 111% | 64% | 52% |
| Pre-tax profit | 92% | 151% | 90% | 111% | 89% | 83% | 47% | 59% | 67% | 108% | 66% | 52% |
| Net profit | 99% | 182% | 98% | 119% | 96% | 71% | 47% | 59% | 71% | 119% | 64% | 52% |
| QoQ (%) | ||||||||||||
| Net revenue | 18% | 26% | 31% | 0% | 3% | 16% | 10% | 7% | ||||
| Gross profit | 22% | 25% | 36% | 1% | 5% | 18% | 13% | 9% | ||||
| Operating profit | 30% | 24% | 40% | 0% | 6% | 20% | 14% | 9% | ||||
| Pre-tax profit | 19% | 24% | 43% | 0% | 6% | 20% | 14% | 9% | ||||
| Net profit | 19% | 37% | 34% | 0% | 6% | 20% | 14% | 9% |
Source: Company, Daiwa forecasts
GCE: 2Q26 comparison table
| (TWDm) | Actual | QoQ% | YoY% | Daiwa | Diff% | Consensus | Diff% |
|---|---|---|---|---|---|---|---|
| Revenue | 24,279 | 26% | 75% | 23,186 | 5% | 23,182 | 5% |
| Gross profit | 8,413 | 25% | 105% | 8,326 | 1% | 8,349 | 1% |
| Gross margin (%) | 34.7% | 35.9% | 36.0% | ||||
| Operating profit | 6,418 | 24% | 124% | 6,425 | 0% | 6,516 | -2% |
| Operating margin (%) | 26.4% | 27.7% | 28.1% | ||||
| Pre-tax profit | 6,299 | 24% | 151% | 6,469 | -3% | 6,541 | -4% |
| Net profit | 4,783 | 37% | 182% | 4,399 | 9% | 4,413 | 8% |
| EPS (TWD) | 9.37 | 37% | 182% | 8.71 | 9% | 8.74 | 8% |
Source: Company data, Daiwa forecasts, Bloomberg
GCE: 1-year forward PER bands
Source: TEJ, Daiwa forecasts
Gold Circuit Electronics (2368 TT): 11 August 2026
GCE: revenue breakdown by product
Source: Company, Daiwa forecasts
Daiwa
Financial summary
Key assumptions
| Year to 31 Dec | 2021 | 2022 | 2023 | 2024 | 2025 | 2026E | 2027E | 2028E |
|---|---|---|---|---|---|---|---|---|
| Networking PCB shipment (k sqft) | 7,492.8 | 9,106.7 | 6,894.0 | 8,096.6 | 11,598.2 | 16,534.2 | 15,803.3 | 18,108.6 |
| Server PCB shipment (k sqft) | 24,031.1 | 33,555.9 | 29,493.9 | 34,972.5 | 54,601.1 | 65,526.0 | 79,611.0 | 105,558.0 |
| Server PCB ASP (TWD per K sqft) | 496.6 | 395.1 | 651.2 | 547.4 | 488.5 | 678.4 | 1,047.9 | 1,241.2 |
Profit and loss (TWDm)
| Year to 31 Dec | 2021 | 2022 | 2023 | 2024 | 2025 | 2026E | 2027E | 2028E |
|---|---|---|---|---|---|---|---|---|
| Networking | 5,319 | 6,704 | 5,064 | 5,909 | 8,997 | 16,784 | 18,793 | 23,619 |
| Server | 13,257 | 19,206 | 19,143 | 26,674 | 44,453 | 83,427 | 131,023 | 186,330 |
| Other Revenue | 8,032 | 6,874 | 5,837 | 6,369 | 6,553 | 6,953 | 8,098 | 8,307 |
| Total Revenue | 26,607 | 32,785 | 30,044 | 38,952 | 60,004 | 107,164 | 157,914 | 218,256 |
| Other income | 0 | 0 | 0 | 0 | 0 | 0 | 0 | 0 |
| COGS | (20,236) | (24,057) | (22,320) | (27,556) | (40,321) | (69,068) | (97,974) | (130,552) |
| SG&A | (1,625) | (1,973) | (1,785) | (2,355) | (4,383) | (5,875) | (7,806) | (9,893) |
| Other op.expenses | (623) | (718) | (803) | (974) | (1,256) | (2,648) | (3,566) | (4,014) |
| Operating profit | 4,123 | 6,037 | 5,136 | 8,067 | 14,043 | 29,573 | 48,569 | 73,797 |
| Net-interest inc./(exp.) | (51) | (27) | 78 | 78 | 55 | 45 | 43 | 42 |
| Assoc/forex/extraord./others | (23) | 383 | 3 | 345 | 75 | (181) | 120 | 120 |
| Pre-tax profit | 4,049 | 6,392 | 5,218 | 8,490 | 14,173 | 29,437 | 48,732 | 73,960 |
| Tax | (1,122) | (1,820) | (1,689) | (2,875) | (4,567) | (8,354) | (14,132) | (21,448) |
| Min. int./pref. div./others | 0 | 0 | 0 | 0 | 0 | 0 | 0 | 0 |
| Net profit (reported) | 2,927 | 4,571 | 3,529 | 5,616 | 9,607 | 21,082 | 34,600 | 52,511 |
| Net profit (adjusted) | 2,927 | 4,571 | 3,529 | 5,616 | 9,607 | 21,082 | 34,600 | 52,511 |
| EPS (reported)(TWD) | 5.356 | 9.294 | 7.174 | 11.418 | 19.018 | 41.295 | 67.772 | 102.856 |
| EPS (adjusted)(TWD) | 5.356 | 9.294 | 7.174 | 11.418 | 19.018 | 41.295 | 67.772 | 102.856 |
| EPS (adjusted fully-diluted)(TWD) | 5.356 | 9.294 | 7.174 | 11.418 | 19.018 | 41.295 | 67.772 | 102.856 |
| DPS (TWD) | 1.500 | 2.177 | 3.463 | 3.463 | 5.937 | 10.000 | 19.000 | 30.000 |
| EBIT | 4,123 | 6,037 | 5,136 | 8,067 | 14,043 | 29,573 | 48,569 | 73,797 |
| EBITDA | 4,898 | 6,911 | 6,103 | 9,156 | 15,359 | 30,615 | 50,214 | 76,099 |
Cash flow (TWDm)
| Year to 31 Dec | 2021 | 2022 | 2023 | 2024 | 2025 | 2026E | 2027E | 2028E |
|---|---|---|---|---|---|---|---|---|
| Profit before tax | 4,049 | 6,392 | 5,218 | 8,490 | 14,173 | 29,437 | 48,732 | 73,960 |
| Depreciation and amortisation | 776 | 874 | 967 | 1,089 | 1,316 | 1,042 | 1,645 | 2,302 |
| Tax paid | (1,122) | (1,820) | (1,689) | (2,875) | (4,567) | (8,354) | (14,132) | (21,448) |
| Change in working capital | (2,372) | (2,438) | (70) | (2,647) | (12,581) | (5,847) | (15,198) | (18,119) |
| Other operational CF items | 1,058 | 1,440 | 891 | 1,568 | 3,917 | 0 | 0 | 0 |
| Cash flow from operations | 2,390 | 4,447 | 5,317 | 5,625 | 2,259 | 16,277 | 21,047 | 36,694 |
| Capex | (826) | (1,360) | (1,623) | (5,131) | (6,733) | (18,861) | (20,529) | (9,385) |
| Net (acquisitions)/disposals | 0 | (13) | (12) | (17) | (262) | 0 | 0 | 0 |
| Other investing CF items | (5) | 17 | (27) | (56) | (38) | 0 | 0 | 0 |
| Cash flow from investing | (831) | (1,357) | (1,662) | (5,205) | (7,033) | (18,861) | (20,529) | (9,385) |
| Change in debt | (1,237) | 989 | 485 | 2,044 | 16,242 | 0 | 0 | 0 |
| Net share issues/(repurchases) | 0 | (541) | 0 | 0 | 0 | 54 | 0 | 0 |
| Dividends paid | (820) | (1,190) | (1,703) | (1,703) | (2,920) | (5,105) | (9,700) | (15,316) |
| Other financing CF items | (92) | (75) | (118) | (18) | (81) | 0 | 0 | 0 |
| Cash flow from financing | (2,149) | (816) | (1,337) | 323 | 13,241 | (5,051) | (9,700) | (15,316) |
| Forex effect/others | 23 | (114) | (552) | 700 | 463 | 0 | 0 | 0 |
| Change in cash | (568) | 2,160 | 1,767 | 1,444 | 8,930 | (7,635) | (9,182) | 11,994 |
| Free cash flow | 1,564 | 3,087 | 3,694 | 495 | (4,475) | (2,583) | 518 | 27,309 |
Source: FactSet, Daiwa forecasts
Gold Circuit Electronics (2368 TT): 11 August 2026
Daiwa
Financial summary continued …
Balance sheet (TWDm)
| Year to 31 Dec | 2021 | 2022 | 2023 | 2024 | 2025 | 2026E | 2027E | 2028E |
|---|---|---|---|---|---|---|---|---|
| Cash & short-term investment | 3,843 | 6,017 | 7,820 | 9,191 | 18,517 | 10,882 | 1,701 | 13,694 |
| Inventory | 4,822 | 5,616 | 5,970 | 7,900 | 9,747 | 15,138 | 21,474 | 28,614 |
| Accounts receivable | 9,214 | 10,825 | 10,844 | 13,743 | 27,310 | 33,764 | 49,754 | 68,766 |
| Other current assets | 283 | 268 | 278 | 640 | 763 | 763 | 763 | 763 |
| Total current assets | 18,162 | 22,726 | 24,913 | 31,474 | 56,337 | 60,548 | 73,692 | 111,837 |
| Fixed assets | 5,679 | 6,294 | 6,945 | 11,635 | 17,840 | 35,659 | 54,543 | 61,626 |
| Goodwill & intangibles | 27 | 43 | 58 | 46 | 78 | 78 | 78 | 78 |
| Other non-current assets | 1,112 | 977 | 1,185 | 1,430 | 1,491 | 1,491 | 1,491 | 1,491 |
| Total assets | 24,980 | 30,041 | 33,101 | 44,584 | 75,746 | 97,776 | 129,803 | 175,031 |
| Short-term debt | 1,341 | 2,188 | 217 | 1,282 | 6,010 | 6,010 | 6,010 | 6,010 |
| Accounts payable | 5,502 | 5,661 | 6,021 | 8,268 | 11,032 | 17,030 | 24,158 | 32,191 |
| Other current liabilities | 3,431 | 4,008 | 4,237 | 7,419 | 10,512 | 10,512 | 10,512 | 10,512 |
| Total current liabilities | 10,274 | 11,857 | 10,475 | 16,969 | 27,554 | 33,553 | 40,680 | 48,713 |
| Long-term debt | 2,874 | 3,340 | 4,859 | 4,531 | 11,875 | 11,875 | 11,875 | 11,875 |
| Other non-current liabilities | 430 | 520 | 936 | 1,771 | 2,836 | 2,836 | 2,836 | 2,836 |
| Total liabilities | 13,578 | 15,717 | 16,270 | 23,272 | 42,265 | 48,264 | 55,391 | 63,424 |
| Share capital | 5,465 | 4,918 | 4,918 | 4,918 | 5,051 | 5,105 | 5,105 | 5,105 |
| Reserves/R.E./others | 5,937 | 9,406 | 11,913 | 16,394 | 28,430 | 44,407 | 69,306 | 106,502 |
| Shareholders' equity | 11,402 | 14,324 | 16,831 | 21,312 | 33,481 | 49,512 | 74,412 | 111,607 |
| Minority interests | 0 | 0 | 0 | 0 | 0 | 0 | 0 | 0 |
| Total equity & liabilities | 24,980 | 30,041 | 33,101 | 44,584 | 75,746 | 97,776 | 129,803 | 175,031 |
| EV | 492,523 | 491,662 | 489,406 | 488,773 | 491,518 | 499,153 | 508,335 | 496,341 |
| Net debt/(cash) | 373 | (489) | (2,745) | (3,377) | (633) | 7,002 | 16,184 | 4,191 |
| BVPS (TWD) | 20.864 | 29.123 | 34.221 | 43.332 | 66.282 | 96.982 | 145.754 | 218.610 |
Key ratios (%)
| Year to 31 Dec | 2021 | 2022 | 2023 | 2024 | 2025 | 2026E | 2027E | 2028E |
|---|---|---|---|---|---|---|---|---|
| Sales (YoY) | 13.7 | 23.2 | (8.4) | 29.6 | 54.0 | 78.6 | 47.4 | 38.2 |
| EBITDA (YoY) | 28.8 | 41.1 | (11.7) | 50.0 | 67.8 | 99.3 | 64.0 | 51.6 |
| Operating profit (YoY) | 34.1 | 46.4 | (14.9) | 57.1 | 74.1 | 110.6 | 64.2 | 51.9 |
| Net profit (YoY) | 41.6 | 56.2 | (22.8) | 59.1 | 71.1 | 119.5 | 64.1 | 51.8 |
| Core EPS (fully-diluted) (YoY) | 41.6 | 73.5 | (22.8) | 59.1 | 66.6 | 117.1 | 64.1 | 51.8 |
| Gross-profit margin | 23.9 | 26.6 | 25.7 | 29.3 | 32.8 | 35.5 | 38.0 | 40.2 |
| EBITDA margin | 18.4 | 21.1 | 20.3 | 23.5 | 25.6 | 28.6 | 31.8 | 34.9 |
| Operating-profit margin | 15.5 | 18.4 | 17.1 | 20.7 | 23.4 | 27.6 | 30.8 | 33.8 |
| Net profit margin | 11 | 13.9 | 11.7 | 14.4 | 16.0 | 19.7 | 21.9 | 24.1 |
| ROAE | 28.3 | 35.5 | 22.7 | 29.4 | 35.1 | 50.8 | 55.8 | 56.5 |
| ROAA | 12.6 | 16.6 | 11.2 | 14.5 | 16.0 | 24.3 | 30.4 | 34.5 |
| ROCE | 27.6 | 34.0 | 24.6 | 32.9 | 35.8 | 49.8 | 60.8 | 66.5 |
| ROIC | 27.5 | 33.7 | 24.9 | 33.3 | 37.5 | 47.4 | 46.9 | 50.8 |
| Net debt to equity | 3.3 | n.a. | n.a. | n.a. | n.a. | 14.1 | 21.7 | 3.8 |
| Effective tax rate | 27.7 | 28.5 | 32.4 | 33.9 | 32.2 | 28.4 | 29.0 | 29.0 |
| Accounts receivable (days) | 110.9 | 111.6 | 131.6 | 115.2 | 124.9 | 104.0 | 96.5 | 99.1 |
| Current ratio (x) | 1.8 | 1.9 | 2.4 | 1.9 | 2.0 | 1.8 | 1.8 | 2.3 |
| Net interest cover (x) | 80.7 | 219.6 | n.a. | n.a. | n.a. | n.a. | n.a. | n.a. |
| Net dividend payout | 39.7 | 23.4 | 48.3 | 30.3 | 31.2 | 24.2 | 28.0 | 29.2 |
| Free cash flow yield | 0.3 | 0.6 | 0.8 | 0.1 | n.a. | n.a. | 0.1 | 5.5 |
Source: FactSet, Daiwa forecasts
Company profile
Founded in 1981 and listed on the Taiwan Stock Exchange in 1998, Gold Circuit Electronics (GCE) was, in its early years, one of the world's top-3 printed circuit board (PCB) vendors providing double-sided and multi-layer PCBs for notebooks. However, as the notebook market became saturated from 2011, GCE started reshuffling its revenue mix to more high-end products (servers, workstations and networking boards). The requirement of higher-layer PCBs from these products has not only proved GCE's manufacturing capabilities but also created a high entry barrier. GCE's revenue contribution from the server and networking segments has surged to over 80% in 2024 (from 37% in 2010), the highest among its PCB peers.
Gold Circuit Electronics (2368 TT): 11 August 2026
Daiwa
ESG analysis
ESG risks
| Risks | Management | Analyst comments | |
|---|---|---|---|
| G | Executive/board quality | 2 | GCE's Board consists of 9 directors, including 3 independent directors. The number of independent directors is above Taiwan securities law's requirement of more than two and exceeds one-fifth of the total number of directors on the board. The backgrounds of the independent directors are diverse with expertise in the areas of business management, finance & audit, and law, which should be positive for executive and board quality. That said, the roles of CEO and chairman are held by one person, who is a second-generation family member of GCE's founder. The organisation structure appears to us to be a family business, which could lead to conflicts of interest between key executives and outside shareholders. |
| Capital management | 2 | GCE declared a DPS of TWD6.0 in 2024. GCE has only declared a cash or stock dividend 6 times in the past 14 years mainly due to fierce competition in the PCB industry (especially in notebook applications) and high earnings volatility from its 3 plants in China caused by low utilisation rates. We expect the company's strategy to focus on high-end products (eg, servers and networking) to start bearing fruit shortly, which was also the main reason GCE was able to declare a record-high cash dividend in 2024. Overall, we expect GCE to continue to benefit from ASP and gross-margin expansion, driven by server and networking spec upgrades, which should be value-accretive for investors in the long term. | |
| Related party transaction | & | 1 | Sales to related parties were 0% of total 2025 sales and purchases from related parties were also 0% of total 2025 purchases. We see limited risk from related-party transactions. |
| S | Supply chain management | 1 | GCE is a multi-layer PCB manufacturer with major raw materials, such as thin core, copper foil, pre-preg, copper ball, dry film, solder mask and various chemical materials used in the manufacturing process. GCE has acquired the ISO 9001 and IECQ QC 08000 certifications to improve its supply chain management capabilities in product quality and hazardous material usage. Like most hardware vendors, GCE is also committed to refusing procurement of conflict metals and to comply with the Responsible Business Alliance (RBA) Code of Conduct. According to its 2024 CSR report, top 30 suppliers have signed the RBA's code of conduct. As required by the RBA, GCE holds an annual supply chain meeting to review the achievement rate of its previous target and set new goals for suppliers and also audit its top-10 suppliers. In 2021, the company set up a risk evaluation system to assess the risk level of its suppliers. |
| S | Data security | 2 | Information security is one of the key topics under the company's risk management guidelines. GCE constructed an information security system, under the 'information security committee', to minimise the risk of information loss, sabotage, and leakage caused by human errors, malicious destructions or natural disasters. Below are several measures the company has taken to improve data security: GCE will conduct regular awareness training to ensure employees' security awareness and fulfilment of information security system requirements. Also, the information security committee will develop an information security continuity plan and conduct drills to ensure continuous operation of the company. |
Note: Management score represents a company's ability to manage/benefit from certain ESG topics. The scores range from 1 to 3, with 1 being the strongest.
Update Date: 13 Apr 2026 Source: Daiwa, Company
Gold Circuit Electronics (2368 TT): 11 August 2026
Daiwa