PDF 原檔:報告_Daiwa_聯茂6213_20260808_original.pdf
圖片清單(已驗證 2026-08-10)
本份報告抽出圖片(
_001.png「Share price performance」26KB、_002.png「1-year forward PER bands」35KB、_003.png「revenue breakdown by product」29KB)皆 <40KB,未達 Read 門檻,依規則預設為 logo/裝飾圖,不列入真資料圖候選、不嵌入 lib。
原始內容
Taiwan
ITEQ Corp (6213 TT)
Target price:
TWD600.00 (from TWD333.00)
Share price (7 Aug): TWD389.00 | Up/downside: +54.2%
Upgrading: strong beat in 2Q26 with improving outlook
- Gross margin expanded significantly on favourable pricing trend
- Massive capacity expansion indicates a resolution to tap into AI servers
- Upgrading to Buy (1) rating; raising our 12-month TP to TWD600
What's new: ITEQ released 2Q26 results after market hours on 7 August.
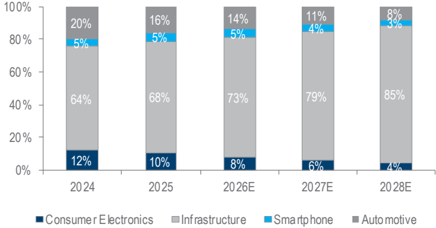
What's the impact: 2Q26 results beat on stronger-than-expected gross margin. 2Q26 revenue grew 26% QoQ to TWD11.5bn mainly due to a solid price hike of 30% with a stable utilisation rate of 70-75%. 2Q26 net income of TWD1,279m (EPS: TWD3.52) was 71-118% higher than our estimate (TWD587m) and the consensus (TWD750m) due to a strongerthan-expected gross margin. Gross margin expanded to 10.6pp to 22% in 2Q26, while operating margin increased 11.4pp to 16% due to decent opex control. Net income was also boosted by a slightly lower tax rate of 30.2% (vs. 35% in 1Q26). In 2Q26, ITEQ had 60% of total sales from regular servers, with 10% from AI servers and 400G switches, per our estimates.
Business outlook. We believe the CCL industry is experiencing a favourable ASP trend from 2Q26 given that AI servers have continuously crowded out most of the tier-1 CCL capacities, as capacities are shifted from non-AI to AI to meet end demand. This has caused mid-to-low end orders to spill over to the next tranche that is currently benefiting E-glass vendors including ITEQ. We believe the E-glass price rose more than 80% in 1H26, which caused vendors to raise their ASP by 30% to pass on the cost to end customers. Looking ahead, we expect ITEQ to deliver revenue growth of c.20% QoQ in 3Q26 and 10% QoQ in 4Q26 as we expect it to keep passing on additional costs from E-glass price hikes (5-10% per month as of now). We believe these price hikes will continue into 1H27; in our view, the price hike impact from 2026 plus a likely 20% hike in 2027 would cause 2027 revenue to grow 43% without a meaningful capacity increase. ITEQ today announced a new capacity expansion plan in Wuxi, which will likely increase its capacity by 2.85m. With the additional new capacity from Thailand (600k in 2028), its capacity will increase from 5.45m sheets in 2026E to 6.05m/8m/8.9m in 2027-2029E. Its capacity ramp-up is targeting high-end CCL demand from hyperscalers from 2028 onward.
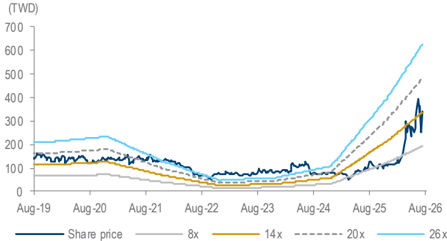
What we recommend: We lift our 2026-28E EPS by 111-206% on price hikes. We lift our 12M TP to TWD600 (from TWD333), based on a target PER of 22x (higher than the range of its past-1-year range of 8-18x), applied to our 1-year-forward EPS forecast. We lower our PER target from 30x as we believe upside from price hikes has been partially priced in. Nonetheless, we upgrade the stock to Buy (1) from Outperform (2), as we believe ITEQ will gradually benefit from high-end CCL demand given the current supplydemand situation. Key risk: weaker-than-expected regular server demand.
How we differ: Our 2026-27E EPS are 66-180% above consensus, mainly due to our more aggressive view on ITEQ's revenue and margin profile.
5
Daiwa
3
2
1
Buy
Sheng Cheng
(886) 2 8758 6253
sheng.cheng@daiwacm-cathay.com.tw
Allan Wang
(886) 2 8758 6249 allan.wang@daiwacm-cathay.com.tw
Forecast revisions (%)
| Year to 31 Dec | 26E | 27E | 28E |
|---|---|---|---|
| Revenue change | 11.9 | 23.1 | 45.8 |
| Net profit change | 110.6 | 148.8 | 206.4 |
| Core EPS (FD) change | 110.6 | 148.8 | 206.4 |
Source: Daiwa forecasts
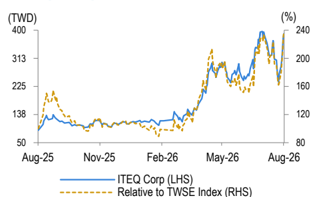
Share price performance
| 12-month range | 90.00-396.00 |
|---|---|
| Market cap (USDbn) | 4.38 |
| 3m avg daily turnover (USDm) | 189.71 |
| Shares outstanding (m) | 363 |
| Major shareholder Yu | Chang Investment Co Ltd (7.4%) |
Financial summary (TWD)
| Year to 31 Dec | 26E | 27E | 28E |
|---|---|---|---|
| Revenue (m) | 49,782 | 71,038 | 96,034 |
| Operating profit (m) | 7,952 | 15,312 | 22,746 |
| Net profit (m) | 5,532 | 10,608 | 15,730 |
| Core EPS (fully-diluted) | 15.240 | 29.225 | 43.336 |
| EPS change (%) | 266.3 | 91.8 | 48.3 |
| Daiwa vs Cons. EPS (%) | 66.4 | 88.6 | 179.7 |
| PER (x) | 25.5 | 13.3 | 9.0 |
| Dividend yield (%) | 3.1 | 6.0 | 8.9 |
| DPS | 12.2 | 23.4 | 34.7 |
| PBR (x) | 5.5 | 4.4 | 3.6 |
| EV/EBITDA (x) | 15.2 | 8.4 | 5.9 |
| ROE (%) | 23.7 | 36.9 | 43.8 |
Source: FactSet, Daiwa forecasts
ITEQ: Daiwa revenue and earnings forecasts revisions vs. the consensus
| 2026E | 2026E | 2026E | 2027E | 2027E | 2027E | 2028E | 2028E | 2028E | |
|---|---|---|---|---|---|---|---|---|---|
| (TWDm) | Previous | New | Consensus | Previous | New | Consensus | Previous | New | Consensus |
| Revenue | 44,501 | 49,782 | 46,807 | 57,717 | 71,038 | 60,787 | 65,873 | 96,034 | 66,712 |
| Diff (%) | 11.9% | 6.4% | 23.1% | 16.9% | 45.8% | 44.0% | |||
| Gross Margin (%) | 15.6% | 22.2% | 17.4% | 18.0% | 27.3% | 20.2% | 18.6% | 29.3% | 18.6% |
| Operating profit | 3,924 | 7,952 | 5,051 | 6,467 | 15,312 | 8,484 | 7,809 | 22,746 | 8,394 |
| Op Margin (%) | 8.8% | 16.0% | 10.8% | 11.2% | 21.6% | 14.0% | 11.9% | 23.7% | 12.6% |
| Net profit | 2,626 | 5,532 | 3,324 | 4,264 | 10,608 | 5,625 | 5,133 | 15,730 | 5,624 |
| EPS (TWD) | 7.24 | 15.24 | 9.16 | 11.75 | 29.22 | 15.50 | 14.14 | 43.34 | 15.49 |
| Diff (%) | 110.6% | 66.4% | 148.8% | 88.6% | 206.4% | 179.7% |
Source: Bloomberg, Daiwa forecasts
ITEQ: quarterly and annual P&L statement
| 2026E | 2026E | 2026E | 2026E | 2027E | 2027E | 2027E | 2027E | 2025 | 2026E | 2027E | 2028E | |
|---|---|---|---|---|---|---|---|---|---|---|---|---|
| (TWDm) | 1Q | 2Q | 3QE | 4QE | 1QE | 2QE | 3QE | 4QE | ||||
| Net revenue | 9,143 | 11,530 | 13,727 | 15,382 | 15,608 | 16,977 | 18,927 | 19,526 | 33,098 | 49,782 | 71,038 | 96,034 |
| COGS | -8,099 | -8,991 | -10,338 | -11,290 | -11,385 | -12,343 | -13,744 | -14,142 | -28,314 | -38,717 | -51,614 | -67,910 |
| Gross profit | 1,044 | 2,539 | 3,389 | 4,092 | 4,223 | 4,634 | 5,183 | 5,384 | 4,785 | 11,065 | 19,424 | 28,124 |
| Operating expenses | 620 | 691 | 879 | 923 | 937 | 985 | 1,098 | 1,093 | 2,402 | 3,112 | 4,112 | 5,378 |
| Operating profit | 424 | 1,848 | 2,511 | 3,169 | 3,287 | 3,649 | 4,085 | 4,290 | 2,383 | 7,952 | 15,312 | 22,746 |
| Non-operating profit | 59 | -14 | 13 | 15 | 14 | 15 | 16 | 17 | -16 | 72 | 62 | 51 |
| Pre-tax profit | 483 | 1,834 | 2,524 | 3,184 | 3,301 | 3,664 | 4,102 | 4,307 | 2,367 | 8,025 | 15,374 | 22,798 |
| Net profit | 315 | 1,279 | 1,741 | 2,197 | 2,278 | 2,528 | 2,830 | 2,972 | 1,510 | 5,532 | 10,608 | 15,730 |
| Net EPS (TWD) | 0.87 | 3.52 | 4.80 | 6.05 | 6.27 | 6.97 | 7.80 | 8.19 | 4.2 | 15.2 | 29.2 | 43.3 |
| Operating Ratios | ||||||||||||
| Gross margin | 11.4% | 22.0% | 24.7% | 26.6% | 27.1% | 27.3% | 27.4% | 27.6% | 14.5% | 22.2% | 27.3% | 29.3% |
| Operating margin | 4.6% | 16.0% | 18.3% | 20.6% | 21.1% | 21.5% | 21.6% | 22.0% | 7.2% | 16.0% | 21.6% | 23.7% |
| Pre-tax margin | 5.3% | 15.9% | 18.4% | 20.7% | 21.1% | 21.6% | 21.7% | 22.1% | 7.2% | 16.1% | 21.6% | 23.7% |
| Net margin | 3.4% | 11.1% | 12.7% | 14.3% | 14.6% | 14.9% | 15.0% | 15.2% | 4.6% | 11.1% | 14.9% | 16.4% |
| YoY (%) | ||||||||||||
| Net revenue | 21% | 30% | 78% | 73% | 71% | 47% | 38% | 27% | 13% | 50% | 43% | 35% |
| Gross profit | -3% | 84% | 220% | 225% | 304% | 83% | 53% | 32% | 30% | 131% | 76% | 45% |
| Operating profit | -19% | 135% | 463% | 405% | 675% | 97% | 63% | 35% | 76% | 234% | 93% | 49% |
| Pre-tax profit | -10% | 174% | 384% | 397% | 583% | 100% | 63% | 35% | 80% | 239% | 92% | 48% |
| Net profit | -7% | 204% | 436% | 413% | 624% | 98% | 63% | 35% | 84% | 266% | 92% | 48% |
| QoQ (%) | ||||||||||||
| Net revenue | 3% | 26% | 19% | 12% | 1% | 9% | 11% | 3% | ||||
| Gross profit | -17% | 143% | 33% | 21% | 3% | 10% | 12% | 4% | ||||
| Operating profit | -32% | 336% | 36% | 26% | 4% | 11% | 12% | 5% | ||||
| Pre-tax profit | -25% | 279% | 38% | 26% | 4% | 11% | 12% | 5% | ||||
| Net profit | -27% | 307% | 36% | 26% | 4% | 11% | 12% | 5% |
Source: Company, Daiwa forecasts
ITEQ: 2Q26 comparison table
| (TWDm) | Actual | QoQ% | YoY% | Daiwa | Diff% | Consensus | Diff% |
|---|---|---|---|---|---|---|---|
| Revenue | 11,530 | 26% | 30% | 10,285 | 12% | 11,166 | 3% |
| Gross profit | 2,539 | 143% | 84% | 1,582 | 61% | 1,877 | 35% |
| Gross margin (%) | 22.0% | 15.4% | 16.8% | ||||
| Operating profit | 1,848 | 336% | 135% | 884 | 109% | 1,213 | 52% |
| Operating margin (%) | 16.0% | 8.6% | 10.9% | ||||
| Pre-tax profit | 1,834 | 279% | 174% | 901 | 103% | 1,268 | 45% |
| Net profit | 1,279 | 307% | 204% | 587 | 118% | 750 | 71% |
| EPS (TWD) | 3.52 | 307% | 204% | 1.62 | 118% | 2.07 | 71% |
Source: Company data, Daiwa forecasts, Bloomberg
ITEQ: 1-year forward PER bands
Source: TEJ, Daiwa forecasts
ITEQ Corp (6213 TT): 7 August 2026
ITEQ: revenue breakdown by product
Source: Company, Daiwa forecasts
Daiwa
Financial summary
Key assumptions
| Year to 31 Dec | 2021 | 2022 | 2023 | 2024 | 2025 | 2026E | 2027E | 2028E |
|---|---|---|---|---|---|---|---|---|
| Global PC shipment (mn) | 361 | 301 | 260 | 263 | 287 | 244 | 244 | 244 |
| Regular server shipment (mn) | 14 | 15 | 12 | 14 | 16 | 18 | 22 | 26 |
| Global smartphone shipment (mn) | 1,655 | 1,437 | 1,380 | 1,437 | 1,429 | 1,249 | 1,255 | 1,300 |
Profit and loss (TWDm)
| Year to 31 Dec | 2021 | 2022 | 2023 | 2024 | 2025 | 2026E | 2027E | 2028E |
|---|---|---|---|---|---|---|---|---|
| Infrastructure | 17,295 | 16,881 | 15,003 | 18,682 | 22,598 | 36,357 | 56,163 | 81,424 |
| Consumer | 8,658 | 5,644 | 3,878 | 3,511 | 3,454 | 3,945 | 4,095 | 3,665 |
| Other Revenue | 6,571 | 6,604 | 6,198 | 7,184 | 7,046 | 9,480 | 10,780 | 10,946 |
| Total Revenue | 32,525 | 29,130 | 25,079 | 29,378 | 33,098 | 49,782 | 71,038 | 96,034 |
| Other income | 0 | 0 | 0 | 0 | 0 | 0 | 0 | 0 |
| COGS | (26,545) | (25,190) | (21,973) | (25,688) | (28,314) | (38,717) | (51,614) | (67,910) |
| SG&A | (1,654) | (1,511) | (1,580) | (1,644) | (1,605) | (424) | 0 | 0 |
| Other op.expenses | (506) | (533) | (531) | (696) | (797) | (2,688) | (4,112) | (5,378) |
| Operating profit | 3,819 | 1,896 | 995 | 1,351 | 2,383 | 7,952 | 15,312 | 22,746 |
| Net-interest inc./(exp.) | (81) | (107) | (143) | (174) | (145) | (141) | (138) | (141) |
| Assoc/forex/extraord./others | 76 | 526 | 301 | 140 | 129 | 213 | 201 | 192 |
| Pre-tax profit | 3,815 | 2,315 | 1,152 | 1,317 | 2,367 | 8,025 | 15,374 | 22,798 |
| Tax | (670) | (460) | (476) | (496) | (856) | (2,493) | (4,766) | (7,067) |
| Min. int./pref. div./others | 0 | 0 | 0 | 0 | 0 | 0 | 0 | 0 |
| Net profit (reported) | 3,145 | 1,855 | 677 | 822 | 1,510 | 5,532 | 10,608 | 15,730 |
| Net profit (adjusted) | 3,145 | 1,855 | 677 | 822 | 1,510 | 5,532 | 10,608 | 15,730 |
| EPS (reported)(TWD) | 8.997 | 4.940 | 1.864 | 2.264 | 4.161 | 15.240 | 29.225 | 43.336 |
| EPS (adjusted)(TWD) | 8.997 | 4.940 | 1.864 | 2.264 | 4.161 | 15.240 | 29.225 | 43.336 |
| EPS (adjusted fully-diluted)(TWD) | 9.221 | 4.899 | 1.864 | 2.264 | 4.161 | 15.240 | 29.225 | 43.336 |
| DPS (TWD) | 5.000 | 3.000 | 1.500 | 1.800 | 3.328 | 12.195 | 23.380 | 34.669 |
| EBIT | 3,819 | 1,896 | 995 | 1,351 | 2,383 | 7,952 | 15,312 | 22,746 |
| EBITDA | 4,767 | 2,966 | 2,158 | 2,824 | 3,969 | 9,605 | 17,047 | 24,568 |
Cash flow (TWDm)
| Year to 31 Dec | 2021 | 2022 | 2023 | 2024 | 2025 | 2026E | 2027E | 2028E |
|---|---|---|---|---|---|---|---|---|
| Profit before tax | 3,815 | 2,315 | 1,152 | 1,317 | 2,367 | 8,025 | 15,374 | 22,798 |
| Depreciation and amortisation | 948 | 1,069 | 1,163 | 1,474 | 1,586 | 1,652 | 1,735 | 1,822 |
| Tax paid | (670) | (460) | (476) | (496) | (856) | (2,493) | (4,766) | (7,067) |
| Change in working capital | 7,455 | (7,092) | (114) | 1,041 | 6,773 | 14,739 | 12,952 | 22,986 |
| Other operational CF items | (8,395) | 10,597 | 371 | (2,411) | (7,599) | (24,724) | (17,982) | (33,816) |
| Cash flow from operations | 3,153 | 6,429 | 2,097 | 925 | 2,269 | (2,800) | 7,313 | 6,722 |
| Capex | (4,948) | (1,325) | (567) | (677) | (325) | (255) | (204) | (163) |
| Net (acquisitions)/disposals | (8) | 51 | (2) | (11) | 17 | (7) | 5 | (1) |
| Other investing CF items | (7) | (1,947) | (679) | (1,008) | (1,174) | (1,108) | 0 | 0 |
| Cash flow from investing | (4,964) | (3,221) | (1,248) | (1,696) | (1,482) | (1,370) | (199) | (164) |
| Change in debt | (2,733) | 901 | 1,110 | 217 | 148 | (162) | 16 | (67) |
| Net share issues/(repurchases) | 0 | 0 | 0 | 0 | 0 | 0 | 0 | 0 |
| Dividends paid | (1,665) | (1,915) | (1,089) | (544) | (653) | (1,208) | (4,427) | (8,487) |
| Other financing CF items | 7,330 | (381) | (192) | (61) | (30) | 171 | 0 | 0 |
| Cash flow from financing | 2,933 | (1,395) | (171) | (389) | (535) | (1,199) | (4,411) | (8,554) |
| Forex effect/others | 14 | (1,022) | (297) | 149 | 154 | 490 | 430 | 399 |
| Change in cash | 1,136 | 791 | 380 | (1,011) | 406 | (4,879) | 3,133 | (1,597) |
| Free cash flow | (1,795) | 5,104 | 1,529 | 248 | 1,944 | (3,055) | 7,109 | 6,559 |
Source: FactSet, Daiwa forecasts
ITEQ Corp (6213 TT): 7 August 2026
Daiwa
Financial summary continued …
Balance sheet (TWDm)
| Year to 31 Dec | 2021 | 2022 | 2023 | 2024 | 2025 | 2026E | 2027E | 2028E |
|---|---|---|---|---|---|---|---|---|
| Cash & short-term investment | 4,428 | 5,217 | 5,685 | 4,648 | 4,994 | 1,058 | 4,191 | 2,594 |
| Inventory | 5,167 | 2,731 | 3,014 | 3,763 | 4,890 | 6,804 | 8,778 | 11,939 |
| Accounts receivable | 13,260 | 12,119 | 11,498 | 12,790 | 15,009 | 25,780 | 32,797 | 46,544 |
| Other current assets | 1,520 | 1,401 | 1,110 | 1,058 | 1,078 | 1,069 | 1,069 | 1,069 |
| Total current assets | 24,375 | 21,469 | 21,306 | 22,259 | 25,972 | 34,712 | 46,836 | 62,147 |
| Fixed assets | 11,832 | 11,834 | 11,995 | 12,519 | 12,157 | 11,134 | 9,603 | 7,945 |
| Goodwill & intangibles | 0 | 0 | 0 | 0 | 0 | 0 | 0 | 0 |
| Other non-current assets | 30 | 80 | 78 | 67 | 84 | 93 | 88 | 89 |
| Total assets | 36,237 | 33,384 | 33,380 | 34,844 | 38,213 | 45,939 | 56,527 | 70,181 |
| Short-term debt | 2,131 | 2,483 | 2,921 | 3,983 | 3,643 | 3,880 | 4,236 | 4,524 |
| Accounts payable | 11,380 | 7,562 | 7,170 | 7,158 | 9,619 | 13,176 | 17,137 | 23,215 |
| Other current liabilities | 753 | 838 | 449 | 244 | 298 | 329 | 329 | 329 |
| Total current liabilities | 14,265 | 10,883 | 10,540 | 11,385 | 13,561 | 17,384 | 21,701 | 28,067 |
| Long-term debt | 0 | 1,677 | 2,346 | 1,592 | 2,102 | 1,677 | 1,337 | 981 |
| Other non-current liabilities | 658 | 713 | 1,054 | 1,221 | 1,284 | 1,423 | 1,423 | 1,423 |
| Total liabilities | 14,923 | 13,273 | 13,940 | 14,198 | 16,946 | 20,484 | 24,461 | 30,472 |
| Share capital | 3,830 | 3,630 | 3,630 | 3,630 | 3,632 | 3,634 | 3,634 | 3,634 |
| Reserves/R.E./others | 17,485 | 16,481 | 15,810 | 17,016 | 17,635 | 21,820 | 28,432 | 36,074 |
| Shareholders' equity | 21,315 | 20,111 | 19,440 | 20,646 | 21,267 | 25,455 | 32,066 | 39,709 |
| Minority interests | 0 | 0 | 0 | 0 | 0 | 0 | 0 | 0 |
| Total equity & liabilities | 36,237 | 33,384 | 33,380 | 34,844 | 38,213 | 45,939 | 56,527 | 70,181 |
| EV | 138,905 | 140,144 | 140,785 | 142,130 | 141,953 | 145,701 | 142,584 | 144,113 |
| Net debt/(cash) | (2,297) | (1,058) | (417) | 928 | 751 | 4,499 | 1,382 | 2,911 |
| BVPS (TWD) | 60.981 | 53.556 | 53.560 | 56.883 | 58.589 | 70.125 | 88.339 | 109.394 |
Key ratios (%)
| Year to 31 Dec | 2021 | 2022 | 2023 | 2024 | 2025 | 2026E | 2027E | 2028E |
|---|---|---|---|---|---|---|---|---|
| Sales (YoY) | 27.9 | (10.4) | (13.9) | 17.1 | 12.7 | 50.4 | 42.7 | 35.2 |
| EBITDA (YoY) | 19.3 | (37.8) | (27.2) | 30.9 | 40.5 | 142.0 | 77.5 | 44.1 |
| Operating profit (YoY) | 18.7 | (50.3) | (47.5) | 35.8 | 76.4 | 233.7 | 92.5 | 48.6 |
| Net profit (YoY) | 18.0 | (41.0) | (63.5) | 21.5 | 83.8 | 266.3 | 91.8 | 48.3 |
| Core EPS (fully-diluted) (YoY) | 12.0 | (46.9) | (61.9) | 21.5 | 83.8 | 266.3 | 91.8 | 48.3 |
| Gross-profit margin | 18.4 | 13.5 | 12.4 | 12.6 | 14.5 | 22.2 | 27.3 | 29.3 |
| EBITDA margin | 14.7 | 10.2 | 8.6 | 9.6 | 12 | 19.3 | 24 | 25.6 |
| Operating-profit margin | 11.7 | 6.5 | 4.0 | 4.6 | 7.2 | 16.0 | 21.6 | 23.7 |
| Net profit margin | 9.7 | 6.4 | 2.7 | 2.8 | 4.6 | 11.1 | 14.9 | 16.4 |
| ROAE | 18.1 | 9.0 | 3.4 | 4.1 | 7.2 | 23.7 | 36.9 | 43.8 |
| ROAA | 10.2 | 5.3 | 2.0 | 2.4 | 4.1 | 13.1 | 20.7 | 24.8 |
| ROCE | 18.7 | 7.9 | 4.1 | 5.3 | 9 | 27.4 | 44.6 | 54.9 |
| ROIC | 19.0 | 8.0 | 3.1 | 4.2 | 7 | 21.1 | 33.3 | 41.3 |
| Net debt to equity | net cash | net cash | net cash | 4.8 | 3.6 | 21.4 | 7.3 | 9.7 |
| Effective tax rate | 17.6 | 19.9 | 41.3 | 37.6 | 36.2 | 31.1 | 31 | 31 |
| Accounts receivable (days) | 135.1 | 159.0 | 171.9 | 150.9 | 153.3 | 149.5 | 150.5 | 150.8 |
| Current ratio (x) | 1.7 | 2.0 | 2.0 | 2 | 1.9 | 2.0 | 2.2 | 2.2 |
| Net interest cover (x) | 0.5 | 0.2 | 0.1 | 0.1 | 0.2 | 0.6 | 1.1 | 1.6 |
| Net dividend payout | 55.6 | 61.0 | 80.6 | 79.6 | 80 | 80.0 | 80 | 80 |
| Free cash flow yield | n.a. | 3.6 | 1.1 | 0.2 | 1.4 | n.a. | 5 | 4.6 |
Source: FactSet, Daiwa forecasts
Company profile
ITEQ Corporation is a leading manufacturer of high performance copper clad laminate materials used for the fabrication of printed circuit boards and was founded in April of 1997. ITEQ's products find use many different application areas, such as computational and communications applications, Radio Frequency and Microwave devices, Automotive applications, and High Density Interconnect solutions.
ITEQ Corp (6213 TT): 7 August 2026
Daiwa
ESG analysis
ESG risks
| Risks | Risks | Management | Analyst comments |
|---|---|---|---|
| Executive/board quality | 2 | All board members implement the company's operation faithfully and fulfil their obligations with discipline and care. Independent directors obey related laws and company regulations to protect the rights of the company and stockholders. | |
| G | Capital management | 2 | ITEQ pays its dividend on an annual basis. We believe ITEQ will at least sustain its cash dividend payout in dollar terms over 2025-27E. We see its balance between investment and dividend as appropriate. |
| Related party & transaction | 2 | ITEQ's sales to related parties were insignificant versus its total revenue. | |
| S | Supply chain management | 2 | ITEQ requires all major raw material suppliers to comply with ESG, ethics, and regulatory standards. Annual RBA audits were conducted for vendors, all rated A-C. |
| S | Data security | 1 | ITEQ has established an ISO/IEC 27001-certified Information Security Management System, conducts quarterly training, and implements system recovery drills to ensure risk preparedness. |
Note: Management score represents a company's ability to manage/benefit from certain ESG topics. The scores range from 1 to 3, with 1 being the strongest.
Update Date: 7 Aug 2026
Source: Daiwa, Company
ITEQ Corp (6213 TT): 7 August 2026
Daiwa