PDF 原檔:報告_Daiwa_穩懋3105_20260724_original.pdf
圖片清單(已驗證 2026-07-27)
本份 3 張圖依報告章節標題判定:001 為 Share price performance 走勢圖、002 為 PBR trend、003 為 4-quarter forward PER band,皆屬估值/走勢圖,未逐張 Read、未嵌入 lib。
(本份無「真資料圖」需嵌入 lib)
原始內容
Taiwan
Win Semiconductors (3105 TT)
Target price:
TWD449.00 (from TWD505.00)
Share price (24 Jul):
TWD341.50 | Up/downside: +31.5%
Upgrading: profit optimisation round the corner
- 2Q26 results and 3Q26 guidance all upbeat
- On track to optimise profitability thanks to AI and aerospace
- Upgrading to Buy (1) despite lower 12M TP of TWD449
What's new: Win Semiconductors (WinSemi) reported another set of upbeat quarterly results and guidance, thanks to seasonal ramp of highend smartphones, continued strength from infrastructure aerospace deployments, and strong ramp of new optical communication (OC) business for AI datacentre (DC) builds. We raise our forecasts and upgrade our rating 2 notches to Buy (1), and suggest taking advantage of the share price pullback to accumulate on the attractive risk/reward profile.
What's the impact: Results and guidance all upbeat. WinSemi reported 2Q26 EPS of TWD2.3, beating our/consensus estimates by 104%/50%, thanks to strength at both operating and non-operating levels. Operating profit came in 16% above our estimate due to better opex control more than offsetting lower gross margin (GM) on initial ramp of OC products. Non-op gains of TWD446m were contributed by FX and investment income under the equity method. 3Q26 guidance was above market expectations thanks to: 1) seasonal ramp of new smartphone models across iOS and Android platforms, especially in the high-end segment where WinSemi differentiates, 2) continued resilience of infrastructure demand for aerospace applications, and 3) ramps of new OC products for AI DC.
Diversifying into AI/aerospace. Infrastructure and AI OC were focal discussions at today's conference. For infrastructure, management sees low earth-orbit (LEO) satellite communications rising to become another key contributor besides base stations and stays positive on the LEO ramp. For AI OC, pin-diodes (PD) have entered mass production (MP) since late 2Q26, on track for a strong ramp into 2027, driven by strong demand from a single customer with forecast orders committed beyond 2027. This should be followed by MP of EML and VCSEL, and CW lasers in 2H27 for total AI OC to reach a high single-digit (HSD) % revenue contribution in 2026 and double-digit % in 2027, from HSD in 2Q26 and LSD in 2025. All of these echo our positive stance on WinSemi, based on 3 growth pillars: 1) RF transformation pays off with premiumisation strategy across cellular and WiFi; 2) infrastructure scales up on robust LEO builds; and 3) OC ramps with diversified offerings from peripherals chips (optical drivers, modulators) to PD and laser diodes to capture the fast-growing AI optical connectivity.
What we recommend: Though we lower our 12M TP to TWD449 (previous: TWD505) due to our lower 4-quarter forward PER target of 50x (previous: 67x), justified by our 2025-28E EPS CAGR of 53%, we upgrade our rating 2 notches to Buy (1) on valuation grounds. Key downside risk is commodity price hikes further dampening consumer purchases.
How we differ: Our 2026E EPS is 16% above the consensus forecast mainly attributable to the higher non-operating gains in 2Q26.
Daiwa
5
3
2
1
Buy
Rick Hsu
Rick Hsu (886) 2 8758 6261
rick.hsu@daiwacm-cathay.com.tw
Sharon Kao (886) 2 8758 6255 sharon.kao@daiwacm-cathay.com.tw
Forecast revisions (%)
| Year to 31 Dec | 26E | 27E | 28E |
|---|---|---|---|
| Revenue change | 0.3 | 0.6 | 0.4 |
| Net profit change | 25.8 | 0.4 | 1.2 |
| Core EPS (FD) change | 25.8 | 0.4 | 1.2 |
Source: Daiwa forecasts
Share price performance
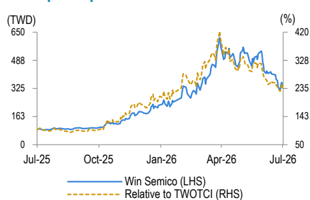
| 12-month range | 84.80-617.00 |
|---|---|
| Market cap (USDbn) | 4.48 |
| 3m avg daily turnover (USDm) | 397.20 |
| Shares outstanding (m) | 424 |
| Major shareholder Cathay | Insurance Co Ltd (5.6%) |
Financial summary (TWD)
| Year to 31 Dec | 26E | 27E | 28E |
|---|---|---|---|
| Revenue (m) | 21,848 | 27,193 | 31,358 |
| Operating profit (m) | 3,170 | 5,405 | 7,498 |
| Net profit (m) | 3,081 | 4,276 | 6,027 |
| Core EPS (fully-diluted) | 7.267 | 10.086 | 14.216 |
| EPS change (%) | 81.9 | 38.8 | 41.0 |
| Daiwa vs Cons. EPS (%) | 16.4 | 0.9 | 0.9 |
| PER (x) | 47.0 | 33.9 | 24.0 |
| Dividend yield (%) | 0.6 | 1.0 | 1.5 |
| DPS | 2.0 | 3.5 | 5.0 |
| PBR (x) | 3.6 | 3.3 | 3.1 |
| EV/EBITDA (x) | 23.1 | 16.6 | 13.4 |
| ROE (%) | 7.5 | 10.2 | 13.3 |
Source: FactSet, Daiwa forecasts
WinSemi: quarterly P&L estimates and forecasts
Daiwa
| TWDm | 1Q26 | 2Q26 | 3Q26E | 4Q26E | 1Q27E | 2Q27E | 3Q27E | 4Q27E | 2025 | 2026E | 2027E | 2028E |
|---|---|---|---|---|---|---|---|---|---|---|---|---|
| Total revenue | 4,590 | 5,257 | 5,904 | 6,097 | 5,952 | 6,726 | 7,235 | 7,280 | 16,638 | 21,848 | 27,193 | 31,358 |
| COGS | -3,381 | -3,772 | -4,042 | -4,102 | -4,059 | -4,432 | -4,625 | -4,503 | -12,612 | -15,297 | -17,618 | -19,050 |
| Gross profit | 1,209 | 1,485 | 1,862 | 1,995 | 1,893 | 2,294 | 2,611 | 2,777 | 4,025 | 6,551 | 9,575 | 12,307 |
| Opex | -778 | -743 | -915 | -945 | -929 | -1,036 | -1,093 | -1,114 | -3,311 | -3,381 | -4,171 | -4,809 |
| Operating profit | 431 | 742 | 947 | 1,050 | 965 | 1,258 | 1,518 | 1,663 | 715 | 3,170 | 5,405 | 7,498 |
| EBITDA | 1,223 | 1,523 | 1,762 | 1,911 | 1,788 | 2,113 | 2,364 | 2,423 | 4,709 | 6,418 | 8,688 | 10,381 |
| Non-op gains/losses | 101 | 446 | -30 | -4 | -5 | -15 | -20 | -20 | 672 | 513 | -60 | 35 |
| Pretax profit | 532 | 1,188 | 917 | 1,046 | 960 | 1,243 | 1,498 | 1,643 | 1,387 | 3,683 | 5,345 | 7,533 |
| Income taxes | -83 | -284 | -183 | -209 | -192 | -249 | -300 | -329 | -297 | -760 | -1,069 | -1,507 |
| Net profit | 533 | 977 | 734 | 837 | 768 | 995 | 1,199 | 1,315 | 1,694 | 3,081 | 4,276 | 6,027 |
| FD O/S (m) | 424 | 424 | 424 | 424 | 424 | 424 | 424 | 424 | 424 | 424 | 424 | 424 |
| FD EPS (TWD) | 1.26 | 2.30 | 1.73 | 1.97 | 1.81 | 2.35 | 2.83 | 3.10 | 4.00 | 7.27 | 10.09 | 14.22 |
| Revenue mix | ||||||||||||
| Cellular | 35% | 33% | 31% | 29% | 26% | 25% | 25% | 24% | 32% | 32% | 25% | 23% |
| Infrastructure | 33% | 33% | 33% | 31% | 30% | 29% | 29% | 27% | 33% | 32% | 29% | 28% |
| WiFi | 20% | 17% | 15% | 15% | 14% | 14% | 14% | 13% | 18% | 16% | 14% | 13% |
| Optical & others | 12% | 17% | 21% | 26% | 30% | 31% | 32% | 36% | 17% | 20% | 32% | 37% |
| Margin | ||||||||||||
| Gross | 26% | 28% | 32% | 33% | 32% | 34% | 36% | 38% | 24% | 30% | 35% | 39% |
| Operating | 9% | 14% | 16% | 17% | 16% | 19% | 21% | 23% | 4% | 15% | 20% | 24% |
| EBITDA | 27% | 29% | 30% | 31% | 30% | 31% | 33% | 33% | 28% | 29% | 32% | 33% |
| Net | 12% | 19% | 12% | 14% | 13% | 15% | 17% | 18% | 10% | 14% | 16% | 19% |
| Growth (QoQ) | ||||||||||||
| Total revenue | -4% | 15% | 12% | 3% | -2% | 13% | 8% | 1% | ||||
| Gross profit | -21% | 23% | 25% | 7% | -5% | 21% | 14% | 6% | ||||
| Operating profit | -35% | 72% | 28% | 11% | -8% | 30% | 21% | 10% | ||||
| Net profit | -48% | 83% | -25% | 14% | -8% | 30% | 21% | 10% | ||||
| FD EPS | -48% | 83% | -25% | 14% | -8% | 30% | 21% | 10% | ||||
| Growth (YoY) | ||||||||||||
| Total revenue | 28% | 39% | 32% | 27% | 30% | 28% | 23% | 19% | -5% | 31% | 24% | 15% |
| Gross profit | 102% | 113% | 54% | 31% | 57% | 54% | 40% | 39% | 0% | 63% | 46% | 29% |
| Operating profit | nm | nm | 146% | 58% | 124% | 70% | 60% | 58% | -6% | 344% | 70% | 39% |
| Net profit | nm | nm | -31% | -19% | 44% | 2% | 63% | 57% | 121% | 82% | 39% | 41% |
| FD EPS | nm | nm | -31% | -19% | 44% | 2% | 63% | 57% | 121% | 82% | 39% | 41% |
Source: Company, Daiwa estimates and forecasts
WinSemi: quarterly P&L estimates and forecasts
| 2Q26 | 2Q26 | 2Q26 | Growth | Growth | Growth | 3Q26E | |
|---|---|---|---|---|---|---|---|
| TWDm | Actual | Daiwa | Variance | QoQ | YoY | Guidance | Daiwa (previous) |
| Revenue | 5,257 | 5,267 | 0% | 15% | 39% | Revenue to grow by low-teens %QoQ | up 11% QoQ |
| Gross profit | 1,485 | 1,517 | -2% | 23% | 113% | GM to be around low-30s | 30% |
| Operating profit | 742 | 637 | 16% | 72% | nm | ||
| EBITDA | 1,523 | 1,483 | 3% | 25% | 62% | ||
| Pretax profit | 1,188 | 597 | 99% | 123% | nm | ||
| Net profit | 977 | 478 | 104% | 83% | nm | ||
| Adjusted EPS (TWD) | 2.30 | 1.13 | 104% | 83% | nm | ||
| Margin | |||||||
| Gross | 28.2% | 28.8% | -0.6% | ||||
| Operating | 14.1% | 12.1% | 2.0% | ||||
| EBITDA | 29.0% | 28.2% | 0.8% | ||||
| Net | 18.6% | 9.1% | 9.5% | ||||
| Operation | |||||||
| Utilization* | 65% | 67% | |||||
| Revenue mix | |||||||
| Cellular | 30-35% | 34% | |||||
| Infrastructure | 30-35% | 30% | |||||
| WiFi | 10-15% | 19% | |||||
| Others** | 15-20% | 18% |
Source: Company, Daiwa estimates and forecasts
Note: * Daiwa: wafer shipment / capacity; Company: wafer output / capacity; ** Others including vertical cavity surface emitting lasers (VCSEL) and other optical sales
WinSemi: PBR trend
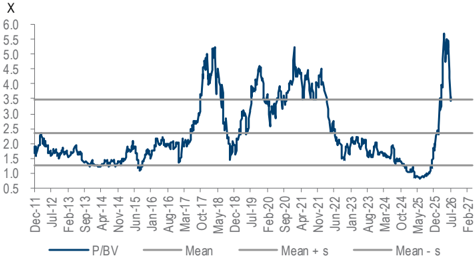
Source: Company, TEJ, Daiwa forecasts
WinSemi: 4-quarter forward PER band
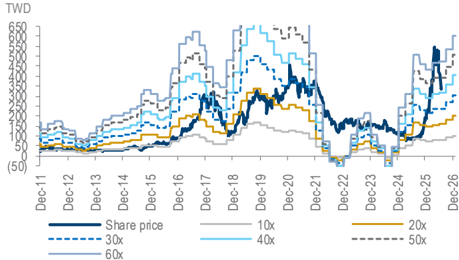
Source: Company, TEJ, Daiwa forecasts
Win Semiconductors (3105 TT): 24 July 2026
Financial summary
Key assumptions
| Year to 31 Dec | 2021 | 2022 | 2023 | 2024 | 2025 | 2026E | 2027E | 2028E |
|---|---|---|---|---|---|---|---|---|
| Wafer shipment (6" equ) | 483,237 | 316,573 | 265,500 | 300,450 | 292,525 | 360,255 | 388,514 | 423,152 |
| Utilisation rate (%) | 94 | 61 | 50 | 55 | 54 | 68 | 82 | 92 |
| Blended wafer ASP (USD) | 1,730 | 1,709 | 1,635 | 1,607 | 1,623 | 1,655 | 1,695 | 1,715 |
Profit and loss (TWDm)
| Year to 31 Dec | 2021 | 2022 | 2023 | 2024 | 2025 | 2026E | 2027E | 2028E |
|---|---|---|---|---|---|---|---|---|
| Cellular & WiFi | 16,469 | 9,168 | 8,263 | 9,446 | 8,226 | 10,502 | 10,545 | 11,083 |
| Infrastructure | 5,071 | 5,276 | 4,075 | 4,943 | 5,529 | 7,057 | 7,845 | 8,822 |
| Other Revenue | 4,642 | 3,891 | 3,499 | 3,069 | 2,884 | 4,289 | 8,803 | 11,453 |
| Total Revenue | 26,182 | 18,334 | 15,836 | 17,458 | 16,639 | 21,848 | 27,193 | 31,358 |
| Other income | 0 | 0 | 0 | 0 | 0 | 0 | 0 | 0 |
| COGS | (16,412) | (13,610) | (12,367) | (13,416) | (12,612) | (15,297) | (17,618) | (19,050) |
| SG&A | (2,015) | (1,557) | (1,679) | (1,590) | (1,709) | (1,797) | (2,131) | (2,457) |
| Other op.expenses | (1,332) | (1,684) | (1,846) | (1,691) | (1,603) | (1,584) | (2,040) | (2,352) |
| Operating profit | 6,424 | 1,484 | (56) | 762 | 715 | 3,170 | 5,405 | 7,498 |
| Net-interest inc./(exp.) | (246) | (204) | (437) | (587) | (478) | (240) | (160) | (65) |
| Assoc/forex/extraord./others | 222 | 547 | (186) | 158 | 1,150 | 753 | 100 | 100 |
| Pre-tax profit | 6,401 | 1,826 | (679) | 332 | 1,387 | 3,683 | 5,345 | 7,533 |
| Tax | (1,189) | (411) | 121 | 7 | (297) | (760) | (1,069) | (1,507) |
| Min. int./pref. div./others | 245 | 388 | 478 | 428 | 604 | 157 | 0 | 0 |
| Net profit (reported) | 5,456 | 1,802 | (80) | 768 | 1,694 | 3,081 | 4,276 | 6,027 |
| Net profit (adjusted) | 5,456 | 1,802 | (80) | 768 | 1,694 | 3,081 | 4,276 | 6,027 |
| EPS (reported)(TWD) | 12.898 | 4.252 | (0.188) | 1.811 | 3.995 | 7.267 | 10.086 | 14.216 |
| EPS (adjusted)(TWD) | 12.898 | 4.252 | (0.188) | 1.811 | 3.995 | 7.267 | 10.086 | 14.216 |
| EPS (adjusted fully-diluted)(TWD) | 12.070 | 4.050 | (0.188) | 1.811 | 3.995 | 7.267 | 10.086 | 14.216 |
| DPS (TWD) | 10.025 | 8.002 | 2.500 | 0.000 | 1.000 | 2.000 | 3.500 | 5.000 |
| EBIT | 6,424 | 1,484 | (56) | 762 | 715 | 3,170 | 5,405 | 7,498 |
| EBITDA | 10,591 | 5,787 | 4,685 | 5,462 | 4,709 | 6,418 | 8,688 | 10,381 |
Cash flow (TWDm)
| Year to 31 Dec | 2021 | 2022 | 2023 | 2024 | 2025 | 2026E | 2027E | 2028E |
|---|---|---|---|---|---|---|---|---|
| Profit before tax | 6,401 | 1,826 | (679) | 332 | 1,387 | 3,683 | 5,345 | 7,533 |
| Depreciation and amortisation | 4,167 | 4,304 | 4,740 | 4,700 | 3,994 | 3,248 | 3,284 | 2,883 |
| Tax paid | (1,189) | (411) | 121 | 7 | (297) | (760) | (1,069) | (1,507) |
| Change in working capital | (1,738) | 1,743 | 422 | (227) | 207 | (1,300) | (500) | (550) |
| Other operational CF items | 175 | (1,492) | (335) | 88 | (338) | 157 | (0) | 0 |
| Cash flow from operations | 7,815 | 5,968 | 4,270 | 4,900 | 4,953 | 5,029 | 7,059 | 8,360 |
| Capex | (8,081) | (7,124) | (3,209) | (1,222) | (1,691) | (2,000) | (1,500) | (1,000) |
| Net (acquisitions)/disposals | 0 | 0 | 0 | 0 | 0 | 0 | 0 | 0 |
| Other investing CF items | (6,514) | 43 | 456 | 166 | 6,804 | 0 | 0 | 0 |
| Cash flow from investing | (14,594) | (7,081) | (2,753) | (1,055) | 5,112 | (2,000) | (1,500) | (1,000) |
| Change in debt | 18,581 | (1,384) | (7) | (8,113) | (7,202) | (1,233) | (1,110) | (999) |
| Net share issues/(repurchases) | 0 | 0 | 0 | 0 | 0 | 0 | 0 | 0 |
| Dividends paid | (4,240) | (3,392) | (1,060) | 0 | (424) | (848) | (1,484) | (2,120) |
| Other financing CF items | 491 | (248) | (609) | (826) | (654) | 100 | 100 | 100 |
| Cash flow from financing | 14,831 | (5,023) | (1,676) | (8,939) | (8,280) | (1,981) | (2,493) | (3,018) |
| Forex effect/others | (76) | 184 | 106 | 188 | (138) | 0 | 0 | 0 |
| Change in cash | 7,975 | (5,952) | (54) | (4,906) | 1,648 | 1,048 | 3,066 | 4,342 |
| Free cash flow | (266) | (1,156) | 1,061 | 3,678 | 3,262 | 3,029 | 5,559 | 7,360 |
Source: FactSet, Daiwa forecasts
Win Semiconductors (3105 TT): 24 July 2026
Daiwa
Financial summary continued …
Balance sheet (TWDm)
| Year to 31 Dec | 2021 | 2022 | 2023 | 2024 | 2025 | 2026E | 2027E | 2028E |
|---|---|---|---|---|---|---|---|---|
| Cash & short-term investment | 16,394 | 10,501 | 10,469 | 5,695 | 7,391 | 8,438 | 11,504 | 15,846 |
| Inventory | 6,671 | 5,420 | 5,111 | 4,992 | 4,979 | 5,979 | 6,279 | 6,679 |
| Accounts receivable | 2,718 | 917 | 1,149 | 1,226 | 1,597 | 1,947 | 2,547 | 2,647 |
| Other current assets | 672 | 376 | 435 | 543 | 590 | 450 | 450 | 450 |
| Total current assets | 26,455 | 17,213 | 17,163 | 12,455 | 14,557 | 16,814 | 20,780 | 25,622 |
| Fixed assets | 27,784 | 31,546 | 31,312 | 28,265 | 19,672 | 19,041 | 17,750 | 16,299 |
| Goodwill & intangibles | 5,187 | 4,944 | 3,588 | 3,538 | 5,409 | 3,060 | 3,055 | 3,050 |
| Other non-current assets | 15,468 | 15,425 | 17,104 | 20,000 | 21,091 | 21,091 | 21,091 | 21,091 |
| Total assets | 74,894 | 69,128 | 69,168 | 64,259 | 60,729 | 60,006 | 62,676 | 66,062 |
| Short-term debt | 0 | 0 | 21 | 26 | 330 | 330 | 330 | 330 |
| Accounts payable | 2,163 | 1,017 | 1,362 | 1,094 | 1,662 | 1,712 | 2,112 | 2,062 |
| Other current liabilities | 5,052 | 5,230 | 11,340 | 6,483 | 3,873 | 5,033 | 5,210 | 5,399 |
| Total current liabilities | 7,215 | 6,247 | 12,724 | 7,603 | 5,865 | 7,075 | 7,652 | 7,791 |
| Long-term debt | 29,279 | 26,540 | 20,030 | 16,532 | 12,328 | 11,095 | 9,986 | 8,987 |
| Other non-current liabilities | 1,278 | 1,152 | 1,065 | 986 | 545 | 1,000 | 1,100 | 1,200 |
| Total liabilities | 37,772 | 33,939 | 33,819 | 25,121 | 18,738 | 19,170 | 18,738 | 17,978 |
| Share capital | 4,240 | 4,239 | 4,239 | 4,239 | 4,239 | 4,239 | 4,239 | 4,239 |
| Reserves/R.E./others | 30,698 | 29,089 | 29,716 | 33,879 | 37,306 | 36,097 | 39,099 | 43,145 |
| Shareholders' equity | 34,938 | 33,329 | 33,955 | 38,118 | 41,545 | 40,336 | 43,339 | 47,384 |
| Minority interests | 2,184 | 1,861 | 1,394 | 1,020 | 446 | 500 | 600 | 700 |
| Total equity & liabilities | 74,894 | 69,128 | 69,168 | 64,259 | 60,729 | 60,006 | 62,676 | 66,062 |
| EV | 159,845 | 162,676 | 155,751 | 156,659 | 150,489 | 148,263 | 144,187 | 138,947 |
| Net debt/(cash) | 12,886 | 16,039 | 9,582 | 10,864 | 5,268 | 2,987 | (1,188) | (6,528) |
| BVPS (TWD) | 82.600 | 78.631 | 80.094 | 89.914 | 97.998 | 95.146 | 102.229 | 111.771 |
Key ratios (%)
| Year to 31 Dec | 2021 | 2022 | 2023 | 2024 | 2025 | 2026E | 2027E | 2028E |
|---|---|---|---|---|---|---|---|---|
| Sales (YoY) | 2.5 | (30.0) | (13.6) | 10.2 | (4.7) | 31.3 | 24.5 | 15.3 |
| EBITDA (YoY) | (8.1) | (45.4) | (19.1) | 16.6 | (13.8) | 36.3 | 35.4 | 19.5 |
| Operating profit (YoY) | (17.5) | (76.9) | n.a. | n.a. | (6.2) | 343.6 | 70.5 | 38.7 |
| Net profit (YoY) | (16.4) | (67.0) | n.a. | n.a. | 120.6 | 81.9 | 38.8 | 41.0 |
| Core EPS (fully-diluted) (YoY) | (21.6) | (66.4) | n.a. | n.a. | 120.6 | 81.9 | 38.8 | 41.0 |
| Gross-profit margin | 37.3 | 25.8 | 21.9 | 23.2 | 24.2 | 30 | 35.2 | 39.2 |
| EBITDA margin | 40.5 | 31.6 | 29.6 | 31.3 | 28.3 | 29.4 | 31.9 | 33.1 |
| Operating-profit margin | 24.5 | 8.1 | n.a. | 4.4 | 4.3 | 14.5 | 19.9 | 23.9 |
| Net profit margin | 20.8 | 9.8 | n.a. | 4.4 | 10.2 | 14.1 | 15.7 | 19.2 |
| ROAE | 15.8 | 5.3 | n.a. | 2.1 | 4.3 | 7.5 | 10.2 | 13.3 |
| ROAA | 8.4 | 2.5 | n.a. | 1.2 | 2.7 | 5.1 | 7.0 | 9.4 |
| ROCE | 11.3 | 2.3 | n.a. | 1.4 | 1.3 | 5.9 | 10.1 | 13.4 |
| ROIC | 11.9 | 2.3 | n.a. | 1.6 | 1.5 | 5.5 | 10.0 | 14.2 |
| Net debt to equity | 36.9 | 48.1 | 28.2 | 28.5 | 12.7 | 7.4 | n.a. | n.a. |
| Effective tax rate | 18.6 | 22.5 | 0.0 | 0.0 | 0.0 | 20.6 | 20.0 | 20.0 |
| Accounts receivable (days) | 33.1 | 36.2 | 23.8 | 24.8 | 31.0 | 29.6 | 30.2 | 30.2 |
| Current ratio (x) | 3.7 | 2.8 | 1.3 | 1.6 | 2.5 | 2.4 | 2.7 | 3.3 |
| Net interest cover (x) | 26.2 | 7.3 | n.a. | 1.3 | 1.5 | 13.2 | 33.8 | 115.4 |
| Net dividend payout | 64.8 | 62.2 | 58.8 | 0.0 | 25.0 | 27.5 | 34.7 | 35.2 |
| Free cash flow yield | n.a. | n.a. | 0.7 | 2.5 | 2.3 | 2.1 | 3.8 | 5.1 |
Source: FactSet, Daiwa forecasts
Company profile
Founded in 1999, Win Semiconductors Corp (WinSemi) is the world's largest compound semiconductor foundry, focusing on gallium-arsenide (GaAs) foundry services for customers in both wireless and wireline communication markets, as well as infrastructure applications. It has a diverse technology portfolio of processes that supports microwave frequency requirements from 50MHz to 100GHz, with applications including smartphones, tablet PCs, cellular base-stations, very small aperture terminals (VSAT) and fibre optics. It has started penetrating into vertical cavity surface emitting laser (VCSEL) foundries since 2017 for consumer laser applications such as 3D laser sensors and cameras.
Win Semiconductors (3105 TT): 24 July 2026
Daiwa
ESG analysis
ESG risks
| Risks | Management | Analyst comments | |
|---|---|---|---|
| Executive/board quality | 2 | WinSemi's board of directors (BoD) has 10 members, including 3 independent directors, representing 30% of total directors. Among the BoD, three of its non-independent directors are also executive management. | |
| G | Capital management | 2 | Since 2017, its dividend payout ratio has remained above 58%, except for 2024 when no dividend was paid. Despite being the largest compound semiconductor foundry in the world, WinSemi is continually expanding its capacity for future growth. Thus, we see the balance between investment and dividend as appropriate. |
| Related party & transaction | 1 | It did not have any meaningful related-party transactions in 2023. | |
| S | Supply chain management | 2 | WinSemi We actively cooperate with local suppliers and improve their development capabilities, reduce carbon emissions and create local employment opportunities. WinSemi also conducts on- site audits of suppliers and annual assessment of suppliers on environmental protection and safety & health management systems. In 2023, 100% of WinSemi's new suppliers signed the "WIN Supplier Code of Conduct".'" |
| E | Water & wastewater management | 1 | Effluent that flows out of WinSemi's facilities will first undergo pre-treatment in-house and then treatment by the wastewater treatment plant at Hwaya Technology Park before discharge. The plant has an acid and alkali wastewater recycling system and chemical mechanical polishing wastewater recycling system for wastewater management. |
| E | Waste & hazardous materials management | 1 | WinSemi has established a hazardous substance-free management procedure and also collaborates with its suppliers to produce products that are hazardous substance-free for customers and consumers. WinSemi specifies in purchase contracts and order forms with its suppliers that the provided materials may not contain hazardous substances as defined by WinSemi. For waste management, it aims to increase the recycling rate of waste solvents and reduce the use of raw materials in production. |
| E | GHG emissions | 1 | For reduction of energy consumption, it prioritises high-efficiency and low energy consumption models when replacing equipment and has also established annual energy conservation management objectives. WinSemi targets to reduce electricity consumption (kWh/6"e wafer) by 12% from 2018 to 458.58 and PFCs emission (ton CO2e/6"e wafer) by 50% from 2018 to 0.114 in 2030. |
Note: Management score represents a company's ability to manage/benefit from certain ESG topics. The scores range from 1 to 3, with 1 being the strongest.
Update Date: 4 May 2026
Source: Daiwa, Company
Win Semiconductors (3105 TT): 24 July 2026
Daiwa