PDF 原檔:報告_Daiwa_旭隼6409_20260810_original.pdf
圖片清單(已驗證 2026-08-11)
| 檔名 | size | 分類 | 親眼所見內容 |
|---|---|---|---|
260810_daiwa_Voltronic Power Tech_001.png |
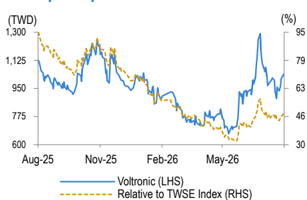
27KB | 真資料圖 | 旭隼股價走勢折線圖(藍線,左軸 TWD)與相對 TWSE 指數表現(金色虛線,右軸 %),時間軸 Aug-25 至 May-26 |
260810_daiwa_Voltronic Power Tech_002.png |
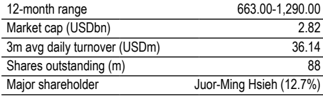
19KB | 真資料圖 | 資料表:12個月股價區間 663.00–1,290.00、市值 2.82(USDbn)、3個月日均成交額 36.14(USDm)、流通股數 88(m)、主要股東 Juor-Ming Hsieh(12.7%) |
260810_daiwa_Voltronic Power Tech_003.png |
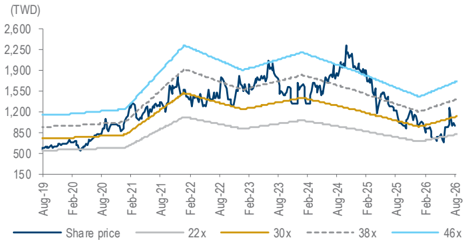
51KB | 真資料圖 | 旭隼一年期預估本益比區間圖(22x/30x/38x/46x 四條參考線),時間軸 Aug-19 至 Aug-26 |
260810_daiwa_Voltronic Power Tech_004.png |
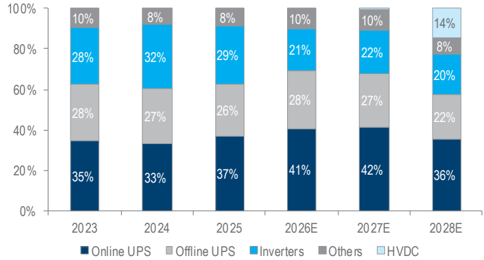
36KB | 真資料圖 | 旭隼營收結構堆疊長條圖(Online UPS/Offline UPS/Inverters/Others/HVDC),2023–2028E;HVDC 占比自 2023–2025 年 0% 預估成長至 2026E 10%、2027E 10%、2028E 14% |
原始內容
Taiwan
Voltronic Power Technology (6409 TT)
Target price:
TWD1,180.00 (from TWD1,180.00)
Share price (10 Aug): TWD1,040.00 | Up/downside: +13.5%
2Q26 results: HVDC development largely on track
- A mixed bag in core business but stabilised already
- HVDC development on track and will contribute in 2028
- Reaffirming our Buy (1) rating; reiterating 12M TP of TWD1,180
What's new: We provide updates after 2Q26 results on 10 August.
What's the impact: 2Q26 results a mixed bag. Voltronic's 2Q26 earnings came in at TWD712m (EPS: TWD8.12), 1% higher than our estimate (TWD706m). Revenue reached TWD5.54bn (+32% QoQ; -3% YoY), 5% higher than our expectation as both on-line and off-line UPS demand recovered (on-line: grew +29/19% QoQ/YoY; off-line: grew 24% /28% QoQ/YoY) after demand was impacted in 1Q26 by the Middle East war and Voltronic's price hikes. That said, apart from metal cost hike, Voltronic also suffered from the rising cost of power semi (c.20% of raw material) and PCB (4% of raw material) from 2Q26. Along with the existing price competition from inverter business (revenue was down 44% YoY in 2Q26), gross margin declined 0.8pp. That said, operating margin remained 18.1% given the lower operating expense; we believe the key reason was the employee stock option plan having lower cost than we expected. Lastly, higher FX losses of TWD210m, mainly due to CNY appreciation vs. TWD (up 0.9% in 2Q26) dragged net profit despite being offset by a lower tax rate (11.6%) due to Chinese government subsidies.
Business update. In general, we sense that UPS demand has recovered from 2Q26. However, despite the inverter segment being in the peak season, (+60% QoQ in 2Q26), Voltronic still delivered c.44% YoY decline despite a low base. We attribute the weakness to the Middle East war and weaker-than-expected demand from South Africa. On top of this, inverter margins continuously declined in 2Q26 given fierce competition. We believe this might be the key drag to Voltronic now. In terms of gross margin trend, we expect Voltronic has already raised its pricing a second time in June to pass through the power semi and PCB cost to end customers. As such, we forecast gross margin will recover QoQ in 3Q26. However, management also indicates that they don't rule out another round of price hikes due to increasing raw material cost. Lastly and most importantly, we learned that Voltronic has just gotten certification from a key HVDC client and this client has recently started a new HVDC project within Voltronic. As such, we expect the progress to be largely on track with our expectation to have more meaningful revenue contribution from 2028.
What we recommend: We slightly trim 2027-28E EPS by 1-3% on weaker inverter segment performance. We reaffirm our Buy (1) call and maintain our 12M TP of TWD1,180, with an unchanged PER of 30x applied to our 1year forward EPS (lower than the mid-point of its past-3-year range of 3046x). Key downside risk: worse-than-expected global economic growth.
How we differ: We believe we are among the few QFII brokers to continuously provide updates on Voltronic.
10 August 2026
5
Daiwa
3
→
2
1
Buy
Sheng Cheng
(886) 2 8758 6253
sheng.cheng@daiwacm-cathay.com.tw
Allan Wang (886) 2 8758 6249 allan.wang@daiwacm-cathay.com.tw
Forecast revisions (%)
| Year to 31 Dec | 26E | 27E | 28E |
|---|---|---|---|
| Revenue change | (0.3) | (0.6) | (1.0) |
| Net profit change | (0.5) | (3.1) | (1.4) |
| Core EPS (FD) change | (0.5) | (3.1) | (1.4) |
Source: Daiwa forecasts
Share price performance
| 12-month range | 663.00-1,290.00 |
|---|---|
| Market cap (USDbn) | 2.82 |
| 3m avg daily turnover (USDm) | 36.14 |
| Shares outstanding (m) | 88 |
| Major shareholder | Juor-Ming Hsieh (12.7%) |
Financial summary (TWD)
| Year to 31 Dec | 26E | 27E | 28E |
|---|---|---|---|
| Revenue (m) | 19,913 | 20,850 | 25,634 |
| Operating profit (m) | 3,683 | 4,194 | 5,505 |
| Net profit (m) | 2,722 | 3,543 | 4,618 |
| Core EPS (fully-diluted) | 31.035 | 40.399 | 52.655 |
| EPS change (%) | (22.7) | 30.2 | 30.3 |
| Daiwa vs Cons. EPS (%) | (23.2) | (21.4) | (14.3) |
| PER (x) | 33.5 | 25.7 | 19.8 |
| Dividend yield (%) | 3.5 | 3.0 | 3.5 |
| DPS | 36.0 | 31.0 | 36.0 |
| PBR (x) | 10.1 | 9.3 | 8.1 |
| EV/EBITDA (x) | 20.3 | 17.8 | 13.7 |
| ROE (%) | 29.3 | 37.6 | 43.7 |
Source: FactSet, Daiwa forecasts
Voltronic: revenue and earnings forecast revisions
| 2026E | 2026E | 2026E | 2027E | 2027E | 2027E | 2028E | 2028E | 2028E | |
|---|---|---|---|---|---|---|---|---|---|
| (TWDm) | Previous | New | Consensus | Previous | New | Consensus | Previous | New | Consensus |
| Revenue | 19,966 | 19,913 | 20,430 | 20,974 | 20,850 | 22,606 | 25,894 | 25,634 | 25,647 |
| Diff (%) | -0.3% | -2.5% | -0.6% | -7.8% | -1.0% | 0.0% | |||
| Gross Margin (%) | 26.9% | 26.3% | 27.5% | 29.1% | 28.1% | 28.4% | 29.8% | 29.2% | 28.6% |
| Operating profit | 3,502 | 3,683 | 3,824 | 4,333 | 4,194 | 4,455 | 5,585 | 5,505 | 5,251 |
| Op Margin (%) | 17.5% | 18.5% | 18.7% | 20.7% | 20.1% | 19.7% | 21.6% | 21.5% | 20.5% |
| Net profit | 2,736 | 2,722 | 3,544 | 3,657 | 3,543 | 4,509 | 4,684 | 4,618 | 5,389 |
| EPS (TWD) | 31.20 | 31.03 | 40.41 | 41.70 | 40.40 | 51.41 | 53.41 | 52.65 | 61.44 |
| Diff (%) | -0.5% | -23.2% | -3.1% | -21.4% | -1.4% | -14.3% |
Source: Bloomberg, Daiwa forecasts
Voltronic: quarterly and annual P&L statement
| 2026E | 2027E | 2026E | 2026E | 2025 | 2026E | 2027E | 2028E | |||||
|---|---|---|---|---|---|---|---|---|---|---|---|---|
| (TWDm) | 1Q | 2Q | 3QE | 4QE | 1QE | 2QE | 3QE | 4QE | ||||
| Net revenue | 4,205 | 5,554 | 5,254 | 4,899 | 4,531 | 5,499 | 5,377 | 5,443 | 20,521 | 19,913 | 20,850 | 25,634 |
| COGS | -3,107 | -4,150 | -3,872 | -3,555 | -3,273 | -3,959 | -3,862 | -3,895 | -14,561 | -14,685 | -14,989 | -18,137 |
| Gross profit | 1,097 | 1,404 | 1,382 | 1,345 | 1,258 | 1,540 | 1,515 | 1,548 | 5,960 | 5,228 | 5,861 | 7,497 |
| Operating expenses | -336 | -398 | -405 | -407 | -367 | -418 | -430 | -452 | -1,632 | -1,545 | -1,667 | -1,992 |
| Operating profit | 761 | 1,007 | 977 | 938 | 891 | 1,122 | 1,084 | 1,096 | 4,329 | 3,683 | 4,194 | 5,505 |
| Non-operating profit | -264 | -201 | 31 | 32 | 32 | 32 | 32 | 32 | -12 | -402 | 127 | 127 |
| Pre-tax profit | 498 | 805 | 1,008 | 970 | 923 | 1,154 | 1,116 | 1,128 | 4,317 | 3,281 | 4,321 | 5,632 |
| Income taxes | -106 | -93 | -215 | -146 | -166 | -208 | -201 | -203 | -796 | -560 | -778 | -1,014 |
| Net profit | 392 | 712 | 793 | 825 | 757 | 946 | 915 | 925 | 3,521 | 2,722 | 3,543 | 4,618 |
| Net EPS (TWD) | 4.46 | 8.12 | 9.05 | 9.40 | 8.63 | 10.79 | 10.43 | 10.55 | 40.15 | 31.03 | 40.40 | 52.65 |
| Operating Ratios | ||||||||||||
| Gross margin | 26.1% | 25.3% | 26.3% | 27.4% | 27.8% | 28.0% | 28.2% | 28.4% | 29.0% | 26.3% | 28.1% | 29.2% |
| Operating margin | 18.1% | 18.1% | 18.6% | 19.1% | 19.7% | 20.4% | 20.2% | 20.1% | 21.1% | 18.5% | 20.1% | 21.5% |
| Pre-tax margin | 11.8% | 14.5% | 19.2% | 19.8% | 20.4% | 21.0% | 20.8% | 20.7% | 21.0% | 16.5% | 20.7% | 22.0% |
| Net margin | 9.3% | 12.8% | 15.1% | 16.8% | 16.7% | 17.2% | 17.0% | 17.0% | 17.2% | 13.7% | 17.0% | 18.0% |
| YoY (%) | ||||||||||||
| Net revenue | -16% | -3% | 1% | 6% | 8% | -1% | 2% | 11% | -10% | -3% | 5% | 23% |
| Gross profit | -26% | -14% | -8% | 0% | 15% | 10% | 10% | 15% | -15% | -12% | 12% | 28% |
| Operating profit | -29% | -13% | -15% | -3% | 17% | 11% | 11% | 17% | -15% | -15% | 14% | 31% |
| Pre-tax profit | -53% | -55% | 22% | 46% | 85% | 43% | 11% | 16% | -15% | -24% | 32% | 30% |
| Net profit | -54% | -52% | 24% | 55% | 93% | 33% | 15% | 12% | -16% | -23% | 30% | 30% |
| QoQ (%) | ||||||||||||
| Net revenue | -9% | 32% | -5% | -7% | -8% | 21% | -2% | 1% | ||||
| Gross profit | -19% | 28% | -2% | -3% | -6% | 22% | -2% | 2% | ||||
| Operating profit | -21% | 32% | -3% | -4% | -5% | 26% | -3% | 1% | ||||
| Pre-tax profit | -25% | 62% | 25% | -4% | -5% | 25% | -3% | 1% | ||||
| Net profit | -27% | 82% | 11% | 4% | -8% | 25% | -3% | 1% |
Source: Company, Daiwa forecasts
Voltronic: 1-year forward PER bands
Source: TEJ, Daiwa forecasts
Voltronic Power Technology (6409 TT): 10 August 2026
Voltronic: revenue breakdown by product
Source: Company, Daiwa forecasts
Daiwa
Financial summary
Key assumptions
| Year to 31 Dec | 2021 | 2022 | 2023 | 2024 | 2025 | 2026E | 2027E | 2028E |
|---|---|---|---|---|---|---|---|---|
| UPS shipment (m units) | 7 | 8.8 | 7.5 | 8.8 | 7.7 | 8.2 | 0 | 0 |
| On-line UPS ASP (USD) | 245.5 | 251 | 251 | 251 | 251 | 251 | 0 | 0 |
| Off-line UPS ASP (USD) | 33.4 | 26 | 26 | 26 | 26 | 26 | 0 | 0 |
Profit and loss (TWDm)
| Year to 31 Dec | 2021 | 2022 | 2023 | 2024 | 2025 | 2026E | 2027E | 2028E |
|---|---|---|---|---|---|---|---|---|
| Online UPS | 6,002 | 7,124 | 6,559 | 7,593 | 7,585 | 8,143 | 8,697 | 9,124 |
| Offline UPS | 5,751 | 6,090 | 5,264 | 6,189 | 5,291 | 5,657 | 5,536 | 5,588 |
| Other Revenue | 5,204 | 9,511 | 7,128 | 9,031 | 7,645 | 6,113 | 6,617 | 10,922 |
| Total Revenue | 16,957 | 22,725 | 18,951 | 22,813 | 20,521 | 19,913 | 20,850 | 25,634 |
| Other income | 0 | 0 | 0 | 0 | 0 | 0 | 0 | 0 |
| COGS | (12,646) | (15,588) | (12,982) | (15,790) | (14,561) | (14,685) | (14,989) | (18,137) |
| SG&A | (785) | (943) | (897) | (946) | (787) | (640) | (724) | (900) |
| Other op.expenses | (601) | (906) | (933) | (962) | (845) | (905) | (943) | (1,092) |
| Operating profit | 2,925 | 5,288 | 4,138 | 5,115 | 4,329 | 3,683 | 4,194 | 5,505 |
| Net-interest inc./(exp.) | 31 | (7) | 83 | 164 | 139 | 127 | 127 | 127 |
| Assoc/forex/extraord./others | (65) | 122 | 162 | (189) | (151) | (529) | 0 | 0 |
| Pre-tax profit | 2,890 | 5,403 | 4,382 | 5,090 | 4,317 | 3,281 | 4,321 | 5,632 |
| Tax | (531) | (970) | (760) | (886) | (796) | (560) | (778) | (1,014) |
| Min. int./pref. div./others | 0 | 0 | 0 | 0 | 0 | 0 | 0 | 0 |
| Net profit (reported) | 2,359 | 4,433 | 3,623 | 4,204 | 3,521 | 2,722 | 3,543 | 4,618 |
| Net profit (adjusted) | 2,359 | 4,433 | 3,623 | 4,204 | 3,521 | 2,722 | 3,543 | 4,618 |
| EPS (reported)(TWD) | 26.989 | 50.510 | 41.292 | 47.929 | 40.145 | 31.035 | 40.399 | 52.655 |
| EPS (adjusted)(TWD) | 26.989 | 50.510 | 41.292 | 47.929 | 40.145 | 31.035 | 40.399 | 52.655 |
| EPS (adjusted fully-diluted)(TWD) | 26.989 | 50.510 | 41.292 | 47.929 | 40.145 | 31.035 | 40.399 | 52.655 |
| DPS (TWD) | 23.500 | 24.500 | 24.500 | 24.500 | 43.000 | 36.000 | 31.000 | 36.000 |
| EBIT | 2,925 | 5,288 | 4,138 | 5,115 | 4,329 | 3,683 | 4,194 | 5,505 |
| EBITDA | 3,224 | 5,615 | 4,500 | 5,464 | 4,641 | 4,202 | 4,737 | 6,073 |
Cash flow (TWDm)
| Year to 31 Dec | 2021 | 2022 | 2023 | 2024 | 2025 | 2026E | 2027E | 2028E |
|---|---|---|---|---|---|---|---|---|
| Profit before tax | 2,890 | 5,403 | 4,382 | 5,090 | 4,317 | 3,281 | 4,321 | 5,632 |
| Depreciation and amortisation | 299 | 327 | 362 | 349 | 313 | 519 | 543 | 569 |
| Tax paid | (531) | (970) | (760) | (886) | (796) | (560) | (778) | (1,014) |
| Change in working capital | (715) | 5 | 173 | (413) | 786 | (285) | (104) | (243) |
| Other operational CF items | 355 | 854 | (75) | 264 | (3) | 0 | 0 | 0 |
| Cash flow from operations | 2,299 | 5,619 | 4,083 | 4,404 | 4,617 | 2,956 | 3,982 | 4,944 |
| Capex | (520) | (1,974) | (182) | (87) | (60) | (259) | (271) | (333) |
| Net (acquisitions)/disposals | 0 | 0 | 0 | 0 | (316) | 0 | 0 | 0 |
| Other investing CF items | (12) | (0) | (50) | (17) | (19) | 0 | 0 | 0 |
| Cash flow from investing | (532) | (1,975) | (232) | (104) | (395) | (259) | (271) | (333) |
| Change in debt | 622 | (1,639) | (98) | 0 | 0 | 0 | 0 | 0 |
| Net share issues/(repurchases) | 0 | 0 | 0 | 0 | 0 | 0 | 0 | 0 |
| Dividends paid | (2,055) | (2,054) | (3,818) | (3,290) | (3,772) | (3,157) | (2,719) | (3,157) |
| Other financing CF items | (91) | (98) | (93) | (101) | (74) | 0 | 0 | 0 |
| Cash flow from financing | (1,524) | (3,791) | (4,009) | (3,391) | (3,846) | (3,157) | (2,719) | (3,157) |
| Forex effect/others | 0 | 0 | 0 | 0 | 0 | 0 | 0 | 0 |
| Change in cash | 242 | (147) | (157) | 909 | 376 | (461) | 992 | 1,453 |
| Free cash flow | 1,778 | 3,644 | 3,902 | 4,317 | 4,556 | 2,697 | 3,711 | 4,611 |
Source: FactSet, Daiwa forecasts
Voltronic Power Technology (6409 TT): 10 August 2026
Daiwa
Financial summary continued …
Balance sheet (TWDm)
| Year to 31 Dec | 2021 | 2022 | 2023 | 2024 | 2025 | 2026E | 2027E | 2028E |
|---|---|---|---|---|---|---|---|---|
| Cash & short-term investment | 5,155 | 5,353 | 5,045 | 6,556 | 6,738 | 6,278 | 7,270 | 8,724 |
| Inventory | 1,787 | 2,019 | 1,412 | 2,093 | 1,796 | 1,961 | 2,002 | 2,422 |
| Accounts receivable | 2,867 | 3,173 | 3,007 | 3,518 | 3,439 | 3,375 | 3,534 | 4,345 |
| Other current assets | 233 | 271 | 194 | 256 | 302 | 302 | 302 | 302 |
| Total current assets | 10,042 | 10,816 | 9,657 | 12,423 | 12,276 | 11,916 | 13,108 | 15,793 |
| Fixed assets | 2,730 | 4,474 | 4,420 | 4,390 | 4,172 | 3,912 | 3,640 | 3,404 |
| Goodwill & intangibles | 29 | 25 | 19 | 12 | 9 | 9 | 9 | 9 |
| Other non-current assets | 583 | 770 | 660 | 496 | 628 | 526 | 526 | 526 |
| Total assets | 13,384 | 16,085 | 14,756 | 17,321 | 17,084 | 16,363 | 17,283 | 19,732 |
| Short-term debt | 2,380 | 0 | 0 | 0 | 0 | 0 | 0 | 0 |
| Accounts payable | 3,615 | 4,173 | 3,687 | 4,350 | 4,796 | 4,612 | 4,707 | 5,696 |
| Other current liabilities | 1,500 | 2,454 | 1,798 | 2,276 | 2,086 | 2,086 | 2,086 | 2,086 |
| Total current liabilities | 7,495 | 6,627 | 5,485 | 6,626 | 6,881 | 6,698 | 6,793 | 7,782 |
| Long-term debt | 0 | 832 | 734 | 636 | 538 | 538 | 538 | 538 |
| Other non-current liabilities | 181 | 283 | 180 | 130 | 111 | 111 | 111 | 111 |
| Total liabilities | 7,676 | 7,742 | 6,398 | 7,392 | 7,531 | 7,347 | 7,443 | 8,431 |
| Share capital | 874 | 878 | 877 | 877 | 877 | 877 | 877 | 877 |
| Reserves/R.E./others | 4,833 | 7,466 | 7,480 | 9,052 | 8,676 | 8,139 | 8,963 | 10,424 |
| Shareholders' equity | 5,708 | 8,343 | 8,358 | 9,929 | 9,553 | 9,016 | 9,840 | 11,301 |
| Minority interests | 0 | 0 | 0 | 0 | 0 | 0 | 0 | 0 |
| Total equity & liabilities | 13,384 | 16,085 | 14,756 | 17,321 | 17,084 | 16,363 | 17,283 | 19,732 |
| EV | 88,437 | 86,691 | 86,901 | 85,291 | 85,012 | 85,472 | 84,480 | 83,026 |
| Net debt/(cash) | (2,775) | (4,521) | (4,311) | (5,920) | (6,200) | (5,740) | (6,732) | (8,185) |
| BVPS (TWD) | 65.291 | 95.066 | 95.267 | 113.191 | 108.924 | 102.803 | 112.202 | 128.856 |
Key ratios (%)
| Year to 31 Dec | 2021 | 2022 | 2023 | 2024 | 2025 | 2026E | 2027E | 2028E |
|---|---|---|---|---|---|---|---|---|
| Sales (YoY) | 24.2 | 34.0 | (16.6) | 20.4 | (10.0) | (3.0) | 4.7 | 22.9 |
| EBITDA (YoY) | 8.6 | 74.2 | (19.9) | 21.4 | (15.1) | (9.5) | 12.7 | 28.2 |
| Operating profit (YoY) | 7.1 | 80.8 | (21.8) | 23.6 | (15.4) | (14.9) | 13.9 | 31.3 |
| Net profit (YoY) | 7.4 | 87.9 | (18.3) | 16.1 | (16.3) | (22.7) | 30.2 | 30.3 |
| Core EPS (fully-diluted) (YoY) | 7.4 | 87.2 | (18.3) | 16.1 | (16.2) | (22.7) | 30.2 | 30.3 |
| Gross-profit margin | 25.4 | 31.4 | 31.5 | 30.8 | 29.0 | 26.3 | 28.1 | 29.2 |
| EBITDA margin | 19.0 | 24.7 | 23.7 | 23.9 | 22.6 | 21.1 | 22.7 | 23.7 |
| Operating-profit margin | 17.2 | 23.3 | 21.8 | 22.4 | 21.1 | 18.5 | 20.1 | 21.5 |
| Net profit margin | 13.9 | 19.5 | 19.1 | 18.4 | 17.2 | 13.7 | 17.0 | 18.0 |
| ROAE | 42.7 | 63.1 | 43.4 | 46.0 | 36.1 | 29.3 | 37.6 | 43.7 |
| ROAA | 18.6 | 30.1 | 23.5 | 26.2 | 20.5 | 16.3 | 21.1 | 25.0 |
| ROCE | 38.5 | 61.3 | 45.3 | 52.0 | 41.9 | 37.5 | 42.1 | 49.6 |
| ROIC | 92.7 | n.a | 86.9 | n.a | 95.9 | 92.2 | n.a | n.a |
| Net debt to equity | n.a. | n.a. | n.a. | n.a. | n.a. | n.a. | n.a. | n.a. |
| Effective tax rate | 18.4 | 18.0 | 17.3 | 17.4 | 18.4 | 17.1 | 18.0 | 18.0 |
| Accounts receivable (days) | 57.2 | 48.5 | 59.5 | 52.2 | 61.9 | 62.5 | 60.5 | 56.1 |
| Current ratio (x) | 1.3 | 1.6 | 1.8 | 1.9 | 1.8 | 1.8 | 1.9 | 2.0 |
| Net interest cover (x) | n.a. | 800.7 | n.a. | n.a. | n.a. | n.a. | n.a. | n.a. |
| Net dividend payout | 93.5 | 90.8 | 48.5 | 59.3 | 89.7 | 89.7 | 99.9 | 89.1 |
| Free cash flow yield | 1.9 | 4.0 | 4.3 | 4.7 | 5.0 | 3.0 | 4.1 | 5.1 |
Source: FactSet, Daiwa forecasts
Company profile
Established in May 2008 and listed in March 2014, Voltronic Power Technology (Voltronic) focuses on the ODM business for uninterruptible power supply (UPS) related products, including off-line UPS for PC applications and on-line UPS for industrial applications. Its management team is mostly from Phoenixtec, formerly the largest UPS maker in Taiwan but was acquired by Eaton, a US-based UPS vendor in 2007.
Voltronic Power Technology (6409 TT): 10 August 2026
Daiwa
ESG analysis
ESG risks
| Risks | Management | Analyst comments | |
|---|---|---|---|
| Executive/board quality | 2 | Voltronic's board consists of 8 directors, including 4 independent directors. A total of five meetings were held in 2024. The average attendance rate was 81%. As the Chairman of the Board is also the CEO, Voltronic voluntarily appoints two more independent directors than required by law, and the Audit Committee is comprised entirely of independent directors. We see this measure as positive for the quality of the board. The backgrounds of independent directors are diversified, and they specialise in the areas of accounting and management. We see it as another positive factor for the board's quality. | |
| G | Capital management | 1 | Voltronic had an 90% dividend payout ratio in 2024. In fact, the payout ratios from 2017 to 2021 were above 90%; we see this as a favourable dividend policy to investors. We believe the high dividend payout is likely due to its distinctive business model. Being an ODM for the UPS industry, it faces less competition and the company can maintain its high competitiveness/profit margins without much capital investment. |
| Related party & transaction | 1 | In 2024, revenue from related parties was at 5.0% of total revenue, while purchases from related parties were at 0.2% of cost of sales. We see limited risk from related-party transactions. | |
| E | Materials sourcing & efficiency | 2 | Voltronic offers professional ODM design and manufacturing of power converters (also known as inverters), automatic voltage regulators (AVRs), and solar inverters. Raw materials for producing inverters include batteries, transformers, plastic materials, steel cases, etc, which account for 50% of the cost of total materials. Apart from the raw materials, Voltronic also purchases green packaging materials, including corrugated paper, cardboard, cartons, etc. According to Voltronic's CSR report, the proportion of spending on local suppliers is above 80%, while its Taiwan region's procurement is mainly for services procurement and the China region's procurement is mainly for raw materials. Voltronic achieves 100% raw materials that comply with the requirements of EU Restriction of Hazardous Substances (RoHS) directive and the requirements of EU Registration, Evaluation, Authorization, and Restriction of Chemicals (REACH) Act on SVHC-substances. To avoid the risk of raw material purchasing, Voltronic has established the Zhongshan plant to produce some raw materials by itself and selects suppliers that can cooperate with the emergency supply of some raw materials. As for the risk of rising material costs, the company targets to to increase selling prices. |
| E | Product design & lifecycle management | 2 | In accordance with the requirements of the EU WEEE directive, Voltronic participates in product recycling and scrap assessment at the design stage. After the end of life of Voltronic's products, the reuse rate is over 80% and the recycling rate is over 70%. Internally, Voltronic has "Design Management Guidelines" when considering a new product design and development. |
| E | Product quality & safety | 2 | For discussion on Voltronic's product quality and safety, we have less relevant information than other listed companies. Voltronic mentioned it has internal standards of "Quality & Environment Manual" and has passed the Quality Management System ISO 9001 to control product quality. According to its 2019 CSR report, Voltronic has not seen any non-compliance incident up to now that has impacted health and safety during their lifecycles. |
Note: Management score represents a company's ability to manage/benefit from certain ESG topics. The scores range from 1 to 3, with 1 being the strongest.
Update Date: 8 May 2026
Source: Daiwa, Company
Voltronic Power Technology (6409 TT): 10 August 2026
Daiwa