PDF 原檔:報告_Daiwa_建準2421_20260807_original.pdf
圖片清單(已驗證 2026-08-10)
| 檔名 | size | 分類 | 親眼所見內容 |
|---|---|---|---|
報告_Daiwa_建準2421_20260807_002.png |
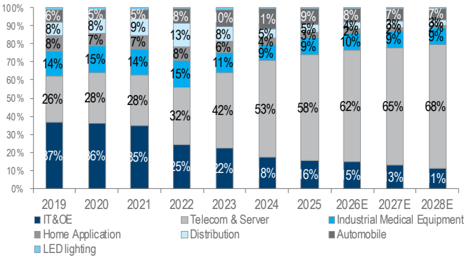
62KB | 真資料圖 | 產品營收結構堆疊長條圖,橫軸 2019~2028E,區分 IT&OE/Telecom & Server/Industrial Medical Equipment/Home Application/Distribution/Automobile/LED lighting 各佔比;Telecom & Server 佔比逐年攀升(2019 年 26% → 2028E 約 68%),IT&OE 佔比逐年下滑(2019 年 37% → 2028E 約 1%) |
報告_Daiwa_建準2421_20260807_003.png |
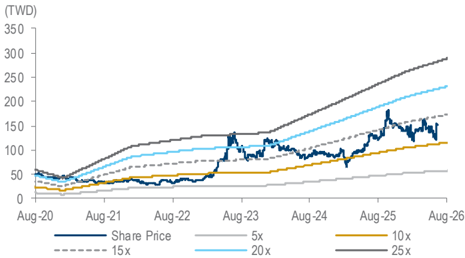
40KB | 真資料圖 | 12個月 forward PER 帶狀圖,橫軸 Aug-20 至 Aug-26,股價線疊加 5x/10x/15x/20x/25x 本益比軌道;近期股價落於約 15x-20x 區間並持續上揚 |
_001.png(30KB,Share price performance)<40KB 未 Read,依規則預設 logo/裝飾圖,不列入。
原始內容
Taiwan
Taiwan
Sunonwealth Electric Machine Industry (2421 TT)
5
Daiwa
2
1
Buy
→
Helen Chien
Helen Chien (886) 2 8758 6254 helen.chien@daiwacm-cathay.com.tw
Neil Teng, CFA (886) 2 8758 6256 neil.teng@daiwacm-cathay.com.tw
Forecast revisions (%)
| Year to 31 Dec | 26E | 27E | 28E |
|---|---|---|---|
| Revenue change | 5.9 | 6 | 6 |
| Net profit change | 8.1 | 6.5 | 6.4 |
| Core EPS (FD) change | 4.8 | 2.2 | 2.2 |
Source: Daiwa forecasts
Share price performance
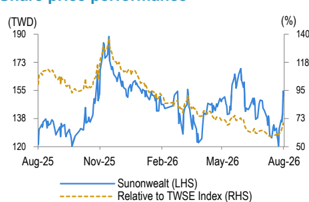
| 12-month range | 120.35-188.48 |
|---|---|
| Market cap (USDbn) | 1.29 |
| 3m avg daily turnover (USDm) | 20.69 |
| Shares outstanding (m) | 273 |
| Major shareholder | Hung family (33.0%) |
Financial summary (TWD)
| Year to 31 Dec | 26E | 27E | 28E |
|---|---|---|---|
| Revenue (m) | 22,678 | 25,773 | 29,453 |
| Operating profit (m) | 3,628 | 4,330 | 5,066 |
| Net profit (m) | 2,965 | 3,500 | 4,069 |
| Core EPS (fully-diluted) | 10.445 | 12.222 | 14.212 |
| EPS change (%) | 31.8 | 17.0 | 16.3 |
| Daiwa vs Cons. EPS (%) | (0.1) | 0.4 | 2.2 |
| PER (x) | 14.5 | 12.4 | 10.7 |
| Dividend yield (%) | 4.8 | 5.7 | 6.6 |
| DPS | 7.3 | 8.6 | 10.0 |
| PBR (x) | 4.2 | 3.7 | 3.2 |
| EV/EBITDA (x) | 9.6 | 7.9 | 6.7 |
| ROE (%) | 30.9 | 31.8 | 32.4 |
Source: FactSet, Daiwa forecasts
Target price:
TWD205.00 (from TWD200.00)
Share price (7 Aug): TWD151.50 | Up/downside: +35.3%
2Q26 results review: largely in line with estimates
- 2Q26 net profit in line with estimates; July revenue ahead of estimates
- Strong 2026 outlook, driven by telecom, server, and industrial
- Reaffirming our Buy (1) call; raising our 12-month TP to TWD205
What's new: Sunon posted its 2Q26 results today (7 August). We reaffirm our Buy (1) call as we expect the outlook for its telecom, servers, and industrial segments in 2026 to remain intact with both gross and operating margin set to expand.
What's the impact: 2Q26 results largely in line with estimates; recordhigh monthly revenue in July. Sunon's 2Q26 revenue of TWD5,419m (+8.0% QoQ and +16.2% YoY) was in line with our and the consensus estimates. Its 2Q26 gross margin came in at 31.3% (vs. 31.7% in 1Q26 and 30.5% in 2Q25), slightly missing our and the consensus estimates of 31.8% due to rising raw material costs. Therefore, its operating profit of TWD836m (+6.1% QoQ and +16.9% YoY) missed our and the consensus estimates by 6.4% and 6.7%, respectively, after factoring in higher-than-expected admin. expenses. Its operating margin of 15.4% (vs. 15.7% in 1Q26 and 15.3% in 2Q25) also missed our estimate of 16.6% and the consensus estimate of 16.5%. With some non-op gains, its net profit of TWD690m (+6.3% QoQ and +84.5% YoY) was largely in line with our and the consensus estimates. Its 2Q26 EPS finished at TWD2.42, also largely in line with our (TWD2.39) estimate and the consensus (TWD2.49) estimates. On 5 August, Sunon reported a record-high monthly revenue for July of TWD2,119m (+14.2% QoQ, +31.7% YoY; +20.3% YoY for 7M26), accounting for 37.8% and 36.4% of our previous and the consensus estimates, mainly due to the shipments of ASIC projects.
Solid revenue momentum likely to continue into 2H26. For 2H26, we expect its revenue to grow QoQ in light of ASIC projects that are expected to be launched. For its liquid cooling revenue, Sunon expects a singledigit % revenue contribution in 2026, and intends to tap into enterprise, GPU, and ASIC clients. We raise our 2026-28E EPS by 2-5%, mainly on higher revenue assumptions.
What we recommend: We reaffirm our Buy (1) call and raise our 12M TP to TWD205 (from TWD200), now based on a target PER of 17x applied to our 1-year forward EPS forecast. Still around the midpoint of its past-5-year range of 7-25x, the target PER is slightly lower than 18x previously as we now forecast a net profit CAGR of 17.2% (previously 18.1%) over 202628E (1x PEG). Downside risks: worse-than-expected gross-margin expansion and AI server development progress.
How we differ: We are one of only two overseas brokers covering the stock. Our 2028E EPS is 2% above the Bloomberg consensus, likely due to our higher revenue estimate.
Sunon: revenue and earnings forecast revisions
| 2026E | 2026E | 2026E | 2027E | 2027E | 2027E | 2028E | 2028E | 2028E | |
|---|---|---|---|---|---|---|---|---|---|
| (TWDm) | New | Previous | Change | New | Previous | Change | New | Previous | Change |
| Sales | 22,678 | 21,407 | 5.9% | 25,773 | 24,320 | 6.0% | 29,453 | 27,784 | 6.0% |
| Gross profit | 7,211 | 6,850 | 5.3% | 8,325 | 7,856 | 6.0% | 9,572 | 9,030 | 6.0% |
| Gross margin | 31.8% | 32.0% | -0.2pp | 32.3% | 32.3% | 0pp | 32.5% | 32.5% | 0pp |
| Operating profit | 3,628 | 3,468 | 4.6% | 4,330 | 4,086 | 6.0% | 5,066 | 4,779 | 6.0% |
| Operating margin | 16.0% | 16.2% | -0.2pp | 16.8% | 16.8% | 0pp | 17.2% | 17.2% | 0pp |
| Net profit | 2,965 | 2,742 | 8.1% | 3,500 | 3,287 | 6.5% | 4,069 | 3,824 | 6.4% |
| Net margin | 13.1% | 12.8% | 0.3pp | 13.6% | 13.5% | 0.1pp | 13.8% | 13.8% | 0.1pp |
| Fully diluted EPS (TWD) | 10.45 | 9.97 | 4.8% | 12.22 | 11.95 | 2.2% | 14.21 | 13.90 | 2.2% |
Source: Daiwa forecasts
Sunon: 2Q26 results review
| (TWDm) | Sunon's 2Q26 results | Our previous forecast | Differ | Bloomberg consensus | Differ |
|---|---|---|---|---|---|
| Revenue | 5,419 | 5,371 | 0.9% | 5,437 | -0.3% |
| Gross profit | 1,693 | 1,708 | -0.9% | 1,727 | -2.0% |
| Operating profit | 836 | 893 | -6.4% | 896 | -6.7% |
| Profit before tax | 912 | 912 | 0.0% | 929 | -1.8% |
| Net profit | 690 | 657 | 5.1% | 683 | 1.0% |
| EPS | 2.42 | 2.39 | 1.3% | 2.49 | -2.6% |
| Margin | |||||
| Gross margin | 31.3% | 31.8% | -0.5pp | 31.8% | -0.5pp |
| Operating margin | 15.4% | 16.6% | -1.2pp | 16.5% | -1.1pp |
| Pre-tax margin | 16.8% | 17.0% | -0.1pp | 17.1% | -0.2pp |
| Net margin | 12.7% | 12.2% | 0.5pp | 12.6% | 0.2pp |
Source: Company, Bloomberg, Daiwa forecasts
Sunon: quarterly and annual P&L
| 2026E | 2026E | 2026E | 2026E | 2027E | 2027E | 2027E | 2027E | 2026E | 2027E | 2028E | |
|---|---|---|---|---|---|---|---|---|---|---|---|
| (TWDm) | 1Q26 | 2Q26E | 3Q26E | 4Q26E | 1Q27E | 2Q27E | 3Q27E | 4Q27E | |||
| Revenue | 5,019 | 5,419 | 6,119 | 6,120 | 5,700 | 6,500 | 6,600 | 6,973 | 22,678 | 25,773 | 29,453 |
| Gross profit | 1,589 | 1,693 | 1,958 | 1,970 | 1,824 | 2,080 | 2,145 | 2,276 | 7,211 | 8,325 | 9,572 |
| Operating profit | 788 | 836 | 1058 | 946 | 964 | 1170 | 1195 | 1001 | 3,628 | 4,330 | 5,066 |
| Pre-tax profit | 805 | 912 | 1112 | 1000 | 1011 | 1217 | 1242 | 1048 | 3,829 | 4,520 | 5,256 |
| Net profit | 649 | 690 | 868 | 758 | 819 | 925 | 969 | 786 | 2,965 | 3,500 | 4,069 |
| Basic EPS (TWD) | 2.36 | 2.42 | 3.04 | 2.66 | 2.87 | 3.24 | 3.40 | 2.76 | 10.48 | 12.27 | 14.27 |
| Margin | |||||||||||
| Gross margin | 31.7% | 31.3% | 32.0% | 32.2% | 32.0% | 32.0% | 32.5% | 32.6% | 31.8% | 32.3% | 32.5% |
| Operating margin | 15.7% | 15.4% | 17.3% | 15.5% | 16.9% | 18.0% | 18.1% | 14.4% | 16.0% | 16.8% | 17.2% |
| Pre-tax margin | 16.0% | 16.8% | 18.2% | 16.3% | 17.7% | 18.7% | 18.8% | 15.0% | 16.9% | 17.5% | 17.8% |
| Net margin | 12.9% | 12.7% | 14.2% | 12.4% | 14.4% | 14.2% | 14.7% | 11.3% | 13.1% | 13.6% | 13.8% |
| YoY | |||||||||||
| Revenue | 20.6% | 16.2% | 24.0% | 24.4% | 13.6% | 20.0% | 7.9% | 13.9% | 21.4% | 13.7% | 14.3% |
| Gross profit | 30.5% | 18.9% | 26.7% | 22.1% | 14.8% | 22.8% | 9.5% | 15.5% | 24.3% | 15.4% | 15.0% |
| Operating profit | 52.9% | 16.9% | 37.7% | 16.8% | 22.3% | 39.9% | 12.9% | 5.8% | 29.2% | 19.3% | 17.0% |
| Pre-tax profit | 38.7% | 76.5% | 23.8% | 24.8% | 25.7% | 33.4% | 11.7% | 4.9% | 36.9% | 18.0% | 16.3% |
| Net profit | 37.5% | 84.5% | 25.0% | 21.3% | 26.2% | 34.1% | 11.7% | 3.6% | 36.9% | 18.0% | 16.3% |
| QoQ | |||||||||||
| Revenue | 2.1% | 8.0% | 12.9% | 0.0% | -6.9% | 14.0% | 1.5% | 5.7% | |||
| Gross profit | -1.5% | 6.5% | 15.6% | 0.6% | -7.4% | 14.0% | 3.1% | 6.1% | |||
| Operating profit | -2.7% | 6.1% | 26.6% | -10.6% | 1.9% | 21.4% | 2.1% | -16.2% | |||
| Pre-tax profit | 0.4% | 13.4% | 21.9% | -10.1% | 1.2% | 20.4% | 2.1% | -15.6% | |||
| Net profit | 3.8% | 6.3% | 25.7% | -12.6% | 8.0% | 12.9% | 4.7% | -18.9% |
Source: Company, Daiwa forecasts
Sunon: product mix
Source: Company, Daiwa forecasts
Sunonwealth Electric Machine Industry (2421 TT): 7 August 2026
Sunon: 1-year forward PER
Source: Bloomberg, Daiwa forecasts
Daiwa
Financial summary
Key assumptions
| Year to 31 Dec | 2021 | 2022 | 2023 | 2024 | 2025 | 2026E | 2027E | 2028E |
|---|---|---|---|---|---|---|---|---|
| Automotive revenue YoY growth (%) | 6.1 | 59.5 | 9.1 | 31.1 | 2.8 | 5 | 5 | 5 |
| IT&OE revenue YoY growth (%) | 2.3 | (26.8) | (16.8) | (10.7) | 13.8 | 15 | 0 | 0 |
| Telecom & server revenue YoY growth (%) | 6.5 | 16.2 | 21.4 | 43.5 | 40.4 | 28 | 20 | 20 |
Profit and loss (TWDm)
| Year to 31 Dec | 2021 | 2022 | 2023 | 2024 | 2025 | 2026E | 2027E | 2028E |
|---|---|---|---|---|---|---|---|---|
| Telecom & Server revenue | 3,838 | 4,458 | 5,411 | 7,765 | 10,901 | 13,954 | 16,744 | 20,093 |
| Industrial & Medical equipment & Automobile revenue | 2,645 | 3,178 | 2,686 | 2,910 | 3,400 | 3,919 | 4,224 | 4,555 |
| Other Revenue | 7,079 | 6,427 | 4,817 | 3,948 | 4,377 | 4,805 | 4,805 | 4,805 |
| Total Revenue | 13,562 | 14,063 | 12,915 | 14,624 | 18,678 | 22,678 | 25,773 | 29,453 |
| Other income | 0 | 0 | 0 | 0 | 0 | 0 | 0 | 0 |
| COGS | (11,026) | (10,892) | (9,313) | (10,467) | (12,876) | (15,466) | (17,449) | (19,881) |
| SG&A | (1,258) | (1,268) | (1,272) | (1,587) | (1,910) | (2,268) | (2,526) | (2,857) |
| Other op.expenses | (814) | (781) | (799) | (893) | (1,082) | (1,315) | (1,469) | (1,649) |
| Operating profit | 464 | 1,122 | 1,530 | 1,677 | 2,809 | 3,628 | 4,330 | 5,066 |
| Net-interest inc./(exp.) | (14) | (30) | 49 | 95 | 71 | 97 | 90 | 90 |
| Assoc/forex/extraord./others | 136 | 334 | 172 | 210 | (83) | 104 | 100 | 100 |
| Pre-tax profit | 585 | 1,426 | 1,752 | 1,982 | 2,797 | 3,829 | 4,520 | 5,256 |
| Tax | (156) | (337) | (418) | (490) | (631) | (864) | (1,020) | (1,186) |
| Min. int./pref. div./others | 0 | 0 | 0 | 0 | 0 | 0 | 0 | 0 |
| Net profit (reported) | 429 | 1,089 | 1,334 | 1,492 | 2,165 | 2,965 | 3,500 | 4,069 |
| Net profit (adjusted) | 429 | 1,089 | 1,334 | 1,492 | 2,165 | 2,965 | 3,500 | 4,069 |
| EPS (reported)(TWD) | 1.711 | 4.340 | 5.163 | 5.457 | 7.937 | 10.484 | 12.272 | 14.270 |
| EPS (adjusted)(TWD) | 1.711 | 4.340 | 5.163 | 5.457 | 7.937 | 10.484 | 12.272 | 14.270 |
| EPS (adjusted fully-diluted)(TWD) | 1.711 | 4.327 | 5.074 | 5.448 | 7.924 | 10.445 | 12.222 | 14.212 |
| DPS (TWD) | 1.200 | 2.600 | 3.500 | 3.687 | 5.442 | 7.265 | 8.575 | 9.971 |
| EBIT | 464 | 1,122 | 1,530 | 1,677 | 2,809 | 3,628 | 4,330 | 5,066 |
| EBITDA | 981 | 1,635 | 2,065 | 2,171 | 3,359 | 3,969 | 4,747 | 5,544 |
Cash flow (TWDm)
| Year to 31 Dec | 2021 | 2022 | 2023 | 2024 | 2025 | 2026E | 2027E | 2028E |
|---|---|---|---|---|---|---|---|---|
| Profit before tax | 585 | 1,426 | 1,752 | 1,982 | 2,797 | 3,829 | 4,520 | 5,256 |
| Depreciation and amortisation | 517 | 513 | 534 | 495 | 550 | 341 | 417 | 478 |
| Tax paid | (156) | (337) | (418) | (490) | (631) | (864) | (1,020) | (1,186) |
| Change in working capital | (874) | 292 | 387 | (465) | (254) | (846) | (379) | (765) |
| Other operational CF items | 118 | 264 | (81) | 160 | 836 | (92) | (90) | (90) |
| Cash flow from operations | 191 | 2,158 | 2,175 | 1,682 | 3,297 | 2,367 | 3,448 | 3,693 |
| Capex | (444) | (394) | (298) | (513) | (953) | (1,500) | (1,000) | (1,000) |
| Net (acquisitions)/disposals | 178 | 0 | (14) | (2) | (29) | (29) | (29) | (29) |
| Other investing CF items | (215) | (44) | (43) | (229) | (132) | 0 | 0 | 0 |
| Cash flow from investing | (480) | (438) | (354) | (745) | (1,114) | (1,529) | (1,029) | (1,029) |
| Change in debt | 1,279 | (662) | (830) | 470 | (458) | 117 | 0 | 0 |
| Net share issues/(repurchases) | 0 | 0 | 0 | 0 | 0 | 0 | 0 | 0 |
| Dividends paid | (602) | (301) | (652) | (957) | (1,012) | (1,499) | (2,055) | (2,425) |
| Other financing CF items | (91) | (226) | 1,274 | 77 | (49) | 0 | 0 | 0 |
| Cash flow from financing | 585 | (1,189) | (208) | (410) | (1,519) | (1,382) | (2,055) | (2,425) |
| Forex effect/others | 0 | 0 | 0 | 0 | 0 | 0 | 0 | 0 |
| Change in cash | 296 | 531 | 1,612 | 527 | 664 | (544) | 364 | 239 |
| Free cash flow | (253) | 1,764 | 1,877 | 1,169 | 2,344 | 867 | 2,448 | 2,693 |
Source: FactSet, Daiwa forecasts
Sunonwealth Electric Machine Industry (2421 TT): 7 August 2026
Daiwa
Financial summary continued …
Balance sheet (TWDm)
| Year to 31 Dec | 2021 | 2022 | 2023 | 2024 | 2025 | 2026E | 2027E | 2028E |
|---|---|---|---|---|---|---|---|---|
| Cash & short-term investment | 1,912 | 2,457 | 4,031 | 4,678 | 5,256 | 4,762 | 5,249 | 5,610 |
| Inventory | 2,763 | 2,863 | 2,052 | 2,181 | 2,424 | 3,067 | 3,372 | 3,893 |
| Accounts receivable | 3,546 | 3,555 | 3,180 | 4,247 | 5,413 | 6,349 | 7,207 | 8,241 |
| Other current assets | 169 | 150 | 313 | 332 | 100 | 100 | 100 | 100 |
| Total current assets | 8,391 | 9,026 | 9,576 | 11,438 | 13,193 | 14,278 | 15,929 | 17,844 |
| Fixed assets | 2,059 | 2,273 | 2,171 | 2,461 | 3,054 | 4,213 | 4,796 | 5,318 |
| Goodwill & intangibles | 24 | 27 | 24 | 53 | 63 | 63 | 63 | 63 |
| Other non-current assets | 1,043 | 866 | 843 | 1,046 | 1,117 | 1,117 | 1,117 | 1,117 |
| Total assets | 11,517 | 12,192 | 12,615 | 14,998 | 17,427 | 19,671 | 21,904 | 24,341 |
| Short-term debt | 1,985 | 1,408 | 640 | 1,050 | 586 | 703 | 703 | 703 |
| Accounts payable | 3,986 | 4,530 | 3,846 | 4,759 | 6,174 | 6,907 | 7,692 | 8,481 |
| Other current liabilities | 268 | 385 | 235 | 273 | 429 | 429 | 429 | 429 |
| Total current liabilities | 6,239 | 6,323 | 4,721 | 6,082 | 7,189 | 8,038 | 8,823 | 9,612 |
| Long-term debt | 524 | 287 | 213 | 478 | 613 | 613 | 613 | 613 |
| Other non-current liabilities | 387 | 380 | 462 | 517 | 738 | 738 | 738 | 738 |
| Total liabilities | 7,151 | 6,989 | 5,396 | 7,078 | 8,539 | 9,389 | 10,174 | 10,962 |
| Share capital | 2,509 | 2,509 | 2,734 | 2,734 | 2,734 | 2,828 | 2,828 | 2,828 |
| Reserves/R.E./others | 1,857 | 2,693 | 4,484 | 5,186 | 6,153 | 7,454 | 8,903 | 10,551 |
| Shareholders' equity | 4,367 | 5,202 | 7,219 | 7,920 | 8,887 | 10,282 | 11,731 | 13,379 |
| Minority interests | 0 | 0 | 0 | 0 | 0 | 0 | 0 | 0 |
| Total equity & liabilities | 11,517 | 12,192 | 12,615 | 14,998 | 17,427 | 19,671 | 21,904 | 24,341 |
| EV | 42,024 | 40,664 | 38,249 | 38,277 | 37,369 | 37,980 | 37,493 | 37,131 |
| Net debt/(cash) | 597 | (763) | (3,178) | (3,150) | (4,058) | (3,447) | (3,934) | (4,295) |
| BVPS (TWD) | 17.402 | 20.733 | 26.399 | 28.859 | 32.265 | 36.355 | 41.477 | 47.305 |
Key ratios (%)
| Year to 31 Dec | 2021 | 2022 | 2023 | 2024 | 2025 | 2026E | 2027E | 2028E |
|---|---|---|---|---|---|---|---|---|
| Sales (YoY) | 6.1 | 3.7 | (8.2) | 13.2 | 27.7 | 21.4 | 13.7 | 14.3 |
| EBITDA (YoY) | (37.3) | 66.6 | 26.3 | 5.2 | 54.7 | 18.2 | 19.6 | 16.8 |
| Operating profit (YoY) | (58.4) | 142.0 | 36.4 | 9.6 | 67.5 | 29.2 | 19.3 | 17.0 |
| Net profit (YoY) | (49.6) | 153.7 | 22.5 | 11.9 | 45.1 | 36.9 | 18.0 | 16.3 |
| Core EPS (fully-diluted) (YoY) | (49.6) | 153.0 | 17.3 | 7.4 | 45.5 | 31.8 | 17.0 | 16.3 |
| Gross-profit margin | 18.7 | 22.5 | 27.9 | 28.4 | 31.1 | 31.8 | 32.3 | 32.5 |
| EBITDA margin | 7.2 | 11.6 | 16.0 | 14.8 | 18.0 | 17.5 | 18.4 | 18.8 |
| Operating-profit margin | 3.4 | 8.0 | 11.8 | 11.5 | 15.0 | 16.0 | 16.8 | 17.2 |
| Net profit margin | 3.2 | 7.7 | 10.3 | 10.2 | 11.6 | 13.1 | 13.6 | 13.8 |
| ROAE | 9.6 | 22.8 | 21.5 | 19.7 | 25.8 | 30.9 | 31.8 | 32.4 |
| ROAA | 3.9 | 9.2 | 10.8 | 10.8 | 13.4 | 16.0 | 16.8 | 17.6 |
| ROCE | 7.3 | 16.3 | 20.4 | 19.1 | 28.8 | 33.5 | 35.1 | 36.5 |
| ROIC | 7.4 | 18.2 | 27.5 | 28.7 | 45.3 | 48.2 | 45.8 | 46.5 |
| Net debt to equity | 13.7 | n.a. | n.a. | n.a. | n.a. | n.a. | n.a. | n.a. |
| Effective tax rate | 26.7 | 23.6 | 23.8 | 24.7 | 22.6 | 22.6 | 22.6 | 22.6 |
| Accounts receivable (days) | 92.9 | 92.1 | 95.2 | 92.7 | 94.4 | 94.6 | 96.0 | 95.7 |
| Current ratio (x) | 1.3 | 1.4 | 2.0 | 1.9 | 1.8 | 1.8 | 1.8 | 1.9 |
| Net interest cover (x) | 32.6 | 37.6 | n.a. | n.a. | n.a. | n.a. | n.a. | n.a. |
| Net dividend payout | 70.1 | 59.9 | 67.8 | 67.6 | 68.6 | 69.3 | 69.9 | 69.9 |
| Free cash flow yield | n.a. | 4.3 | 4.5 | 2.8 | 5.7 | 2.1 | 5.9 | 6.5 |
Source: FactSet, Daiwa forecasts
Company profile
Founded in 1980 and listed on Taiwan's main board in 2000, Sunonwealth Electric Machine Industry (Sunon) is one of the top-4 fan and motor providers in the world, along with Delta Electronics, Nidec and ebm-papst. Its major clients are Apple, Dell, Lenovo, Bosch, Siemens and Tesla. Its applications include IT & OE, telecoms & servers, industrial & medical equipment, home applications, distribution, autos and LED lighting.
Sunonwealth Electric Machine Industry (2421 TT): 7 August 2026
Daiwa
Sunonwealth Electric Machine Industry (2421 TT): 7 August 2026
ESG analysis
ESG risks
| Risks | Risks | Management | Analyst comments |
|---|---|---|---|
| G | Executive/board quality | 2 | The CEO and chairperson of Sunonwealth are the same individual; Sunonwealth's board is led by the Hung family. We see no issues with the company's board. We view the chairman leading the R&D team as a sign of the company's continuing focus on developing new products to achieve a long-term competitive advantage. |
| G | Capital management | 2 | Sunonwealth's dividend payout ratio was 83-88% in 2015-18, but it decreased to 60-69% during 2022-25 due to its capacity expansion plans. |
| G | Related party & transaction | 2 | Revenue generated from related-party transactions was less than 1% of total revenue during 2023-25. |
| E | Materials sourcing & efficiency | 1 | Sunonwealth's sourcing of raw materials has been relatively stable (including IC, copper, plastic, aluminium and steel), and we also note that Sunonwealth abides by RoHS regulations and relevant international standards (ISO14001, IECQ QC080000, ISO9001) for its material sourcing activities. With the ongoing ESG trend, its clients may move towards a more energy-efficient production cycle, which will likely benefit Sunonwealth's energy-efficient products. |
| E | Product design & lifecycle management | 2 | Sunonwealth has improved its product designs to stronger but lighter form factors. Besides, we have observed more green projects utilising Sunonwealth's capabilities. Thus, we believe Sunonwealth has strong product design and lifecycle management capabilities to address the ongoing changing business environment. |
| S | Product quality & safety | 2 | Sunonwealth has its own Quality Strategy Centre to evaluate quality issues. With international standards in place, we believe Sunonwealth has taken relevant measures to address product quality and safety issues. |
Note: Management score represents a company's ability to manage/benefit from certain ESG topics. The scores range from 1 to 3, with 1 being the strongest.
Update Date: 8 May 2026
Source: Daiwa, Company
Daiwa