PDF 原檔:報告_Daiwa_台燿6274_20260727_original.pdf
圖片清單(已驗證 2026-07-28)
Step 2.5 眼見為憑索引,是 lib/ 嵌圖的唯一真相來源。只挑分類為「真資料圖」且已逐張 Read 者嵌入,圖說照抄「親眼所見內容」。
| 檔名 | size | 分類 | 親眼所見內容 |
|---|---|---|---|
報告_Daiwa_台燿6274_20260727_001.png |
23KB | 裝飾·logo·banner | Daiwa 報告頁首股價走勢縮圖,未達 40KB 未逐張 Read |
報告_Daiwa_台燿6274_20260727_002.png |
19KB | 裝飾·logo·banner | 同上,頁首相對表現縮圖 |
報告_Daiwa_台燿6274_20260727_003.png |
28KB | 真資料圖(未逐張 Read) | Exhibit:TUC 1-year-forward PER bands,依報告章節標題判定 |
報告_Daiwa_台燿6274_20260727_004.png |
26KB | 真資料圖(未逐張 Read) | Exhibit:TUC revenue breakdown by product,依報告章節標題判定 |
本份 4 張圖全部 <40KB,依 Step 2.5 規則未逐張 Read,以報告章節標題做範圍性驗證;未嵌入 lib 頁。
原始內容
Taiwan
Taiwan Union Technology Corp (6274 TT)
Target price:
TWD2,320.00 (from TWD2,122.00)
Share price (27 Jul):
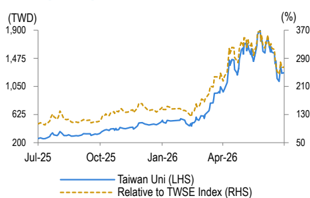
TWD1,255.00 | Up/downside: +84.9%
2Q26 preview: intact growth story
- Decent margin expansion on significant price hike in 2Q26
- High-end CCL capacity shortage and spec upgrade key growth drivers
- Reaffirming our Buy (1) rating and lifting 12M TP to TWD2,320
What's new: We provide our latest view on TUC before its 2Q26 results.
What's the impact: 2Q26 results preview and 2H26 outlook . Based on both TUC and its key competitor's preliminary pre-tax announcement and 2Q26 sales number, we estimate the blended ASP hike on CCL to reach c.30% to pass through the additional raw materials cost hike since 2H25. With the higher ASP from CCL from 2Q26, we estimate CCL vendors' GM to increase 4-5pp in 2Q26. As such, we now expect TUC's GM to expand to 29.5% in 2Q26 (vs. 25.1% in 1Q26). Hence, our new 2Q26E operating profit comes in at TWD3.25bn, 13% higher than our prior estimate. Looking ahead, we forecast 3Q26 and 4Q26 sales to grow by 22%/10% QoQ, respectively, on gradual new capacity ramp-up in Thailand from mid-August (0.3m CCL sheets per month with total capacity reaching 2.6m per month). We expect new capacity to be mainly adopted by Trainium 3, which we expect to be the key driver for growth during 2H26 and on a QoQ basis in 4Q26 due to new capacity not fully operational for the entire 3Q26. In terms of the 300k CCL sheets per month and potential product optimisation, we expect TUC to acquire 20-30% market share within Trainium 3 AI server.
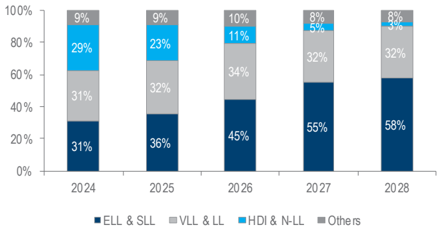
Long-term outlook. While we expect the high-end CCL capacity shortage to continue until 2027 with the incremental new supply coming from product optimisation (capacity shift from the low to high end), we expect TUC to deliver an additional 600k CCL per month from 2H27E, which would deliver c.20% unit growth in 2027E. On top of this, we expect ongoing spec upgrades to drive c.30% ASP hike every generation, and we still expect TUC to continuously to optimise its product mix, which would drive an additional c.10% blended price increase by 2027. Lastly, we expect another c.10% price hike for products due mainly to raw material cost inflation. In all, we expect these factors to lead to 87% YoY revenue growth in 2027E. For 2028E, while TUC hasn't finalised its capacity plan yet (likely to be 2 nd phase of plant 2 in Thailand with additional 0.9m CCL sheets per month), we expect c.20% CCL sheet capacity YoY growth along with 30% ASP hike on spec upgrades. We highlight that additional cost inflation and product optimisation haven't been factored into our 2028E forecasts.
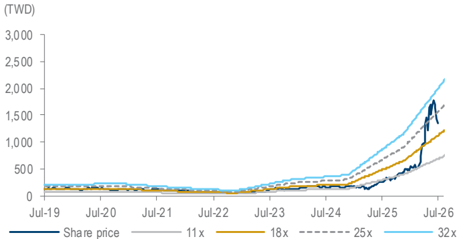
What we recommend: We raise our 2026-28E EPS by 12-38% to reflect higher ASPs and a better product mix. We reaffirm our Buy (1) call and lift our 12M TP to TWD2,320 (from TWD2,122), based on a lower target PER of 35x (prior: 48x) applied to our 4Q26-3Q27E EPS (from 2H26-1H27E), on earnings growth deceleration. Downside risks: 1) weaker-than-expected demand for switches/AI servers, and 2) market share loss to CCL peers.
How we differ: Our 2026-28E EPS are 7-26% above the Bloomberg consensus, likely on our higher revenue growth.
27 July 2026
Daiwa
5
3
→
2
1
Buy
Sheng Cheng
(886) 2 8758 6253
sheng.cheng@daiwacm-cathay.com.tw
Allan Wang
(886) 2 8758 6249 allan.wang@daiwacm-cathay.com.tw
Forecast revisions (%)
| Year to 31 Dec | 26E | 27E | 28E |
|---|---|---|---|
| Revenue change | 1.5 | 14.3 | 15.7 |
| Net profit change | 12.4 | 33.1 | 38.1 |
| Core EPS (FD) change | 12.4 | 33.1 | 38.1 |
Source: Daiwa forecasts
Share price performance
| 12-month range | 253.50-1,900.00 |
|---|---|
| Market cap (USDbn) | 11.18 |
| 3m avg daily turnover (USDm) | 278.47 |
| Shares outstanding (m) | 289 |
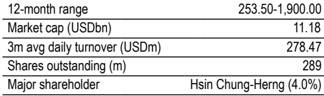
| Major shareholder | Hsin Chung-Herng (4.0%) |
Financial summary (TWD)
| Year to 31 Dec | 26E | 27E | 28E |
|---|---|---|---|
| Revenue (m) | 60,950 | 113,868 | 170,992 |
| Operating profit (m) | 14,272 | 31,250 | 50,532 |
| Net profit (m) | 10,494 | 23,146 | 37,417 |
| Core EPS (fully-diluted) | 36.312 | 80.091 | 129.471 |
| EPS change (%) | 196.4 | 120.6 | 61.7 |
| Daiwa vs Cons. EPS (%) | 7.3 | 25.5 | 9.4 |
| PER (x) | 34.6 | 15.7 | 9.7 |
| Dividend yield (%) | 2.0 | 4.5 | 7.2 |
| DPS | 25.4 | 56.1 | 90.6 |
| PBR (x) | 14.3 | 8.7 | 5.7 |
| EV/EBITDA (x) | 24.6 | 11.6 | 7.1 |
| ROE (%) | 47.7 | 69.1 | 71.4 |
Source: FactSet, Daiwa forecasts
TUC: Daiwa's revenue and earnings forecast revisions
| 2026E | 2026E | 2026E | 2027E | 2027E | 2027E | 2028E | 2028E | 2028E | |
|---|---|---|---|---|---|---|---|---|---|
| (TWDm) | Previous | New | Consensus | Previous | New | Consensus | Previous | New | Consensus |
| Revenue | 60,034 | 60,950 | 58,344 | 99,614 | 113,868 | 94,347 | 147,736 | 170,992 | 156,700 |
| Diff (%) | 1.5% | 4.5% | 14.3% | 20.7% | 15.7% | 9.1% | |||
| Gross margin (%) | 28.1% | 30.2% | 28.0% | 30.5% | 33.7% | 30.5% | 31.7% | 35.0% | 31.9% |
| Operating profit | 12,709 | 14,272 | 12,900 | 23,468 | 31,250 | 24,365 | 36,576 | 50,532 | 44,286 |
| Operating margin (%) | 21.2% | 23.4% | 22.1% | 23.6% | 27.4% | 25.8% | 24.8% | 29.6% | 28.3% |
| Net profit | 9,337 | 10,494 | 9,778 | 17,388 | 23,146 | 18,443 | 27,090 | 37,417 | 34,194 |
| EPS (TWD) | 32.31 | 36.31 | 33.83 | 60.17 | 80.09 | 63.82 | 93.74 | 129.47 | 118.32 |
| Diff (%) | 12.4% | 7.3% | 33.1% | 25.5% | 38.1% | 9.4% |
Source: Daiwa forecasts, Bloomberg
TUC: quarterly and annual P&L statement
| 2026E | 2026E | 2026E | 2026E | 2027E | 2027E | 2027E | 2027E | 2025 | 2026E | 2027E | 2028E | |
|---|---|---|---|---|---|---|---|---|---|---|---|---|
| (TWDm) | 1Q | 2QE | 3QE | 4QE | 1QE | 2QE | 3QE | 4QE | ||||
| Net revenue | 10,054 | 14,300 | 17,391 | 19,205 | 21,732 | 24,431 | 31,068 | 36,638 | 30,340 | 60,950 | 113,868 | 170,992 |
| COGS | -7,525 | -10,082 | -11,922 | -13,041 | -14,573 | -16,270 | -20,523 | -24,152 | -23,442 | -42,571 | -75,518 | -111,134 |
| Gross profit | 2,529 | 4,218 | 5,469 | 6,163 | 7,158 | 8,160 | 10,545 | 12,487 | 6,898 | 18,379 | 38,350 | 59,859 |
| Operating expenses | -701 | -972 | -1,165 | -1,267 | -1,413 | -1,564 | -1,926 | -2,198 | -2,554 | -4,106 | -7,101 | -9,327 |
| Operating profit | 1,828 | 3,246 | 4,303 | 4,896 | 5,746 | 6,597 | 8,619 | 10,288 | 4,344 | 14,272 | 31,250 | 50,532 |
| Non-operating profit | 46 | 13 | 11 | 10 | 9 | 8 | 6 | 7 | 175 | 80 | 30 | 32 |
| Pre-tax profit | 1,874 | 3,259 | 4,315 | 4,905 | 5,755 | 6,604 | 8,625 | 10,295 | 4,519 | 14,352 | 31,279 | 50,564 |
| Net profit | 1,260 | 2,411 | 3,193 | 3,630 | 4,258 | 4,887 | 6,383 | 7,618 | 3,409 | 10,494 | 23,146 | 37,417 |
| Net EPS (TWD) | 4.36 | 8.34 | 11.05 | 12.56 | 14.73 | 16.91 | 22.08 | 26.36 | 12.1 | 36.3 | 80.1 | 129.5 |
| Operating Ratios | ||||||||||||
| Gross margin | 25.1% | 29.5% | 31.4% | 32.1% | 32.9% | 33.4% | 33.9% | 34.1% | 22.7% | 30.2% | 33.7% | 35.0% |
| Operating margin | 18.2% | 22.7% | 24.7% | 25.5% | 26.4% | 27.0% | 27.7% | 28.1% | 14.3% | 23.4% | 27.4% | 29.6% |
| Pre-tax margin | 18.6% | 22.8% | 24.8% | 25.5% | 26.5% | 27.0% | 27.8% | 28.1% | 14.9% | 23.5% | 27.5% | 29.6% |
| Net margin | 12.5% | 16.9% | 18.4% | 18.9% | 19.6% | 20.0% | 20.5% | 20.8% | 11.2% | 17.2% | 20.3% | 21.9% |
| YoY (%) | ||||||||||||
| Net revenue | 58% | 111% | 116% | 110% | 116% | 71% | 79% | 91% | 32% | 101% | 87% | 50% |
| Gross profit | 65% | 194% | 186% | 206% | 183% | 93% | 93% | 103% | 29% | 166% | 109% | 56% |
| Operating profit | 95% | 281% | 240% | 279% | 214% | 103% | 100% | 110% | 30% | 229% | 119% | 62% |
| Pre-tax profit | 100% | 288% | 227% | 244% | 207% | 103% | 100% | 110% | 34% | 218% | 118% | 62% |
| Net profit | 88% | 270% | 218% | 235% | 238% | 103% | 100% | 110% | 31% | 208% | 121% | 62% |
| QoQ (%) | ||||||||||||
| Net revenue | 10% | 42% | 22% | 10% | 13% | 12% | 27% | 18% | ||||
| Gross profit | 26% | 67% | 30% | 13% | 16% | 14% | 29% | 18% | ||||
| Operating profit | 42% | 78% | 33% | 14% | 17% | 15% | 31% | 19% | ||||
| Pre-tax profit | 31% | 74% | 32% | 14% | 17% | 15% | 31% | 19% | ||||
| Net profit | 16% | 91% | 32% | 14% | 17% | 15% | 31% | 19% |
Source: Company, Daiwa forecasts
TUC: 1-year-forward PER bands
Source: TEJ, Daiwa forecasts
Taiwan Union Technology Corp (6274 TT): 27 July 2026
TUC: revenue breakdown by product
Source: Company, Daiwa forecasts
Daiwa
Financial summary
Key assumptions
| Year to 31 Dec | 2021 | 2022 | 2023 | 2024 | 2025 | 2026E | 2027E | 2028E |
|---|---|---|---|---|---|---|---|---|
| Global PC shipment (mn) | 361 | 301 | 260 | 263 | 287 | 244 | 244 | 244 |
| Regular server shipment (mn) | 14 | 15 | 12 | 14 | 16 | 18 | 22 | 26 |
| Global smartphone shipment (mn) | 1,655 | 1,437 | 1,380 | 1,437 | 1,429 | 1,249 | 1,255 | 1,300 |
Profit and loss (TWDm)
| Year to 31 Dec | 2021 | 2022 | 2023 | 2024 | 2025 | 2026E | 2027E | 2028E |
|---|---|---|---|---|---|---|---|---|
| HSD Low Loss | 9,509 | 8,355 | 8,570 | 14,445 | 20,651 | 48,168 | 99,027 | 153,416 |
| HSD Non Low Loss | 9,932 | 7,174 | 4,885 | 5,241 | 5,582 | 5,371 | 4,428 | 3,751 |
| Other Revenue | 1,691 | 2,944 | 2,547 | 3,385 | 4,108 | 7,410 | 10,413 | 13,825 |
| Total Revenue | 21,132 | 18,472 | 16,003 | 23,070 | 30,340 | 60,950 | 113,868 | 170,992 |
| Other income | 0 | 0 | 0 | 0 | 0 | 0 | 0 | 0 |
| COGS | (16,702) | (15,067) | (12,844) | (17,729) | (23,442) | (42,571) | (75,518) | (111,134) |
| SG&A | (1,786) | (1,597) | (1,422) | (1,668) | (2,039) | (605) | 0 | 0 |
| Other op.expenses | (264) | (311) | (313) | (342) | (515) | (3,501) | (7,101) | (9,327) |
| Operating profit | 2,380 | 1,498 | 1,424 | 3,332 | 4,344 | 14,272 | 31,250 | 50,532 |
| Net-interest inc./(exp.) | (30) | (29) | (27) | (52) | (89) | (116) | (110) | (108) |
| Assoc/forex/extraord./others | 63 | 152 | 153 | 98 | 264 | 196 | 139 | 140 |
| Pre-tax profit | 2,413 | 1,621 | 1,550 | 3,378 | 4,519 | 14,352 | 31,279 | 50,564 |
| Tax | (532) | (360) | (726) | (773) | (1,109) | (3,858) | (8,133) | (13,147) |
| Min. int./pref. div./others | 0 | 0 | 0 | 0 | 0 | 0 | 0 | 0 |
| Net profit (reported) | 1,881 | 1,261 | 823 | 2,604 | 3,409 | 10,494 | 23,146 | 37,417 |
| Net profit (adjusted) | 1,881 | 1,261 | 823 | 2,604 | 3,409 | 10,494 | 23,146 | 37,417 |
| EPS (reported)(TWD) | 7.010 | 4.687 | 3.049 | 9.561 | 12.135 | 36.312 | 80.091 | 129.471 |
| EPS (adjusted)(TWD) | 7.010 | 4.687 | 3.049 | 9.561 | 12.135 | 36.312 | 80.091 | 129.471 |
| EPS (adjusted fully-diluted)(TWD) | 7.014 | 4.687 | 3.052 | 9.573 | 12.250 | 36.312 | 80.091 | 129.471 |
| DPS (TWD) | 5.005 | 4.000 | 4.008 | 6.504 | 8.491 | 25.418 | 56.064 | 90.630 |
| EBIT | 2,380 | 1,498 | 1,424 | 3,332 | 4,344 | 14,272 | 31,250 | 50,532 |
| EBITDA | 2,819 | 1,960 | 1,885 | 3,784 | 4,803 | 14,910 | 31,983 | 51,375 |
Cash flow (TWDm)
| Year to 31 Dec | 2021 | 2022 | 2023 | 2024 | 2025 | 2026E | 2027E | 2028E |
|---|---|---|---|---|---|---|---|---|
| Profit before tax | 2,413 | 1,621 | 1,550 | 3,378 | 4,519 | 14,352 | 31,279 | 50,564 |
| Depreciation and amortisation | 439 | 462 | 461 | 452 | 459 | 638 | 733 | 843 |
| Tax paid | (532) | (360) | (726) | (773) | (1,109) | (3,858) | (8,133) | (13,147) |
| Change in working capital | 4,224 | (3,625) | 1,136 | 5,588 | 13,451 | 24,705 | 56,849 | 38,656 |
| Other operational CF items | (5,033) | 4,227 | (1,300) | (7,967) | (16,724) | (37,755) | (76,310) | (53,563) |
| Cash flow from operations | 1,512 | 2,326 | 1,120 | 677 | 596 | (1,919) | 4,419 | 23,353 |
| Capex | (433) | (381) | (634) | (1,196) | (1,949) | (2,774) | (1,400) | (1,400) |
| Net (acquisitions)/disposals | 0 | 3 | 0 | (9) | 4 | 8 | 6 | 7 |
| Other investing CF items | 1,702 | 1,054 | 389 | 75 | (4,558) | 1,675 | 0 | 0 |
| Cash flow from investing | 1,269 | 677 | (244) | (1,130) | (6,502) | (1,091) | (1,394) | (1,393) |
| Change in debt | (9) | (583) | 531 | (372) | 4,141 | 3,209 | 4,569 | 3,977 |
| Net share issues/(repurchases) | 0 | 0 | 0 | 0 | 0 | 0 | 0 | 0 |
| Dividends paid | (2,574) | (2,694) | (2,153) | (2,180) | (3,594) | (2,454) | (7,346) | (16,203) |
| Other financing CF items | 1,402 | 1,333 | (19) | 3,927 | 4,341 | 375 | 0 | 0 |
| Cash flow from financing | (1,180) | (1,944) | (1,641) | 1,376 | 4,888 | 1,131 | (2,777) | (12,226) |
| Forex effect/others | (21) | 115 | (166) | 399 | (97) | 508 | 427 | 393 |
| Change in cash | 1,580 | 1,173 | (932) | 1,322 | (1,115) | (1,370) | 676 | 10,128 |
| Free cash flow | 1,079 | 1,945 | 486 | (519) | (1,353) | (4,692) | 3,019 | 21,953 |
Source: FactSet, Daiwa forecasts
Taiwan Union Technology Corp (6274 TT): 27 July 2026
Daiwa
Financial summary continued …
Balance sheet (TWDm)
| Year to 31 Dec | 2021 | 2022 | 2023 | 2024 | 2025 | 2026E | 2027E | 2028E |
|---|---|---|---|---|---|---|---|---|
| Cash & short-term investment | 6,582 | 6,814 | 5,657 | 7,037 | 10,602 | 7,538 | 8,214 | 18,342 |
| Inventory | 2,857 | 1,965 | 2,061 | 3,189 | 7,405 | 11,082 | 22,838 | 29,045 |
| Accounts receivable | 7,602 | 6,161 | 6,713 | 9,711 | 13,823 | 29,324 | 55,723 | 76,297 |
| Other current assets | 162 | 143 | 187 | 326 | 521 | 560 | 560 | 560 |
| Total current assets | 17,202 | 15,084 | 14,618 | 20,264 | 32,351 | 48,504 | 87,334 | 124,244 |
| Fixed assets | 4,743 | 4,671 | 4,793 | 5,614 | 7,386 | 9,557 | 10,224 | 10,781 |
| Goodwill & intangibles | 0 | 0 | 0 | 0 | 0 | 0 | 0 | 0 |
| Other non-current assets | 5 | 8 | 9 | 0 | 4 | 21 | 15 | 8 |
| Total assets | 21,951 | 19,763 | 19,420 | 25,878 | 39,741 | 58,082 | 97,573 | 135,033 |
| Short-term debt | 447 | 2,237 | 603 | 962 | 2,141 | 2,481 | 2,599 | 2,745 |
| Accounts payable | 5,741 | 4,143 | 4,581 | 6,642 | 11,871 | 19,823 | 38,517 | 50,392 |
| Other current liabilities | 252 | 174 | 364 | 269 | 608 | 886 | 886 | 886 |
| Total current liabilities | 6,440 | 6,553 | 5,548 | 7,873 | 14,621 | 23,189 | 42,003 | 54,022 |
| Long-term debt | 3,521 | 1,146 | 2,106 | 3,449 | 6,304 | 9,193 | 13,643 | 17,475 |
| Other non-current liabilities | 252 | 205 | 187 | 219 | 203 | 314 | 314 | 314 |
| Total liabilities | 10,214 | 7,904 | 7,840 | 11,541 | 21,127 | 32,696 | 55,959 | 71,810 |
| Share capital | 2,689 | 2,692 | 2,712 | 2,760 | 2,887 | 2,888 | 2,888 | 2,888 |
| Reserves/R.E./others | 9,047 | 9,167 | 8,868 | 11,577 | 15,727 | 22,498 | 38,726 | 60,335 |
| Shareholders' equity | 11,737 | 11,858 | 11,580 | 14,337 | 18,614 | 25,386 | 41,614 | 63,222 |
| Minority interests | 0 | 0 | 0 | 0 | 0 | 0 | 0 | 0 |
| Total equity & liabilities | 21,951 | 19,763 | 19,420 | 25,878 | 39,741 | 58,082 | 97,573 | 135,033 |
| EV | 360,083 | 359,265 | 359,748 | 360,070 | 360,539 | 366,831 | 370,724 | 364,573 |
| Net debt/(cash) | (2,613) | (3,431) | (2,948) | (2,626) | (2,158) | 4,135 | 8,028 | 1,877 |
| BVPS (TWD) | 43.735 | 44.063 | 42.875 | 52.635 | 66.255 | 87.841 | 143.993 | 218.761 |
Key ratios (%)
| Year to 31 Dec | 2021 | 2022 | 2023 | 2024 | 2025 | 2026E | 2027E | 2028E |
|---|---|---|---|---|---|---|---|---|
| Sales (YoY) | 17.1 | (12.6) | (13.4) | 44.2 | 31.5 | 100.9 | 86.8 | 50.2 |
| EBITDA (YoY) | 5.8 | (30.5) | (3.8) | 100.8 | 26.9 | 210.5 | 114.5 | 60.6 |
| Operating profit (YoY) | 4.7 | (37.1) | (4.9) | 133.9 | 30.4 | 228.6 | 119 | 61.7 |
| Net profit (YoY) | 6.0 | (32.9) | (34.7) | 216.3 | 30.9 | 207.8 | 120.6 | 61.7 |
| Core EPS (fully-diluted) (YoY) | 5.1 | (33.2) | (34.9) | 213.7 | 28.0 | 196.4 | 120.6 | 61.7 |
| Gross-profit margin | 21.0 | 18.4 | 19.7 | 23.2 | 22.7 | 30.2 | 33.7 | 35 |
| EBITDA margin | 13.3 | 10.6 | 11.8 | 16.4 | 15.8 | 24.5 | 28.1 | 30 |
| Operating-profit margin | 11.3 | 8.1 | 8.9 | 14.4 | 14.3 | 23.4 | 27.4 | 29.6 |
| Net profit margin | 8.9 | 6.8 | 5.1 | 11.3 | 11.2 | 17.2 | 20.3 | 21.9 |
| ROAE | 16.5 | 10.7 | 7.0 | 20.1 | 20.7 | 47.7 | 69.1 | 71.4 |
| ROAA | 9.1 | 6.0 | 4.2 | 11.5 | 10.4 | 21.5 | 29.7 | 32.2 |
| ROCE | 15.5 | 9.7 | 9.6 | 20.2 | 19.0 | 44.5 | 65.8 | 71.5 |
| ROIC | 21.2 | 13.3 | 8.9 | 25.3 | 23.3 | 45.4 | 58.4 | 65.2 |
| Net debt to equity | net cash | net cash | net cash | net cash | 17.6 | 31.0 | 28.3 | 8.9 |
| Effective tax rate | 22.0 | 22.2 | 46.9 | 22.9 | 24.6 | 26.9 | 26 | 26 |
| Accounts receivable (days) | 114.3 | 136.0 | 146.8 | 129.9 | 141.6 | 129.2 | 136.3 | 140.9 |
| Current ratio (x) | 2.7 | 2.3 | 2.6 | 2.6 | 2.2 | 2.1 | 2.1 | 2.3 |
| Net interest cover (x) | 0.8 | 0.6 | 0.6 | 0.7 | 0.5 | 1.2 | 2.9 | 4.7 |
| Net dividend payout | 71.4 | 85.3 | 131.8 | 68.1 | 70.0 | 70.0 | 70 | 70 |
| Free cash flow yield | 0.3 | 0.5 | 0.1 | n.a. | n.a. | n.a. | 0.8 | 6.1 |
Source: FactSet, Daiwa forecasts
Company profile
Taiwan Union Technology Corporation (TUC) was established in 1974. In 2001, TUC started to provide its Mass Lamination service to customers. In Dec., 2003, TUC was officially listed in Taiwan OTC. In 2004, TUC established its Changshu plant in Jiangsu, China to satisfy customer demand in the Greater China area. TUC also provides its services globally from its network in Taiwan, China, Japan, South Korea, USA and Germany.
Taiwan Union Technology Corp (6274 TT): 27 July 2026
Daiwa
ESG analysis
ESG risks
| Risks | Risks | Management | Analyst comments |
|---|---|---|---|
| G | Executive/board quality | 2 | TUC has diverse stakeholders with varying interests. The concerns of each stakeholder category differ. TUC's departments engage with stakeholders through various channels to ensure timely communication and understanding of the Company's operations. TUC also tracks stakeholder requests and expectations and responds promptly. The Company reports to the Board of Directors annually on its communication with key stakeholders. |
| G | Capital management | 1 | TUC pays its dividend on a annual basis. In the past 5 years, it has managed its dividend payout well. We believe TUC will at least sustain its cash dividend payout in dollar terms over 2025-27E. We see its balance between investment and dividend as appropriate. |
| G | Related party & transaction | 2 | TUC's sales to related parties were insignifacnt versus its total revenue. We see limited risk for TUC. |
| S | Supply chain management | 1 | TUC audits Tier 1 suppliers for ESG compliance, requiring commitments on hazardous substance bans and human rights. Several supplier audits were completed with a 100% pass rate and no major violations. |
| S | Data security | 2 | TUC operates an Information Security Office and implements training, audits, and ISO 27001- compliant systems. No security incidents disrupted operations, and 683 employees attended security training. |
Note: Management score represents a company's ability to manage/benefit from certain ESG topics. The scores range from 1 to 3, with 1 being the strongest.
Update Date: 6 May 2026
Source: Daiwa, Company
Taiwan Union Technology Corp (6274 TT): 27 July 2026
Daiwa