PDF 原檔:報告_Daiwa_勤誠8210_20260810_original.pdf
圖片清單(已驗證 2026-08-11)
| 檔名 | size | 分類 | 親眼所見內容 |
|---|---|---|---|
260810_daiwa_Chenbro_001.png |
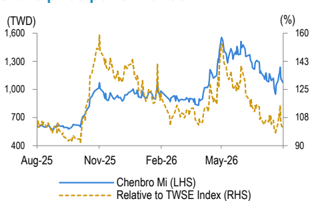
30KB | 真資料圖 | 勤誠股價走勢折線圖(藍線,左軸 TWD)與相對 TWSE 指數表現(金色虛線,右軸 %),時間軸 Aug-25 至 May-26 |
260810_daiwa_Chenbro_002.png |
20KB | 真資料圖 | 資料表:12個月股價區間 569.00–1,555.00、市值 4.17(USDbn)、3個月日均成交額 61.70(USDm)、流通股數 125(m)、主要股東 Feng-ming Chen(10.9%) |
260810_daiwa_Chenbro_003.png |
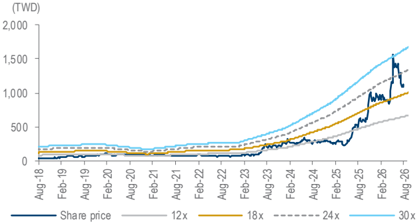
35KB | 真資料圖 | 勤誠一年期預估本益比區間圖(12x/18x/24x/30x 四條參考線),時間軸 Aug-18 至 Aug-26;股價於 2026 年一度突破 30x 線後回落 |
260810_daiwa_Chenbro_004.png |
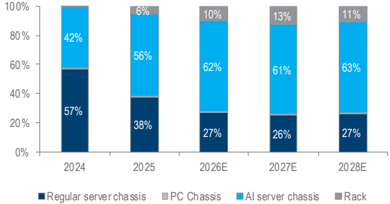
23KB | 真資料圖 | 勤誠營收結構堆疊長條圖(一般伺服器機殼/PC機殼/AI伺服器機殼),2024–2028E;AI伺服器機殼營收占比自 42%(2024)預估升至 63%(2028E) |
原始內容
Taiwan
Chenbro Micom (8210 TT)
Target price:
TWD1,235.00 (from TWD1,888.00)
Share price (10 Aug): TWD1,075.00 | Up/downside: +14.9%
Downgrading: short-term hiccups
- Short-term demand negatively impacted by component shortage
- Will enjoy less spec upgrade than its AI component peers long-term
- Downgrading to Outperform (2); lowering 12M TP to TWD1,235
What's new: We provide updates after Chenbro's 2Q26 results and downgrade our rating of its stock to Outperform (2) from Buy (1).
What's the impact: Business outlook. While we do not expect a major change in AI server shipment forecasts in the near term, Chenbro will face short-term hiccups from 3Q26 as one of its key clients is suffering from a memory shortage. This might, in our view, trigger weaker-than-ouroriginally-expected revenue momentum from 3Q26. In the long term, Chenbro highlights its new business strategy to proliferate its product offering from chassis-level to rack-level, which is why it is expanding to a new factory (leasing with total equipment capex of TWD600m) to support future growth. Although we believe some of the customised racks will keep a c.30% gross margin in the short term, we expect that to decline to c.25% when Chenbro grows its rack revenue to a certain size. Overall, we believe Chenbro might not only have to face short-term headwinds from its key client, but also encounter gross-margin dilution with its rising addressable market in the long term. Though we appreciate Chenbro's effort to expand its total addressable market, it does not involve meaningful spec upgrades compared with its AI peers, which might lead to a de-rating of Chenbro's PER multiple. Nonetheless, we believe its fundamentals are largely on track in our forecast period despite some short-term slowdown.
2Q26 results review: Chenbro's 2Q26 earnings came in at TWD1.38bn (EPS: TWD11.03), which was 10% below our expectation but largely on track with the Bloomberg consensus. Chenbro's 2Q26 revenue came in at TWD7.8bn (+10% QoQ and +44% YoY). Although the number was largely on track with the consensus, we believe our overestimation of the HGX and ASIC AI server chassis contributions in 2Q26 was the key reason for the 7% gap between our estimate and the actual number. Gross and operating margins came in largely on track vs. consensus, with strength due to ongoing NRE recognition. Lastly, net income was impacted by a higher tax rate in 2Q26 (26.3% vs. 23.8% in 1Q26).
What we recommend: We cut our 2026-28E EPS by 3-10% to factor in a weaker revenue momentum in the short term. We downgrade our rating of Chenbro to Outperform (2) from Buy (1) and cut the 12M TP to TWD1,235, based on a lower target PER multiple of 23x (from 34x), applied to our 1year-forward EPS forecast, due to short-term hiccups and less spec upgrade vs. peers. Key downside risk: worse-than-expected AI server demand.
How we differ: Our 2026-28E EPS are lower than the Bloomberg consensus by 5-12% due mainly to our more bearish view on profitability.
10 August 2026
Daiwa
5
Outperform
Sheng Cheng
(886) 2 8758 6253
sheng.cheng@daiwacm-cathay.com.tw
Allan Wang
(886) 2 8758 6249 allan.wang@daiwacm-cathay.com.tw
Forecast revisions (%)
| Year to 31 Dec | 26E | 27E | 28E |
|---|---|---|---|
| Revenue change | (8.5) | (5.6) | (1.4) |
| Net profit change | (10.2) | (8.0) | (2.7) |
| Core EPS (FD) change | (10.2) | (8.0) | (2.7) |
Source: Daiwa forecasts
Share price performance
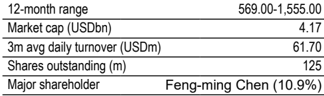
| 12-month range | 569.00-1,555.00 |
|---|---|
| Market cap (USDbn) | 4.17 |
| 3m avg daily turnover (USDm) | 61.70 |
| Shares outstanding (m) | 125 |
| Major shareholder | Feng-ming Chen (10.9%) |
Financial summary (TWD)
| Year to 31 Dec | 26E | 27E | 28E |
|---|---|---|---|
| Revenue (m) | 32,732 | 44,373 | 54,319 |
| Operating profit (m) | 7,801 | 9,979 | 11,872 |
| Net profit (m) | 5,794 | 7,511 | 8,954 |
| Core EPS (fully-diluted) | 46.237 | 59.938 | 71.450 |
| EPS change (%) | 62.8 | 29.6 | 19.2 |
| Daiwa vs Cons. EPS (%) | (5.2) | (9.3) | (12.1) |
| PER (x) | 23.2 | 17.9 | 15.0 |
| Dividend yield (%) | 1.3 | 2.3 | 3.1 |
| DPS | 14.0 | 25.0 | 33.0 |
| PBR (x) | 9.0 | 7.0 | 5.6 |
| EV/EBITDA (x) | 15.3 | 11.7 | 9.7 |
| ROE (%) | 44.9 | 43.9 | 41.2 |
Source: FactSet, Daiwa forecasts
Chenbro Micom (8210 TT): 10 August 2026
Chenbro: Daiwa revenue and earnings forecasts revisions vs. Bloomberg consensus
| 2026E | 2026E | 2026E | 2027E | 2027E | 2027E | 2028E | 2028E | 2028E | |
|---|---|---|---|---|---|---|---|---|---|
| (TWDm) | Previous | New | Consensus | Previous | New | Consensus | Previous | New | Consensus |
| Revenue | 35,785 | 32,732 | 34,241 | 46,981 | 44,373 | 46,100 | 55,107 | 54,319 | 57,890 |
| Diff (%) | -8.5% | -4.4% | -5.6% | -3.7% | -1.4% | -6.2% | |||
| Gross Margin (%) | 31.3% | 31.6% | 31.7% | 29.7% | 29.3% | 30.9% | 29.2% | 28.6% | 29.1% |
| Operating profit | 8,586 | 7,801 | 8,163 | 10,851 | 9,979 | 11,086 | 12,215 | 11,872 | 13,947 |
| Op Margin (%) | 24.0% | 23.8% | 23.8% | 23.1% | 22.5% | 24.0% | 22.2% | 21.9% | 24.1% |
| Net profit | 6,449 | 5,794 | 6,111 | 8,168 | 7,511 | 8,280 | 9,204 | 8,954 | 10,192 |
| EPS (TWD) | 51.46 | 46.24 | 48.77 | 65.17 | 59.94 | 66.07 | 73.45 | 71.45 | 81.32 |
| Diff (%) | -10.2% | -5.2% | -8.0% | -9.3% | -2.7% | -12.1% |
Source: Bloomberg, Daiwa forecasts
Chenbro: quarterly and annual P&L statement
| 2026E | 2026E | 2026E | 2026E | 2027E | 2025 | 2026E | 2027E | 2028E | ||||
|---|---|---|---|---|---|---|---|---|---|---|---|---|
| (TWDm) | 1Q | 2Q | 3QE | 4QE | 1QE | 2QE | 3QE | 4QE | ||||
| Net revenue | 7,107 | 7,821 | 8,528 | 9,276 | 8,447 | 10,611 | 12,313 | 13,002 | 22,001 | 32,732 | 44,373 | 54,319 |
| COGS | -4,774 | -5,268 | -5,868 | -6,479 | -5,964 | -7,484 | -8,708 | -9,215 | -15,407 | -22,389 | -31,371 | -38,759 |
| Gross profit | 2,333 | 2,553 | 2,660 | 2,797 | 2,483 | 3,126 | 3,605 | 3,788 | 6,594 | 10,343 | 13,002 | 15,560 |
| Operating expenses | -554 | -627 | -657 | -705 | -659 | -732 | -800 | -832 | -1,827 | -2,543 | -3,024 | -3,688 |
| Operating profit | 1,779 | 1,926 | 2,004 | 2,092 | 1,824 | 2,394 | 2,805 | 2,955 | 4,767 | 7,801 | 9,979 | 11,872 |
| Non-operating profit | 13 | -22 | -29 | -29 | -30 | -29 | -29 | -29 | 65 | -68 | -118 | -118 |
| Pre-tax profit | 1,792 | 1,904 | 1,975 | 2,063 | 1,794 | 2,365 | 2,776 | 2,926 | 4,832 | 7,733 | 9,860 | 11,754 |
| Income taxes | -427 | -500 | -470 | -491 | -427 | -563 | -661 | -697 | -1,171 | -1,888 | -2,349 | -2,800 |
| Net profit | 1,336 | 1,383 | 1,504 | 1,571 | 1,366 | 1,802 | 2,114 | 2,229 | 3,558 | 5,794 | 7,511 | 8,954 |
| Net EPS (TWD) | 10.66 | 11.03 | 12.00 | 12.54 | 10.90 | 14.38 | 16.87 | 17.79 | 29.07 | 46.24 | 59.94 | 71.45 |
| Operating Ratios | ||||||||||||
| Gross margin | 32.8% | 32.6% | 31.2% | 30.1% | 29.4% | 29.5% | 29.3% | 29.1% | 30.0% | 31.6% | 29.3% | 28.6% |
| Operating margin | 25.0% | 24.6% | 23.5% | 22.5% | 21.6% | 22.6% | 22.8% | 22.7% | 21.7% | 23.8% | 22.5% | 21.9% |
| Pre-tax margin | 25.2% | 24.3% | 23.2% | 22.2% | 21.2% | 22.3% | 22.5% | 22.5% | 22.0% | 23.6% | 22.2% | 21.6% |
| Net margin | 18.8% | 17.7% | 17.6% | 16.9% | 16.2% | 17.0% | 17.2% | 17.1% | 16.2% | 17.7% | 16.9% | 16.5% |
| YoY (%) | ||||||||||||
| Net revenue | 71% | 44% | 51% | 38% | 19% | 36% | 44% | 40% | 52% | 49% | 36% | 22% |
| Gross profit | 95% | 57% | 50% | 40% | 6% | 22% | 36% | 35% | 74% | 57% | 26% | 20% |
| Operating profit | 101% | 55% | 55% | 55% | 3% | 24% | 40% | 41% | 90% | 64% | 28% | 19% |
| Pre-tax profit | 98% | 67% | 47% | 43% | 0% | 24% | 41% | 42% | 85% | 60% | 28% | 19% |
| Net profit | 100% | 67% | 51% | 47% | 2% | 30% | 41% | 42% | 84% | 63% | 30% | 19% |
| QoQ (%) | ||||||||||||
| Net revenue | 5% | 10% | 9% | 9% | -9% | 26% | 16% | 6% | ||||
| Gross profit | 17% | 9% | 4% | 5% | -11% | 26% | 15% | 5% | ||||
| Operating profit | 32% | 8% | 4% | 4% | -13% | 31% | 17% | 5% | ||||
| Pre-tax profit | 24% | 6% | 4% | 4% | -13% | 32% | 17% | 5% | ||||
| Net profit | 25% | 4% | 9% | 4% | -13% | 32% | 17% | 5% |
Source: Company, Daiwa forecasts
Chenbro: 2Q26 comparison table
| (TWDm) | Actual | QoQ% | YoY% | Daiwa | Diff% | Consensus | Diff% |
|---|---|---|---|---|---|---|---|
| Revenue | 7,821 | 10% | 44% | 8,374 | -7% | 7,734 | 1% |
| Gross profit | 2,553 | 9% | 57% | 2,663 | -4% | 2,441 | 5% |
| Gross margin (%) | 32.6% | 31.8% | 31.6% | ||||
| Operating profit | 1,926 | 8% | 55% | 2,043 | -6% | 1,831 | 5% |
| Operating margin (%) | 24.6% | 24.4% | 23.7% | ||||
| Pre-tax profit | 1,904 | 6% | 67% | 2,017 | -6% | 1,832 | 4% |
| Net profit | 1,383 | 4% | 67% | 1,533 | -10% | 1,374 | 1% |
| EPS (TWD) | 11.03 | 4% | 67% | 12.23 | -10% | 10.96 | 1% |
Source: Company data, Daiwa forecasts, Bloomberg
Chenbro: 1-year forward PER bands
Source: TEJ, Daiwa forecasts
Chenbro: revenue breakdown
Source: Company, Daiwa forecasts
Daiwa
Financial summary
Key assumptions
| Year to 31 Dec | 2021 | 2022 | 2023 | 2024 | 2025 | 2026E | 2027E | 2028E |
|---|---|---|---|---|---|---|---|---|
| AI server chassis shipment (k) | 0.0 | 0.0 | 30.1 | 73.7 | 215.3 | 432.3 | 529.6 | 645.3 |
| Regular server chassis shipment (k) | 2,089.7 | 2,078.7 | 1,670.0 | 1,620.0 | 1,697.1 | 1,972.3 | 2,382.2 | 3,031.3 |
| Total server shipment (K) | 2,089.7 | 2,078.7 | 1,700.1 | 1,693.7 | 1,912.4 | 2,404.7 | 2,911.8 | 3,676.5 |
Profit and loss (TWDm)
| Year to 31 Dec | 2021 | 2022 | 2023 | 2024 | 2025 | 2026E | 2027E | 2028E |
|---|---|---|---|---|---|---|---|---|
| AI server chassis | 0 | 0 | 2,290 | 6,116 | 13,597 | 23,541 | 32,886 | 39,746 |
| Regular server chassis | 8,896 | 10,316 | 8,501 | 8,245 | 8,261 | 8,854 | 11,327 | 14,414 |
| Other Revenue | 527 | 241 | 457 | 156 | 144 | 338 | 160 | 160 |
| Total Revenue | 9,423 | 10,558 | 11,247 | 14,517 | 22,001 | 32,732 | 44,373 | 54,319 |
| Other income | 0 | 0 | 0 | 0 | 0 | 0 | 0 | 0 |
| COGS | (7,579) | (8,427) | (8,673) | (10,727) | (15,407) | (22,389) | (31,371) | (38,759) |
| SG&A | (757) | (792) | (937) | (1,059) | (1,479) | (2,000) | (2,272) | (2,757) |
| Other op.expenses | (204) | (197) | (176) | (224) | (347) | (543) | (752) | (931) |
| Operating profit | 882 | 1,142 | 1,462 | 2,506 | 4,767 | 7,801 | 9,979 | 11,872 |
| Net-interest inc./(exp.) | 4 | (28) | (46) | (19) | (6) | (21) | (18) | (18) |
| Assoc/forex/extraord./others | (1) | 229 | 14 | 124 | 71 | (46) | (100) | (100) |
| Pre-tax profit | 886 | 1,343 | 1,430 | 2,611 | 4,832 | 7,733 | 9,860 | 11,754 |
| Tax | (214) | (334) | (323) | (639) | (1,171) | (1,888) | (2,349) | (2,800) |
| Min. int./pref. div./others | 1 | (10) | (22) | (38) | (102) | (50) | 0 | 0 |
| Net profit (reported) | 673 | 999 | 1,085 | 1,934 | 3,558 | 5,794 | 7,511 | 8,954 |
| Net profit (adjusted) | 673 | 999 | 1,085 | 1,934 | 3,558 | 5,794 | 7,511 | 8,954 |
| EPS (reported)(TWD) | 5.571 | 8.279 | 9.001 | 15.981 | 28.394 | 46.237 | 59.938 | 71.450 |
| EPS (adjusted)(TWD) | 5.571 | 8.279 | 9.001 | 15.981 | 28.394 | 46.237 | 59.938 | 71.450 |
| EPS (adjusted fully-diluted)(TWD) | 5.571 | 8.279 | 9.001 | 15.981 | 28.394 | 46.237 | 59.938 | 71.450 |
| DPS (TWD) | 4.000 | 3.000 | 4.000 | 5.000 | 7.500 | 14.000 | 25.000 | 33.000 |
| EBIT | 882 | 1,142 | 1,462 | 2,506 | 4,767 | 7,801 | 9,979 | 11,872 |
| EBITDA | 1,221 | 1,518 | 1,760 | 2,852 | 5,155 | 8,462 | 10,836 | 12,872 |
Cash flow (TWDm)
| Year to 31 Dec | 2021 | 2022 | 2023 | 2024 | 2025 | 2026E | 2027E | 2028E |
|---|---|---|---|---|---|---|---|---|
| Profit before tax | 886 | 1,343 | 1,430 | 2,611 | 4,832 | 7,733 | 9,860 | 11,754 |
| Depreciation and amortisation | 338 | 377 | 298 | 346 | 387 | 661 | 858 | 1,000 |
| Tax paid | (214) | (334) | (323) | (639) | (1,171) | (1,888) | (2,349) | (2,800) |
| Change in working capital | (492) | (1,106) | 369 | 281 | (2,059) | 113 | (1,535) | (1,298) |
| Other operational CF items | (76) | 216 | 749 | 98 | 1,099 | 0 | 0 | (0) |
| Cash flow from operations | 443 | 495 | 2,524 | 2,697 | 3,087 | 6,619 | 6,835 | 8,656 |
| Capex | (1,997) | (848) | (215) | (789) | (984) | (2,455) | (1,775) | (2,173) |
| Net (acquisitions)/disposals | 210 | (19) | (0) | (688) | 495 | 0 | 0 | 0 |
| Other investing CF items | (10) | (44) | (18) | (112) | (4) | 0 | 0 | 0 |
| Cash flow from investing | (1,797) | (912) | (234) | (1,589) | (493) | (2,455) | (1,775) | (2,173) |
| Change in debt | 2,088 | 1,112 | (682) | 263 | 210 | 0 | 0 | 0 |
| Net share issues/(repurchases) | 0 | 0 | 0 | 0 | 0 | 0 | 0 | 0 |
| Dividends paid | (484) | (362) | (483) | (603) | (907) | (1,754) | (3,133) | (4,136) |
| Other financing CF items | (11) | (10) | (10) | (9) | (8) | 0 | 0 | 0 |
| Cash flow from financing | 1,594 | 740 | (1,175) | (348) | (705) | (1,754) | (3,133) | (4,136) |
| Forex effect/others | (19) | 92 | (21) | 93 | (1) | 0 | 0 | 0 |
| Change in cash | 221 | 416 | 1,094 | 853 | 1,888 | 2,410 | 1,927 | 2,348 |
| Free cash flow | (1,553) | (353) | 2,309 | 1,907 | 2,103 | 4,164 | 5,060 | 6,483 |
Source: FactSet, Daiwa forecasts
Chenbro Micom (8210 TT): 10 August 2026
Daiwa
Financial summary continued …
Balance sheet (TWDm)
| Year to 31 Dec | 2021 | 2022 | 2023 | 2024 | 2025 | 2026E | 2027E | 2028E |
|---|---|---|---|---|---|---|---|---|
| Cash & short-term investment | 1,447 | 1,868 | 2,979 | 4,540 | 5,912 | 8,321 | 10,248 | 12,596 |
| Inventory | 2,399 | 2,400 | 1,843 | 2,187 | 3,925 | 4,907 | 6,876 | 8,495 |
| Accounts receivable | 2,468 | 2,418 | 3,667 | 3,736 | 6,566 | 3,139 | 4,255 | 5,209 |
| Other current assets | 181 | 270 | 99 | 121 | 181 | 181 | 181 | 181 |
| Total current assets | 6,495 | 6,955 | 8,588 | 10,585 | 16,583 | 16,548 | 21,559 | 26,480 |
| Fixed assets | 4,491 | 5,130 | 5,013 | 5,450 | 5,737 | 7,530 | 8,447 | 9,620 |
| Goodwill & intangibles | 21 | 52 | 73 | 65 | 57 | 57 | 57 | 57 |
| Other non-current assets | 247 | 206 | 313 | 544 | 1,079 | 1,079 | 1,079 | 1,079 |
| Total assets | 11,253 | 12,343 | 13,987 | 16,644 | 23,456 | 25,215 | 31,143 | 37,237 |
| Short-term debt | 1,076 | 1,545 | 376 | 641 | 1,222 | 1,222 | 1,222 | 1,222 |
| Accounts payable | 3,075 | 1,979 | 3,038 | 3,721 | 6,196 | 3,864 | 5,415 | 6,690 |
| Other current liabilities | 895 | 1,196 | 2,270 | 2,271 | 3,495 | 3,495 | 3,495 | 3,495 |
| Total current liabilities | 5,047 | 4,720 | 5,683 | 6,632 | 10,914 | 8,582 | 10,132 | 11,407 |
| Long-term debt | 1,963 | 2,652 | 2,701 | 2,671 | 1,332 | 1,332 | 1,332 | 1,332 |
| Other non-current liabilities | 67 | 34 | 26 | 76 | 134 | 134 | 134 | 134 |
| Total liabilities | 7,076 | 7,407 | 8,409 | 9,380 | 12,380 | 10,048 | 11,598 | 12,873 |
| Share capital | 1,208 | 1,206 | 1,206 | 1,210 | 1,253 | 1,253 | 1,253 | 1,253 |
| Reserves/R.E./others | 2,949 | 3,701 | 4,321 | 5,964 | 9,632 | 13,672 | 18,050 | 22,869 |
| Shareholders' equity | 4,157 | 4,907 | 5,527 | 7,174 | 10,885 | 14,925 | 19,303 | 24,122 |
| Minority interests | 20 | 30 | 51 | 90 | 192 | 242 | 242 | 242 |
| Total equity & liabilities | 11,253 | 12,343 | 13,987 | 16,644 | 23,456 | 25,215 | 31,143 | 37,237 |
| EV | 136,330 | 137,077 | 134,867 | 133,579 | 131,552 | 129,193 | 127,266 | 124,918 |
| Net debt/(cash) | 1,592 | 2,330 | 97 | (1,229) | (3,358) | (5,767) | (7,694) | (10,042) |
| BVPS (TWD) | 34.414 | 40.679 | 45.828 | 59.298 | 86.857 | 119.094 | 154.032 | 192.482 |
Key ratios (%)
| Year to 31 Dec | 2021 | 2022 | 2023 | 2024 | 2025 | 2026E | 2027E | 2028E |
|---|---|---|---|---|---|---|---|---|
| Sales (YoY) | 24.9 | 12.0 | 6.5 | 29.1 | 51.6 | 48.8 | 35.6 | 22.4 |
| EBITDA (YoY) | 3.0 | 24.4 | 15.9 | 62.0 | 80.7 | 64.2 | 28.1 | 18.8 |
| Operating profit (YoY) | (8.4) | 29.4 | 28 | 71.5 | 90.2 | 63.6 | 27.9 | 19.0 |
| Net profit (YoY) | (31.1) | 48.4 | 8.7 | 78.1 | 84.0 | 62.8 | 29.6 | 19.2 |
| Core EPS (fully-diluted) (YoY) | (31.0) | 48.6 | 8.7 | 77.6 | 77.7 | 62.8 | 29.6 | 19.2 |
| Gross-profit margin | 19.6 | 20.2 | 22.9 | 26.1 | 30.0 | 31.6 | 29.3 | 28.6 |
| EBITDA margin | 13.0 | 14.4 | 15.6 | 19.6 | 23.4 | 25.9 | 24.4 | 23.7 |
| Operating-profit margin | 9.4 | 10.8 | 13 | 17.3 | 21.7 | 23.8 | 22.5 | 21.9 |
| Net profit margin | 7.1 | 9.5 | 9.7 | 13.3 | 16.2 | 17.7 | 16.9 | 16.5 |
| ROAE | 16.6 | 22.0 | 20.8 | 30.4 | 39.4 | 44.9 | 43.9 | 41.2 |
| ROAA | 7.0 | 8.5 | 8.2 | 12.6 | 17.7 | 23.8 | 26.7 | 26.2 |
| ROCE | 14.6 | 14.0 | 16.4 | 26.1 | 39.4 | 49.8 | 50.1 | 48.4 |
| ROIC | 14.2 | 13.2 | 17.5 | 32.3 | 52.5 | 68.9 | 71.5 | 69.1 |
| Net debt to equity | 38.3 | 47.5 | 1.8 | n.a. | n.a. | n.a. | n.a. | n.a. |
| Effective tax rate | 24.1 | 24.9 | 22.6 | 24.5 | 24.2 | 24.4 | 23.8 | 23.8 |
| Accounts receivable (days) | 82.9 | 84.4 | 98.7 | 93.1 | 85.5 | 54.1 | 30.4 | 31.8 |
| Current ratio (x) | 1.3 | 1.5 | 1.5 | 1.6 | 1.5 | 1.9 | 2.1 | 2.3 |
| Net interest cover (x) | n.a. | 40.4 | 31.5 | 132.8 | 764.7 | 369.4 | 550.4 | 670.5 |
| Net dividend payout | 49.5 | 53.8 | 48.3 | 55.5 | 46.9 | 49.3 | 54.1 | 55.1 |
| Free cash flow yield | n.a. | n.a. | 1.7 | 1.4 | 1.6 | 3.1 | 3.8 | 4.8 |
Source: FactSet, Daiwa forecasts
Company profile
Founded in 1983 and listed on the Taiwan stock exchange in 2011, Chenbro started as the first computer chassis manufacturer in Asia with its own-brand rackmount systems, tower servers and PC chassis. In 3Q25, server-related products accounted for 99% of revenue and PC chassis 1%. The company is headquartered in New Taipei City and owns production sites in Shulin, Chiayi, Kunshan and Dongguan. Meanwhile, Chenbro also owns service centres in the US, Germany, and China.
Chenbro Micom (8210 TT): 10 August 2026
Daiwa
ESG analysis
ESG risks
| Risks | Risks | Management | Analyst comments |
|---|---|---|---|
| Executive/board quality | 2 | Chenbro's board consists of 9 directors, including 4 independent directors - the total number of directors is slightly lower than that of other listed companies in our coverage. Chenbro held 5 board meetings in 2024 and the actual attendee rate was 91%. The majority of its board are co-founders of Chenbro, which is likely positive for the company. In addition, 4 out of 9 board members are female and the independent directors have diversified backgrounds with expertise in accounting and management. We see this as positive for overall board quality. | |
| G | Capital management | 2 | Chenbro declared a DPS of TWD7.5 in 2024, representing a payout ratio of 45%. The payout ratio in 2024 was lower than the payout ratio range of 50-90% over 2010-24 due to the sharp inventory digestion. As a leading server and PC chassis manufacturer, Chenbro should deliver solid revenue growth and FCF along with industry-leading growth rate in the regular server and AI server market. The higher R&D expenses and increased inventory requirements resulting from the revenue growth led to the slightly lower payout ratio in 2024 compared to the previous decade. That said, we think higher revenue growth for Chenbro in 2024 should partially offset the lower payout ratio. |
| Related party & transaction | 1 | There were no reported related-party transactions in both sales and purchases, in 2024. We see limited downside associated with related party transactions. | |
| S | Supply chain management | 2 | Chenbro has committed to the "Code of Conduct for Responsible Business Alliance" issued by the Responsible Business Alliance (RBA), which requires its suppliers to meet the standards of no child labour, no forced labour, zero discharge of untreated toxic or hazardous substance/materials, and zero behaviour that causes immediate physical harm to employees. In order to achieve better supply chain management, Chenbro imposes rules for its supply chain and will conduct quarterly evaluation reviews based on the purchase amount and compliance with sustainability standards. Chenbro hosted a supplier conference annually on sustainability, net zero and the disclosure of |
| S | Data security | 2 | Chenbro has established a team to implement data security management. Moreover, it conducts data security training and education regularly for all employees annually. |
Note: Management score represents a company's ability to manage/benefit from certain ESG topics. The scores range from 1 to 3, with 1 being the strongest.
Update Date: 23 Dec 2025
Source: Daiwa, Company
Chenbro Micom (8210 TT): 10 August 2026
Daiwa