PDF 原檔:報告_CLSA_宏致3605_20261006_original.pdf
圖片清單(已驗證 2026-10-07)
| 檔名 | size | 分類 | 親眼所見內容 |
|---|---|---|---|
報告_CLSA_宏致3605_20261006_007.png |
1.1MB | 真資料圖 | Bloom 潛在新廠址空拍圖(紅框標示,周邊為 Tesla、Amazon、Quanta、Mitac、Apple 等公司標誌) |
報告_CLSA_宏致3605_20261006_008.png |
508KB | 真資料圖 | Bloom SOFC 供應鏈示意:電池片→電池堆→功率模組機櫃→多組模組,標示宏致 hot box 電源線/PCS 線材/高壓 DLO 線材,Kaori、MTAR(hot box)、Acbel(PCS)、Vinatech(超級電容)、Porite、Three-Circle |
報告_CLSA_宏致3605_20261006_013.png |
319KB | 真資料圖 | 宏致高速連接器產品組合,標示於伺服器內部(Multi-trak、MCIO、NearStack、PCIe CEM、Riser、CAMM2、M.2、E1/E3、SFF-8639、Gen-Z、BTB 等) |
報告_CLSA_宏致3605_20261006_006.png |
301KB | 真資料圖 | Bloom 新租廠房平面圖(158,400 SF、建物特徵)與新廠/既有廠位置地圖 |
報告_CLSA_宏致3605_20261006_032.png |
294KB | 真資料圖 | Computex 2026 施耐德電源機櫃產品展示照(多組機櫃) |
報告_CLSA_宏致3605_20261006_015.png |
184KB | 真資料圖 | 1U 伺服器與主板上高速連接器位置標註(PCIe extend、NIC to MB、NVMe to MB、PSU to MB、風扇連接器) |
報告_CLSA_宏致3605_20261006_021.png |
166KB | 真資料圖 | 宏致全球據點世界地圖(辦公室/工廠/倉庫,台灣、大中華、東南亞、美國/歐洲清單) |
報告_CLSA_宏致3605_20261006_023.png |
165KB | 真資料圖 | 宏致車用產品組合示意(智慧天線、ADAS、BCM、FAKRA、高壓線束、鏡頭線等) |
報告_CLSA_宏致3605_20261006_022.png |
151KB | 真資料圖 | 宏致網通產品組合圖(高速線、連接器等)與網通營收/YoY 圖(2024-2028SP,2026SP 約 1,885 NT$m、+34%) |
報告_CLSA_宏致3605_20261006_011.png |
146KB | 真資料圖 | 未來 AI 800V 資料中心電力架構(SST→800V→DC-DC→48V→DC-DC→GPU,機櫃 >1MW) |
報告_CLSA_宏致3605_20261006_009.png |
142KB | 真資料圖 | Bloom 燃料電池→電池堆→功率模組→能源伺服器階段圖,標示 PCS/hot box 線材與 DLO 高壓電纜傳輸範圍 |
報告_CLSA_宏致3605_20261006_004.png |
124KB | 真資料圖 | Bloom 運作原理(SOFC 反應式)與 cell→stack(約 1kW)→power module(約 65kW)→energy server(約 325kW)→energy farm |
報告_CLSA_宏致3605_20261006_017.png |
108KB | 真資料圖 | PCIe 頻寬逐代倍增曲線(至 2025 年 512 GB/s)與機架內 PCIe/CXL 互連示意(Marvell) |
報告_CLSA_宏致3605_20261006_029.png |
107KB | 真資料圖 | 宏致消費性產品組合圖(高速線、M.2、LVDS、Mag Fit、FFC/FPC、Type C、DDR5 等) |
報告_CLSA_宏致3605_20261006_031.png |
98KB | 真資料圖 | 傳統 IT 機櫃(PSU 在托盤內)與電源機櫃架構比較圖 |
報告_CLSA_宏致3605_20261006_018.png |
93KB | 真資料圖 | 宏致高速線產品照(SFP、QSFP、SlimSAS、MCIO) |
報告_CLSA_宏致3605_20261006_010.png |
91KB | 真資料圖 | 現行 AI 48V 資料中心電力架構(13.8kVac→變壓器→220Vac→AC-DC→48V→DC-DC→GPU) |
報告_CLSA_宏致3605_20261006_025.png |
89KB | 真資料圖 | 宏致工業產品組合照(UPS、馬達線、圓形連接器、LVDS 線、伺服馬達連接器與線材等) |
報告_CLSA_宏致3605_20261006_028.png |
87KB | 真資料圖 | 全球 PC(NB)出貨量與 YoY 圖(2023-2028SP,2026SP 約 -14%、2027SP 約 -5%、2028SP 約 +5%) |
報告_CLSA_宏致3605_20261006_035.png |
57KB | 真資料圖 | 宏致季營收與 YoY 柱線圖(1Q24-4Q27SP,4Q27SP 約 5,900 NT$m) |
報告_CLSA_宏致3605_20261006_005.png |
57KB | 真資料圖 | Bloom 產品/服務積壓訂單(2019-2025,2025 年約 US$20bn 含 product 6)與 Bloom 年產能預估(2025 年 1GW→2026SP 2→2027SP 4→2028SP 6→長期 10GW) |
報告_CLSA_宏致3605_20261006_033.png |
51KB | 真資料圖 | 宏致產品營收占比堆疊圖(2024-2027SP;2027SP Bloom 電源線 28%、NB 與消費性 24%、伺服器 20%) |
報告_CLSA_宏致3605_20261006_003.png |
52KB | 真資料圖 | Bloom 電源線營收與 YoY(2026SP 約 1,000、2027SP 約 5,800、2028SP 約 9,200 NT$m) |
報告_CLSA_宏致3605_20261006_030.png |
45KB | 真資料圖 | NB 與消費性營收與 YoY(2024-2028SP,2026SP 約 4,680 NT$m、-12%) |
其餘 <40KB 抽圖預設為 logo/小圖,未 Read。分類只有三類:真資料圖/裝飾·logo·banner/文字卡。
原始內容
報告_CLSA_宏致3605_20261006
PDF 原檔:報告_CLSA_宏致3605_20261006_original.pdf
原始內容
Research provided by
6 October 2026
Taiwan
Technology
Reuters
3605.TW
Bloomberg
3605 TT
Priced on 6 October 2026
Taiwan Wtd@ 49,712.0
12M hi/lo NT$183.50/53.94
12M price target NT$270.00
±% potential
+57%
Shares in issue 163.8m
Free float (est.) 76.5%
Market cap US$928m
3M ADV
US$58.2m
Foreign s'holding 21.6%
Major shareholders
Yuan Wan-Ting 5.3%
Keyan Investment Co., Ltd.4.0%
SinoPac analysts: Vanessa Huang, SinoPac
vanessa.huang@cl-sec.com
+886 223 268151
+886 223 268179
Stock performance (%)
| 1M | 3M | 12M | |
|---|---|---|---|
| Absolute | 45.8 | 96.1 | 142.0 |
| Relative | 36.5 | 84.6 | 30.3 |
| Abs (US$) | 45.3 | 97.9 | 132.6 |
Source: Bloomberg
SinoPac
NT$172.00 - OUTPERFORM
Wired for growth
Initiate coverage with anOutperformrating andtarget price of NT$270
ACES is entering a two-engine growth phase. It is a key powercable supplier to Bloom Energy as Bloom doubles its fuel-cell capacity, and it is expanding its highspeed connector content from AI serverdaughterboards to ASIC motherboards, as a high-speed cable leg comes on stream. We forecast a 72% EPS Cagrover 202628, with OPM expanding from 7.4% in 2026 to 11.0% in 2027.Our TP of NT$270 is based on 20x 2H27-1H28SP EPS, andwe initiate coverage at Outperform.
Bloom Energy the keyearnings driver in 2027
ACES's multiyear partnership with Bloom locks in its share asBloomplansto lift capacity from 2GW in 2026to 4GW/6GW in 2027/28, based on our checks. ACES has shipped fuel-cell power cables to Bloomsince 1Q26 andwill add external DLO high-voltage cables,with ASP of US$80-100kper set. We expectBloom power cables tobeNT$5.8bn of sales and account for 28%of group revenue in 2027. Powerproducts need little incremental R&D and benefit fromstrong operating leverage. We expectoverall OPM to expand from 7.4% in 2026 to 11.0% in 2027.
High-speed products a new driver
Previously, ACES supplied only daughterboard connectors, at 10-20 units per rack. On ASIC platforms, where ODMs have more say in supplier selection, ACEShas secured theopportunityto shipboth motherboard and daughterboardconnectors (about 30 units per rack) and broadens its connector productofferings. With Gen6 connectors carryingaround a 15% ASP premium overGen5, andACES asone of only four vendors qualified by CSPs at Gen6,we forecast server revenue growth of 107%/74% YoY in 2026/27.The newly addedGen6 PCIe cableproduct, qualified by two CSPs, began shipping in April 2026 at 20% of GM, with room to rise towards 30% as yield improves.Hence, we expect GM to recover to 26%in 2027.
Capacity in place ahead of demand
ACES has committed firm capacityahead of demand. For power cables, it has leased a new facilitynext to its Philippine plant, with new capacity planned to come online in 4Q26. For serverproducts, it plansto raiseconnector capacity from 4m to 5m units/mo and will expand high-speed cableproduction lines fromtwo to eight.
Initiate coverage with an Outperform rating
We forecast 2027/28SPEPS of NT$11.19/NT$14.93, with our 2027 forecast 48% ahead of consensus. Our TP of NT$270 is basedon 20x 2H27-1H28SP EPS, backed by a 72% EPS Cagr in 2026-28SP drivenby power cableramp-upand high-speed connector shipment growth. We initiate coverage with an Outperformrating.
| Financials | |||||
|---|---|---|---|---|---|
| Year to 31 December Revenue (NT$m) | 24A 9,771 | 25A 10,860 | 26SP 13,199 | 27SP 20,531 | 28SP 26,733 |
| Net profit (NT$m) | 344 | 661 | 830 | 1,961 | 2,617 |
| EPS (NT$) | 2.40 | 4.35 | 5.07 | 11.19 | 14.93 |
| SP/consensus (4) (EPS%) | - | - | 104 | 148 | - |
| EPS growth (% YoY) | nm | 81.5 | 16.6 | 120.5 | 33.4 |
| PE (x) | 71.8 | 39.5 | 33.9 | 15.4 | 11.5 |
| Dividend yield (%) | 0.4 | 0.9 | 1.0 | 2.3 | 3.0 |
| FCF yield (%) | (1.1) | (0.4) | 0.4 | 0.9 | 0.2 |
| PB (x) | 4.1 | 3.6 | 3.6 | 3.0 | 2.5 |
| ROE (%) | 6.0 | 9.5 | 10.3 | 21.1 | 23.6 |
| Net debt/equity (%) | 21.9 | 7.9 | (0.1) | (1.1) | 4.1 |
Source: SinoPac
Financials at a glance
| Year to 31 December | 2024A | 2025A | 2026SP | (% YoY) | 2027SP | 2028SP |
|---|---|---|---|---|---|---|
| Profit & Loss (NT$m) | ||||||
| Revenue | 9,771 | 10,860 | 13,199 | 21.5 | 20,531 | 26,733 |
| Cogs (ex-D&A) | (6,710) | (7,317) | (9,157) | (14,566) | (19,258) | |
| Gross Profit (ex-D&A) | 3,061 | 3,543 | 4,042 | 14.1 | 5,965 | 7,475 |
| SG&A and other expenses | (2,043) | (2,227) | (2,313) | (3,085) | (3,923) | |
| Op Ebitda | 1,018 | 1,316 | 1,729 | 31.4 | 2,881 | 3,551 |
| Depreciation/amortisation | (740) | (719) | (758) | (618) | (491) | |
| Op Ebit | 278 | 597 | 970 | 62.6 | 2,263 | 3,060 |
| Net interest inc/(exp) | (62) | (48) | (38) | (38) | (38) | |
| Other non-Op items | 170 | 267 | 114 | (57.4) | 196 | 209 |
| Profit before tax | 387 | 815 | 1,046 | 28.4 | 2,421 | 3,231 |
| Taxation | (43) | (154) | (216) | (460) | (614) | |
| Profit after tax | 344 | 661 | 830 | 25.6 | 1,961 | 2,617 |
| Minority interest | 0 | 0 | 0 | 0 | 0 | |
| Net profit | 344 | 661 | 830 | 25.6 | 1,961 | 2,617 |
| Adjusted profit | 344 | 661 | 830 | 25.6 | 1,961 | 2,617 |
| Cashflow (NT$m) | 2024A | 2025A | 2026SP | (% YoY) | 2027SP | 2028SP |
| Operating profit | 278 | 597 | 970 | 62.6 | 2,263 | 3,060 |
| Depreciation/amortisation | 740 | 719 | 758 | 5.4 | 618 | 491 |
| Working capital changes | (184) | 29 | (379) | (1,451) | (2,140) | |
| Other items | 137 | (134) | (150) | (311) | (451) | |
| Net operating cashflow | 971 | 1,210 | 1,199 | (0.9) | 1,119 | 960 |
| Capital expenditure | (1,253) | (1,308) | (1,075) | (855) | (887) | |
| Free cashflow | (283) | (98) | 124 | 264 | 73 | |
| M&A/Others | 137 | 324 | 0 | 0 | 0 | |
| Net investing cashflow Increase inloans | (1,117) | (984) | (1,075) | (855) - | (887) - | |
| Dividends | 62 0 | 508 (112) | 1,000 | 96.9 | (292) | (689) |
| Net equity raised/other | (43) | (252) | (239) 0 | 0 | ||
| 0 | ||||||
| Net financing cashflow | 19 | 144 | 761 | 427.5 | (292) | (689) |
| Incr/(decr) in net cash | (127) | 370 | 139.1 | (28) | (616) | |
| Exch rate movements | 70 | 112 | 885 0 | 0 | 1 | |
| Balance sheet (NT$m) | 2024A | 2025A | 2026SP | (% YoY) | 2027SP | 2028SP |
| Cash & equivalents | 2,001 | 2,483 | 3,368 | 35.6 | 3,341 | 2,725 |
| Accounts receivable | 3,352 | 3,331 | 3,473 | 4.3 | 5,133 | 7,426 |
| Other current assets | 1,537 | 1,597 | 2,640 | 65.3 | 3,957 | 5,098 |
| Fixed assets | 4,415 | 4,871 | 5,136 | 5.4 | 5,526 | 6,104 |
| Investments | 1,023 | 1,267 | 888 | (29.9) | 888 | 888 |
| Intangible assets | 154 | 140 | 140 | 0 | 140 | 140 |
| Other non-current assets Total assets | 1,115 | 1,161 14,849 | 1,161 16,808 | 0 13.2 | 1,161 20,146 | 1,161 23,544 |
| Short-term debt | 13,596 | 1,169 | 28 | 1,037 | 1,040 | |
| Accounts payable | 428 1,961 | 913 2,016 | 2,833 | 40.5 | 4,338 | 5,643 |
| Other current liabs | 1,127 | 1,086 | 1,076 | (1) | 1,096 | 1,086 |
| Long-term debt/CBs | 2,991 | 2,194 | 2,194 | 0 | 2,194 | 2,194 |
| Provisions/other LT liabs | 628 | 706 | 880 | 24.7 | 1,156 | 1,328 |
| Shareholder funds | 6,260 | 7,726 | 8,447 | 9.3 | 10,117 | 12,045 |
| Minorities/other equity | 202 | 208 | ||||
| 208 | 0 | 208 | 208 | |||
| Total liabs & equity | 13,596 | 14,849 | 16,808 | 13.2 | 20,146 | 23,544 |
| Ratio analysis | 2024A | 2025A | 2026SP | (% YoY) | 2027SP | 2028SP |
| Revenue growth (% YoY) | 15.1 | 11.1 | 21.5 | 55.5 | 30.2 | |
| Ebitda margin (%) | 10.4 | 12.1 | 13.1 | 14.0 | 13.3 | |
| 2.9 | 5.5 | 7.4 | 11.0 | 11.4 | ||
| Ebit margin (%) Net profit growth (%) | nm | 92.2 | 136.3 | 33.4 | ||
| Op cashflow growth (% YoY) | 46.3 | 24.7 | 25.6 (0.9) | (6.6) | (14.2) | |
| Capex/sales (%) | 12.8 | 12.0 7.9 | 8.1 | 4.2 | 3.3 | |
| Net debt/equity (%) (x) | 21.9 1.4 | 0.5 | (0.1) - | (1.1) - | 4.1 0.1 | |
| Net debt/Ebitda ROE (%) | 6.0 | 9.5 | 10.3 | 21.1 | 23.6 | |
| ROIC (%) | 3.5 | 6.3 | 9.3 | 19.2 | 20.9 |
Source: SinoPac
Meh Each setof power cablesfor Bloomcarries dollar content of US$80-100k ACES holds at least a 30% share We expect power cablesfor Bloom to grow 441%/59% in 2027/28
Bloom delivers compelling time-to-power
Bloom Energy the keyearnings driver in 2027
We see tremendous advantages for ACES from Bloom Energy's strongdemand backed by itsaggressive expansion plan. ACES supplies inner power cables used inside each fuel cell in 2026 and will begin supplying external diesel locomotive (DLO) cables that connect fuel cellstacks into a fuel cell module(energy server). Each set (including inner cable and external cable) carries dollar content of US$80-100k.
Furthermore, ACES has worked with Bloom on high-voltage power cablesfor SOFC for around sixyears, even thoughthe real contribution didnottranspireuntil 2026. On the back of this long-standing relationship, ACES is the key supplier during the development phase and holds at least a 30% share inthe mass productionstage. Together with these considerations, we expect inner cablestocontribute revenue of NT$5,113m/NT$8,074m in 2027/28, while external cables will add revenue of NT$707m/NT$1,154m.
Figure 1
Source: SinoPac
Aspower scarcity remains the key bottleneckfor AIdatacentreconstruction, Bloom serves as asuitable solutionand offers fuel cell systems that generate electricity from natural gas. Its modular, on-site, 24/7 power platform stands apart in the power sector. Against a conventional grid built on centralised generation, Bloom delivers compelling time-to-power, cleanerair and water emissions profile, native-DC compatibility with emerging 800V AI datacentrearchitectures, and a solution that communities and nearby residents accept more readily.
Figure 2
Bloom Energyoverview
Source: Bloom Energy
We expect Bloom to increase capacity from 2GW to 4GW/6GW in 2027/28
Figure 3
As of year-end 2025, Bloom's product backlog grew about 140% YoYto roughly US$6bn. Amid the surgingdemand, Bloom is improving backlog conversion and stepping up capacity expansion to capture the strong growth opportunity. In 2Q26, Bloom raised its full-year revenue guidance to US$3.9-4.2bn, up from US$3.4-3.8bn, and plans to double annual capacity from about 1GW in 2025, split across its California and Delaware sites, to 2GW by the end of 2026; and will further expand the capacity to 4GW/6GW in 2027/28, based on our channel checks.
Figure 4
Source: SinoPac Source: Sinopac We believe Bloom has greatpotential. On September 2026, Bloom announced that it leased a 158,000-square-foot facility at Encyclopedia Circle to expand its manufacturing operations.The size of the new facility is notable sinceit is nearly The newly leased facility could add another 5 GW, implying a long-term capacity potential of up to 10 GW
Figure 5
as large as Bloom's existing 164,000-square-foot manufacturing plant in Fremont. The existing plant can ultimately accommodate approximately 5GW of annual production capacity, which suggests the newly leased facility could add another 5GWfor fuel cell stacks, implyinga long-term capacity potential of up to10GW. Given the multiyear partnership that secures ACES's share, we have strong conviction that ACES is well positioned to benefit from Bloom's capacity expansion.
Figure 6
Source: LoopNet
Figure 7
BloomEnergypotential new facilitysite
Source: LoopNet, Sinopac
Source: SinoPac, Google Maps
We view Bloom's growth as sustainable, supported by favourable industry tailwinds. On financing, Bloom and Brookfield are partnering to develop AI datacentrepower DLO high-voltage cables launch might add another NT$707min revenue The power cable portfolio includes inner cable and external cable infrastructure, with Bloom providing its fuel cell-based power generation systems and Brookfield providing capital and infrastructure development capabilities. The strategic financing framework expanded on June30, 2026, from the original $5bn(October 2025) to $25bn, a fivefold increase. On customer wins, Nebius dropped its previously planned gas and combustion turbines in May 2026 and switched to Bloom's SOFC solution, signing a 10-year master agreement worth up to $2.6bn. The first phase covers 328MW of installed capacity, or roughly 250MW of guaranteed capacity, and is expected to come online within 2026. Bloom also expanded its Oracle contract from an initial 1.2GW to up to 2.8GW and signed deals including AEP (up to 1 GW) and Equinix (over 100 MW across 19 datacentres), broadening its customer base materially.
Wide range of power cable products
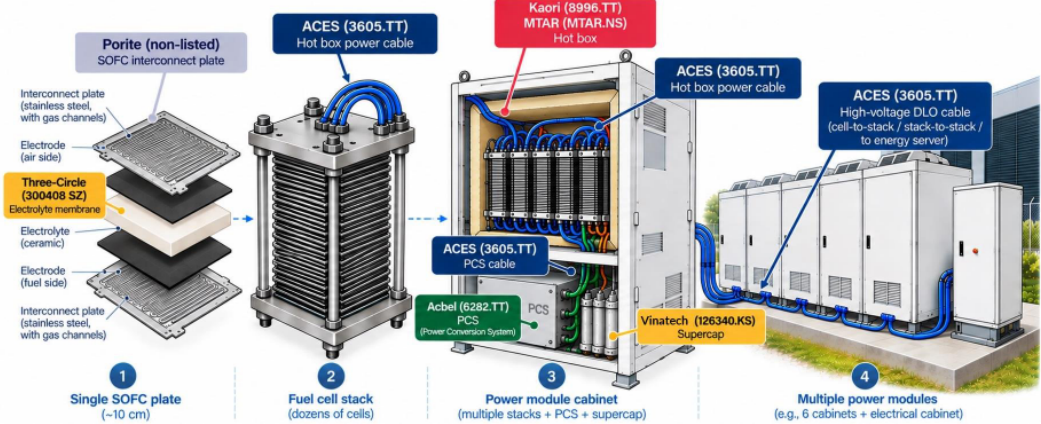
ACES supplies Bloom with a variety of power cables across different specifications, including Power Conversion System (PCS) cables, hot box cables and Diesel Locomotive (DLO) high-voltage cables, rather than a single product type. In 2026, ACES only supplies PCS cablesandhot boxcables, while the company will expand its product offerings to DLO high-voltage cables from2027, which we expect to contribute another NT$707mof sales for the whole year.
The PCS cables and hot box cables are the inner power cables. Hot box cables interconnect individual fuel cells within the hot box,where power generation creates significant heat and therefore requires materials with higher durability and heat resistance.Kaori and MTAR supply hot boxes for fuel cell power generation systems, which require ACES's hot boxcables as one of their key components.
On the other hand, PCS cables are installed inside the Power Conversion System (PCS) and are supplied to AcBel, a PCS solution provider. The PCS converts DC output into usable power and manages load changes. As SOFCs generate DC power with voltage varying according to load, the output cannot be directly connected to a datacentre.
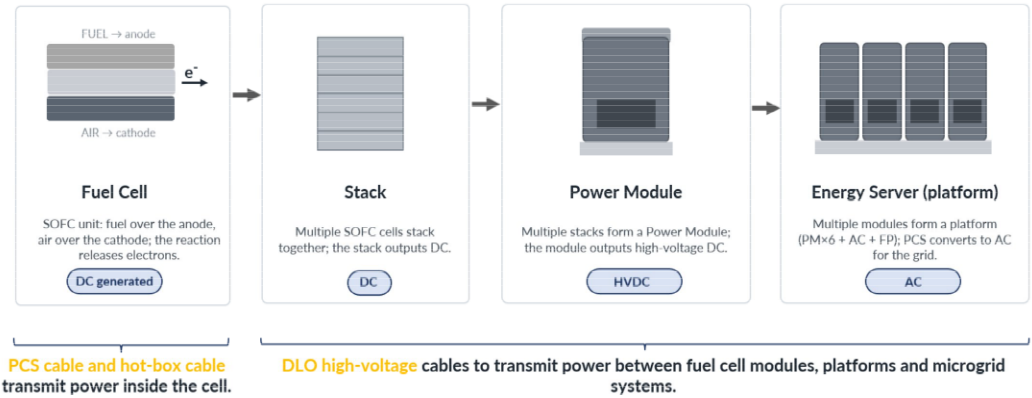
The external power cable portfolio is mainlyDLO high-voltage cables, which transmit high-voltage DC power between fuel cell platforms, power modules and microgrid systems. As external cables need to withstand higher voltage levels, their dollar content is expected to be slightly higher than that of inner power cables.
Lastly, ACES also ships cables directly to Bloom Energy for development purposes.
Figure 8
ACES power cable productand Bloom energy suppliers
Source: SinoPac, Bloom Energy
Figure 9
ACES supplies Bloom with a variety of power cables across different specifications
Source: SinoPac
DLO high-voltage cable opportunityheading into 800V DC era
We also see DLO cables, which are currently used outside the fuel cell, as having significant potential after introducing 800V architecture. Under conventional AC architecture, grid power, onsite turbines and reciprocating engines supply AC power, and the downstream transformer, switchgear and UPS cablesbelong to the utility/EPC supply chain, which ACES does not address. Bloom candeliver native DC power directly to the rack, so the DC output cables might become part of Bloom's system. We see this opening as a new content opportunity for ACES as a qualifiedhigh-voltage power cable supplier.
Within Bloom'senergy server under 800V architecture, the longer series stack of fuel cellsand the replacement of the inverter with DC-DC conversion require a redesign of the internal harness to high-voltage specifications, which we believe positions ACES to ship a growing volume of high-voltage DLO cablesover time.
Figure 10
800V DC architecture
Today's AI 48V Data Centers
Future AI 800V Data Centers
Source: SinoPac, TrendForce
We expect ACES's server business togrow 107%in 2026
Expect server revenue to grow a further 74%/33% in 2027/28SP
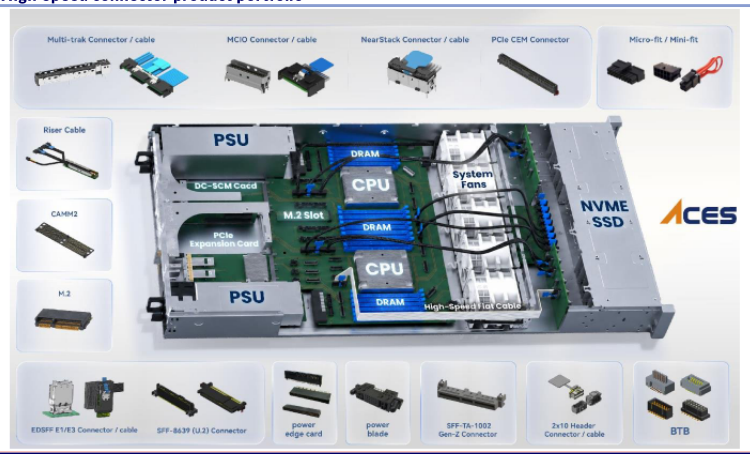
High speed connector products includemultitrack, board-to-board and E1/E3 connectors
High-speed products anew driver
In 3Q24, ACES passed product qualification with ODMs for the high-speed connectors used on Nvidia GB200 networking cards (NICs) and accelerator cards, marking its move from traditional PC peripherals into the server space and Nvidia supply chain. In2025, server revenue accountedfor 10% of ACES's total revenue.
Looking ahead, we expect ACES's server business togrow 107%in 2026, thanks to its new product offerings, higher content per rackofhigh-speed products, and strongcontribution from two major ASIC customers.Lookingahead, with the new connector capacity comingonline and increasing ASP driven by connector spec upgrade, we expect server revenue to further grow 74%/33% in 2027/28SP.
Figure 11
Source: SinoPac
Figure 12
High-speedconnectorproduct portfolio
Source: ACES
Connectors for ASIC carry up to 3x usage
ACES broadeningits connector product offerings in 2026
Figure 13
Broadening connector footprint in ASICs
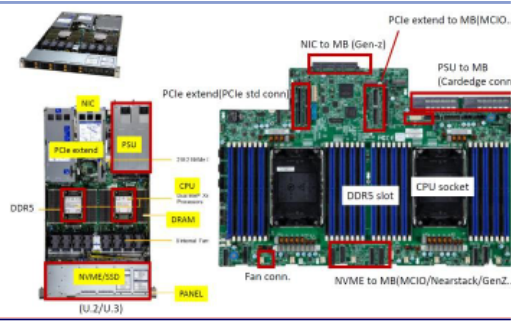
Since Nvidia has strict control overits supply chain, ACES previously supplied only the daughterboard high-speed connectorsfor GB200/300 servers, at roughly 10 to 20 units per rack. On ASIC platforms, since ODMs have greater influence over supplier selection, ACES secures share on both the motherboard and the daughterboard, lifting content to around30 units per rack.
Besides, ACES historically supplied only MCIO connectors to these ASIC customers, but as further qualifications clear, the company will broaden its connector product offerings in 2026 to include Multi-Track, board-to-board, and E1/E3 connectors. We expect the contribution from ASIC customers to scale further in 2H26, driving server revenue to grow 64%HoH.
Figure 14
ACES high-speed connector content per rack increase
ACES provides MCIO and a wide range of high-speed connectors
Source: SinoPac
Migration from Gen5 to Gen6 is the first major shift since 2022
Source: ACES
Riding the Gen6 ASP curve with a compatibility advantage
Aside from the spectacular growth in the connector shipments, weexpect ACES to benefit from the ongoing Gen6 connector upgrade cycle, with ASPs expected to increase by 15%. The AI server trays currently adopt a mix of Gen5 and Gen6 connectors, but we expect the penetration of Gen6 connectors to gradually increase going forwardas the migration from Gen5 to Gen6 is the first major generational shift since Genoa introduced Gen5 in 2022.
Gen6 connector ASP is 15% higher than Gen5
Only 3-4vendors are qualified by CSPs at Gen6
PCIe has been used inonboard and in-chassis interconnects
Each generation upgrade raisesbarriers to entry
Figure 15
Source: SinoPac
Only three to four connector vendors are qualified by CSPs at Gen6, and ACES is one of them.Furthermore, ACES can supply both Gen5 and Gen6platforms under its existing qualification, with no need to re-sample or re-qualify for Gen5. This is becauseGen6 connectors keep footprint backward compatibility with Gen5. By contrast, other peers must re-sample and run through the full qualification process again to move up to Gen6.
About the PCIe migrationand Gen6 spec upgrade
PCIe has long been used for on-board and in-chassis interconnects. In the Vera Rubin platform, PCIe Gen6 serves as the in-tray bridge to front-of-tray modules such as CX-9 SuperNICs, BlueField-4 DPUs and NVMe storage. GPU-to-GPU scaleup runs on NVLink, with UALink as the open alternative; these fabrics work alongside PCIe.
In order to address ever-larger training models, the PCIe must scale with the fastgrowing size of model parameters and datasets. The move from Gen5 to Gen6 is not a simple speed doubling, even though per-lane bandwidth rises from 32 GT/s to 64 GT/s. It reworks the link from the coding scheme up. Gen1 through Gen5 doubled I/O speed using NRZ signaling. Gen6 switches to PAM4 four-level signaling and, for the first time, adds FEC (Forward Error Correction), which lets the receiver detect andcorrect transmission errors on its own.
Each generation doubles bandwidth while tightening signal-integrity specs, which demands higher-precision connector manufacturing. This creates a real barrier to entry for high-speed connector suppliers.
Figure 16
Figure 17
Source: Marvell
Figure 18
Source: Marvell
| Migration comparison: PCIe 4/5/6 - Feature | Migration comparison: PCIe 4/5/6 - PCIe 4.0 (Gen 4) | Migration comparison: PCIe 4/5/6 - PCIe 5.0 (Gen 5) | Migration comparison: PCIe 4/5/6 - PCIe 6.0 (Gen 6) |
|---|---|---|---|
| Data Rate per Lane | 16 GT/s | 32 GT/s | 64 GT/s (2x Gen 5) |
| Signalling Technology | NRZ | NRZ | PAM4 (Pulse Amplitude Modulation, 4 levels) |
| Encoding | 128b/130b | 128b/130b | FLIT-based (256-byte fixed-size packets) |
| Error Correction | Basic CRC | Basic CRC | Forward Error Correction (FEC) + CRC |
| Bandwidth per Lane (uni-directional) | ~2 GB/s | ~4 GB/s | ~8 GB/s |
| Total Bandwidth x16 (bi-directional) | 64 GB/s | 128 GB/s | 256 GB/s |
| Power Efficiency | Basic | Basic | Introduced L0p low-power state for scal ing |
| Security Enhancements | None | CMA, IDE (added via PCIe 5.0 ECN) | Enhanced IDE (FLIT-mode, partial header encryption) |
| Target Applications | High-end gaming, SSDs, etc. | AI/ML, HPC, high-performance storage; content creation and demanding workloads | Advanced AI, 800G Ethernet, NVMe, CXL |
| Adoption | Mature, widely adopted | Mainstream, datacentrestandard | Emerging, ramping in AI/datacentre |
| Spec Release | 2017 | 2019 | 2022 |
| Backward Compatibility | Backward compatible with previous versions | Backward compatible, optimised on newer hardware | Full compatibility with earlier gens |
Source: SinoPac
Figure 19
| Core highlights of PCIe Gen6 - Core upgrade | Core highlights of PCIe Gen6 - Before/challenge | Core highlights of PCIe Gen6 - Why it matters |
|---|---|---|
| PAM4 encoding (2x bandwidth) | NRZ: two levels (0/1), 1 bit per cycle | Doubles the rate to 64 GT/s (256 GB/s x16 bi-dir) with no frequency increase -same Nyquist as Gen 5 -avoiding severe high-frequency signal loss |
| FEC error correction | PAM4's fine voltage steps are noise- sensitive, pushing BER far above NRZ | Lightweight FEC + CRC-retry design keeps added latency near zero, unlike typical FEC |
| FLIT packaging | Variable packet sizes | Simpler decoding and near-0% encoding overhead, boosting real throughput |
| L0p low-power state | Saving power meant restartingthe whole link | Idle lanes sleep on demand while active lanes keep running -saves power without dropping the connection |
Source: SinoPac
Figure 20
ACES high-speed cable product offerings
Source: ACES
High-speed cablesemergingas a potential driver
ACES previously supplied connectors only. After several years of effort, its Gen6 PCIe cable has now been qualified by two CSP clients, and the company began shipping the in-rack cable product in April 2026. We expect high-speed cable shipments to enlarge after the new capacity comes online and more CSP orders in 2H26.Hence, we expect high-speed cable revenue to grow from NT$268m in 2026 to NT$793/NT$982m in 2027/28.
Currently, its high-speed cable product carries gross margin of merely 20%, but it is likely to edge up to around 30% as the scale enlarges,and yield improves.
Source: SinoPac Connector capacity is set to rise from 4m units/month to 5m units/month ACES expects connector shipments to reach 50m units in 2027
Figure 22
Capacity in place ahead of demand
ACES is rapidly expanding its high-speed cable and connector capacity, with highspeed cable production lines expected to increase from two in 2025 to eight in 2H26, while itwillproactively ramp up connector monthly capacity from 4m units in July 2026 to 5m units by the end of 2026 to address customer demand ahead of order placement.
Supported by strong customer demand and sufficient capacity, ACES expects total connector shipments to reach 25m units in 2H26 and 50m units in 2027, representing a significant increase from 15m units in 1H26.
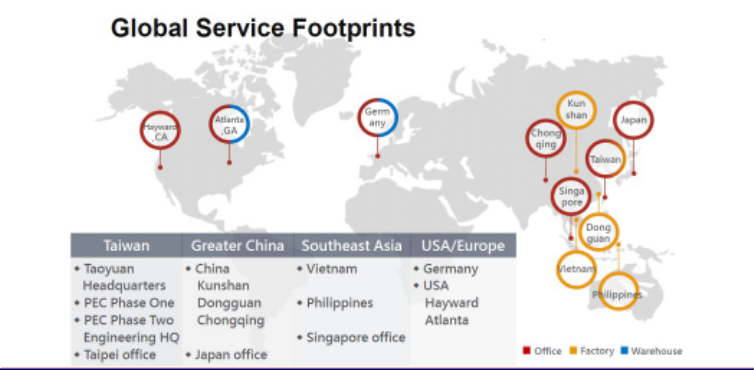
As for power cablesfor Bloom Energy, ACEShas leased a new facilitynext to its Philippine plant, with the new power cable capacity planned to come online in 4Q26.
Figure 23
Figure 24
ACES global production footprint
Source: ACES
Source: ACES, SinoPac
Source: ACES, SinoPac
ACEShas manufacturing facilities across key regions worldwide
Networking: stable growth
Figure 25
Diversified growth engines
ACES's networking product portfolio includes set-top boxes, WiFi devices, routers, and other networking equipment. We expect the business to benefit from technology upgrades and equipment replacement driven by advances in wireless communications, IoT, cloud computing, and cybersecurity. However, tariff and inflationary pressures, together with component shortages among Asian customers, are likely to limit growth. We expect networking product revenue to grow by 34% and 14% in 2026 and 2027, respectively.
Figure 26
Source: ACES
Source: SinoPac
Automotive: rising electronic content
ACES's product range spans ADAS, reversing radar and camera, body control, smart cockpit, smart antenna, and high-voltage connectors and harnesses, extending into applications such as EV charging guns. It has entered a US EV major as well as European and Chinese Tier-1 supply chains. Going forward, it will continue to focus on high-voltage, high-frequency, and high-speed connection technologies. The company expects the automotive sector to stay flat in 2027 to reflect muted demand and limited internal resource allocation, as itfocuseson AI-related business at this stage. In the long-term,growth from the automotive sector will bedriven by ADAS upgrades, which liftsdemand for sensors and compute, alongside rising EV penetration, which adds high-value electronic systems and power semiconductor content.
Figure 27
ACES Automotive product portfolio
Source: ACES
Figure 29
ACES Industrial product portfolio
Source: ACES
Source: SinoPac
Muted 2026, with Windows 12 driving a replacement cycle in late 2027
Industrial: asteady UPS-driven base
ACES supplies industrial power cords, used mainly in uninterruptible power systems (UPS). A UPS is an electrical device that acts as a reliable buffer when the main power supply behaves abnormally, such as during a fault, outage, or unstable voltage. It keeps automation controllers, sensors, and actuators continuously powered so equipment keeps running. When a power problem occurs, the UPS supplies stable backup power to prevent equipment failure, data corruption, or system crashes. We expect ACES's industrial business to grow steadily, with growth of 9% and 14% in 2026 and 2027, respectively.
Notebookand Consumer
Under the twin pressures of softening end-consumer demand and continued supply-chain cost increases, we expect ACES's full-year NB revenue to decrease 12%in 2026 and return to a growth trajectory in 2027. However, we remain cautiously optimistic about 2027 withthe launch of Windows 12, combined with easing component shortagesand broader AI adoption, which should drive consumer replacement demand, lifting global NB shipments -5%/5%year over year in 2027/28, which is a gradual recovery following a weaker 2026.
Figure 31
Figure 32
Global NB shipment forecast
ACES Consumerproduct portfolio
Source: SinoPac
Source: ACES
We expect NB and Consumer to return to a growth trajectoryfrom 2027
ACES has long-standing relationship with Schneider Electric
ACES ramped-uphighvoltage power cables for power racksin 2Q26
Figure 33
Source: SinoPac
Diversifying into new growth opportunities
We found that ACES is diversifying its products'end-application by developing new specification and engagingwith new clients. Hence, we believe in its long-term balanced growth.
Power rack: leveraging its long-standing relationshipwith Schneider
ACES hasalong-standing relationship with Schneider Electricatits Philippineplant. The partnership dates back more than 20 years, with ACES's Philippine plant initially serving Schneider almost exclusively. Over the years, the product portfolio has expanded from conventional power cables to uninterruptible power systems (UPS) and, more recently, power racks for AI datacentres.
ACES began shippinghigh-voltage power cables for power racks in1Q26 and entered the volume ramp-up phase in 2Q26.We remain positive on power rack adoption as the PSU in every IT tray hits a physical limitas rack power reaches 1MW, occupiesrack space and capscompute density. Moving power shelves and BBU/CBU into a dedicated power rack decouples power from computing and frees
PSU/Power Shelf moved to Power Rack
Schneider showcased power rack product at Computex 2026
the IT rack for near-full compute use. It also enables 800V HVDChigh-voltage delivery cuts current and I²R losses, lifting efficiency from the 48V era's 80-90% towards >90%, while scaling per-rack power module and high-voltage cable content.Given the industry trendof increasing in-rack space density and surging single-rack voltage, we expect ACES's high-voltage power cable business to continue growing.
Figure 34
Source: SinoPac, TI, Tech news
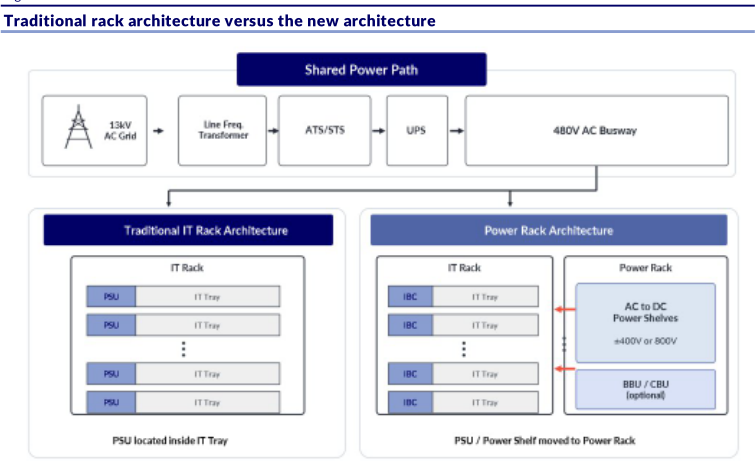
Figure 35
Schneider power rack product
Source: SinoPac
Figure 36
| ACES product portfolio - Product category | ACES product portfolio - 2Q26 revenue breakdown | ACES product portfolio - Average GM | ACES product portfolio - Product application |
|---|---|---|---|
| Industry | 21% | 15% | UPS and IPC |
| Networking | 15% | 30-35% | Signal set-topbox, WiFi routeranddevices |
| Server | 16% | 35-40% | MCIO, Multi-Track, board-to-board, and E1/E3 connectors |
| High-voltage cable for Bloom | 4% | 20% | PCS cables, hot-boxcables and DLO high-voltage cables |
| Automotive | 4% | 15% | ADAS, Intelligent Cockpitand Vehicle-to-Everything(V2X) |
| Consumer and NB | 40% | 20-25% | Smartphone and Notebook |
Source: SinoPac
TP of NT$270
Initiate with an Outperformrating
We initiate coverage ofACES with an Outperformrating given its dual growth engine from Bloom's strong expansion and high-speed connectorcustomer wins and generation upgrades. We forecast 2027/28 EPS of NT$11.19/NT$14.93, with our 2027 forecast48% ahead ofconsensus. Our TP of NT$270is based on 20x 2H27-1H28SP PE, backed by a 72% EPS Cagr in 2026-28SP driven by Bloom's significant ramp and larger content in server products. Initiate coveragewith an Outperform rating.
Company profile
ACES was founded in 1996,and it mainly produces connectors, micro-coaxial cable, high-speed transmission cables, and RF connectors. Connectors and cable assemblies link two separate subsystems or operating units and carry the signals between them, allowing the overall system to function properly. They are used across a wide range of electronic products, with main applications spanning notebooks and PC peripherals, consumer electronics, automotive electronics, cloud servers, networking equipment, and industrial equipment.
To keep pace with the push towards lighter, thinner, and smaller notebooks and consumer devices, ACES developed high-temperature-resistant, fine-pitch, and low-profile productsat an early stage. At the same time, it is moving actively into the high-frequency, high-speed connectors, high-speed cables, and power supplies required for cloud servers, as well as the connector and cable assemblies used in automotive electronics.
AI-relatedproduct contribution increasing
ACES has leveragedM&A to gain new capabilities, plants and technology
Figure 37
Source: SinoPac
Company development
ACES has used M&A well to gain new capabilities, plants and technology, which in turn opened doors to new customers and markets. In 2015, it bought MEC IMEX to add cable assembly capability and a plant in the Philippines, which took it into the industrial market. In 2017, the CPC deal gave it access to the European auto connector market and a plant in Vietnam. In 2019, it bought Kuang Ying to add metal stamping capacity and reach Taiwan telecom customers. The key deal came in 2021, when ACES bought 100% of Genesis, a US high-speed interconnect maker based in Atlanta. The main goal was to gain Genesis's long-standing ties with US CSP and cloud customers. In 2025, ACES opened its Phase Two R&D headquarters in Taoyuan, which focuses on cloud connectors and high-speed cables. We believe 10years of M&A have turned ACES from a consumer connector maker into a supplier of high-speed interconnect solutions for AI servers and the cloud.
| Figure 38 | Figure 38 | Figure 38 | Figure 38 | Figure 38 |
|---|---|---|---|---|
| ACES M&A activity | ACES M&A activity | ACES M&A activity | ACES M&A activity | ACES M&A activity |
| Year | Type/entity | Capability gained | Market entered | Representative products |
| 2011 | Establishment | Precision connector manufacturing capability | Core connectors | Board connectors |
| 2015 | M&A -MEC | Cable assembly product-line manufacturing capability | Industrial | Wire harness/cable assembly |
| 2017 | M&A -CPC | European automotive connector capacity | European Automotive | FAKRA automotive RF connectors |
| 2019 | M&A -KY | Metal stamping-part manufacturing capability | Taiwan Telecom | Stamping parts |
| 2021 | M&A -Genesis | High-speed cable technology | US Telecom/ Server | High-speed cable/ SlimSAS |
| 2025 | R&D expansion | 2 RD HQ for Cloud-computing connector/high-speed cable | Cloud/ Datacentre | High-speed backplane connector |
Source: SinoPac, ACES
Shareholding structure
ACES's shareholding structure is relatively stable, with the top 10 owningabout 30%, including Directors andSupervisors' total share of 9%. Foreign investor holdings have increased since the company entered the high-speed connectors industry andwere around 22% in August 2026.
Foreign investors hold about 22% of shares
ASIC customer winsto help server revenue grow 74% YoY in 2027SP
Figure 39
| Top-10 shareholders | Top-10 shareholders - Holding % |
|---|---|
| Yuan Wan-Ting(Chairman) | 5.28 |
| Keyan Investments Co., Ltd. (owned by Chairman's family) | 3.98 |
| Hsu Chang Fei (Chairman's spouse) | 3.76 |
| Wei Ji Investments Co., Ltd. | 3.55 |
| Deutsche Bank AG & Albula Investment Fund | 3.54 |
| CITI & HK First Securities Agent Invest | 2.97 |
| Yuan Hsiang Feng(Chairman's family) | 2.89 |
| Taishin International & Aces Electronics | 1.92 |
| LiaoMing Shan | 1.25 |
| Yuan Chen Ting(Chairman's family) | 1.05 |
| Top-10 shareholders | 30.19 |
| Director andsupervisors | 9.05 |
Source: SinoPac
Figure 40
Source: TEJ, Sinopac
Financial forecasts
We forecast sales to rise by 22%/56%/30%in 2026/27/28, fueled by robust highspeed connector shipmentsfrom2H26, rising Gen6 penetration that drives highspeed connector ASP expansion, and Bloom's sustained, large-scale capacity expansion, which should provide a durable growth engine.
AI productsales, both connectors and cables,will make a more meaningful revenue contribution in 2H26SPgiven ACES'sbroadening ASIC customer base. We expect shipment contribution from high speed connectors andcables to help its server revenue grow a further 107%/74%YoY into 2026/2027.
Growth rate of sales to accelerate from 2026SP
Both GM and OPM steadily improving
Figure 41
Source: SinoPac
Giventhehigh-speedconnectors carry higher gross margin of 40% and cable's GM keeps improving with the learning curve, we forecast ACES's GM to expandfrom 24.9% in 2026to 26.0%/26.1%in 2027/28, partially offset by the strong power cables ramp which may dilutethe overallgrowth margin.
| Figure 42 GM and OPM | Figure 42 GM and OPM | Figure 42 GM and OPM | Figure 42 GM and OPM | Figure 42 GM and OPM |
|---|---|---|---|---|
| 30% | Blended GM% | OPM% | OPM% | OPM% |
| 25% | 26.0% | 24.9% | 26.0% | 26.1% |
| 20% | ||||
| 15% | 11.0% | 11.4% | ||
| 10% | 5.5% | 7.4% | 7.4% | 7.4% |
| 5% | ||||
| 0% |
Source: SinoPac
Figure 43
| Quarterly P&L - (NT$m) | Quarterly P&L - 1Q26 | Quarterly P&L - 2Q26 | Quarterly P&L - 3Q26SP | Quarterly P&L - 4Q26SP | Quarterly P&L - 1Q27SP | Quarterly P&L - 2Q27SP | Quarterly P&L - 3Q27SP | Quarterly P&L - 4Q27SP | Quarterly P&L - 2025 | Quarterly P&L - 2026SP | Quarterly P&L - 2027SP | Quarterly P&L - 2028SP |
|---|---|---|---|---|---|---|---|---|---|---|---|---|
| Sales | 2,822 | 3,350 | 3,396 | 3,631 | 4,307 | 4,733 | 5,567 | 5,924 | 10,860 | 13,199 | 20,531 | 26,733 |
| Gross profit | 694 | 859 | 839 | 892 | 1,116 | 1,240 | 1,468 | 1,524 | 2,824 | 3,284 | 5,348 | 6,983 |
| Opex | 546 | 613 | 562 | 592 | 664 | 730 | 827 | 863 | 2,227 | 2,313 | 3,085 | 3,923 |
| Operating profit | 147 | 246 | 277 | 300 | 451 | 510 | 641 | 660 | 597 | 970 | 2,263 | 3,060 |
| Non-OP | (4) | 13 | 32 | 35 | 40 | 42 | 37 | 39 | 218 | 76 | 159 | 171 |
| Pretax profit | 143 | 259 | 309 | 335 | 492 | 552 | 679 | 699 | 815 | 1,046 | 2,421 | 3,231 |
| Net profit | 108 | 201 | 250 | 271 | 398 | 447 | 550 | 566 | 661 | 830 | 1,961 | 2,617 |
| EPS (NT$) | 0.67 | 1.22 | 1.53 | 1.66 | 2.27 | 2.55 | 3.13 | 3.23 | 4.35 | 5.07 | 11.19 | 14.93 |
| Growth | ||||||||||||
| Sales QoQ | 4% | 19% | 1% | 7% | 19% | 10% | 18% | 6% | ||||
| Sales YoY | 9% | 20% | 22% | 34% | 53% | 41% | 64% | 63% | 11% | 22% | 56% | 30% |
| EPS QoQ | (19%) | 82% | 26% | 8% | 37% | 12% | 23% | 3% | ||||
| EPS YoY | (51%) | 81% | 4% | 103% | 241% | 110% | 105% | 95% | 73% | 17% | 121% | 33% |
| Margin | ||||||||||||
| Gross margin | 24.6%25.6% | 24.7% | 24.6% | 25.9% | 26.2% | 26.4% | 25.7% | 26.0% | 24.9% | 26.0% | 26.1% | |
| Opex | 19.4%18.3% | 16.6% | 16.3% | 15.4% | 15.4% | 14.9% | 14.6% | 20.5% | 17.5% | 15.0% | 14.7% | |
| OP margin | 5.2% | 7.3% | 8.2% | 8.3% | 10.5% | 10.8% | 11.5% | 11.1% | 5.5% | 7.4% | 11.0% | 11.4% |
| Non-OP | (0.2%) | 0.4% | 0.9% | 1.0% | 0.9% | 0.9% | 0.7% | 0.7% | 2.0% | 0.6% | 0.8% | 0.6% |
| Net margin | 3.8% | 6.0% | 7.4% | 7.5% | 9.3% | 9.4% | 9.9% | 9.6% | 6.1% | 6.3% | 9.6% | 9.8% |
Source: SinoPac
Capex-to-sales ratio of 12%/8%in 2025/26
Free cashflow per share of NT$-0.6/0.8in 2025/26
Figure 44
| Sales mix and GM assumptions | ||||
|---|---|---|---|---|
| Sales (NT$m) | 2025 | 2026SP | 2027SP | 2028SP |
| Industrial | 2,498 | 2,732 | 3,104 | 3,456 |
| Networking | 1,412 | 1,885 | 2,150 | 2,665 |
| Server | 1,118 | 2,319 | 4,025 | 5,353 |
| Power cable for Bloom | - | 1,076 | 5,819 | 9,229 |
| Auto | 543 | 540 | 544 | 560 |
| NB & Consumer | 5,321 | 4,680 | 4,888 | 5,470 |
| Total | 10,860 | 13,199 | 20,531 | 26,733 |
| YoY (%) | 2025 | 2026SP | 2027SP | 2028SP |
| Industrial | 16% | 9% | 14% | 11% |
| Networking | 0% | 34% | 14% | 24% |
| Server | 191% | 107% | 74% | 33% |
| Power cable for Bloom | 0% | 0% | 441% | 59% |
| Auto | (10%) | 0% | 1% | 3% |
| NB & Consumer | 2% | (12%) | 4% | 12% |
| Total | 11% | 22% | 56% | 30% |
| Sales mix (%) | 2025 | 2026SP | 2027SP | 2028SP |
| Industrial | 23% | 21% | 15% | 13% |
| Networking | 13% | 14% | 10% | 10% |
| Server | 10% | 18% | 20% | 20% |
| Power cable for Bloom | 0% | 8% | 28% | 35% |
| Auto | 5% | 4% | 3% | 2% |
| NB & Consumer | 49% | 35% | 24% | 20% |
| Total | 100% | 100% | 100% | 100% |
| Gross margin (%) | 2025 | 2026SP | 2027SP | 2028SP |
| Industrial | 15.0% | 14.7% | 15.0% | 16.0% |
| Networking | 34.0% | 34.2% | 35.0% | 35.0% |
| Server | 35.0% | 37.9% | 42.2% | 42.1% |
| Power cable for Bloom | 0.0% | 20.0% | 20.3% | 20.5% |
| Auto | 18.0% | 14.8% | 15.0% | 15.0% |
| NB & Consumer | 27.8% | 23.5% | 23.9% | 23.3% |
| Total | 26.0% | 24.9% | 26.0% | 26.1% |
Source: SinoPac
Cashflow and balance sheet
ACES's balance sheet shows healthy debt exposure with an improvingnet cash level. Given its plan to massively expand capacity at its Taiwan plants, we expect Capex to remainat a high levelof NT$1,075min 2026and then slightly declineto NT$855m in 2027.We forecast its depreciation-to-sales ratio to be around 3% in 2027, which is at the lowend of its historical level.
We expect ACES's ROE to expand from 10% in 2026 to 21% in 2027 and 23% in 2028, as the volume ramp of AI high-speed connectors and BloomEnergy power cables drives a richer product mix and gross margin expansion, delivering 121% EPS growth in 2027.
We expect ACES's FCF to turn positive in 2026as operating cashflow scales with the AI high-speed connector and Bloom power cable ramp while Capex normalises after the 2026 capacity buildout. Looking ahead, we expect ACES's free cashflow per share to be NT$0.8-1.5in coming years.
Figure 45
Figure 46
Capex and depreciation to sales
Source: SinoPac
Source: SinoPac
Figure 47
Free cashflow per share
Source: SinoPac
Figure 49
Source: SinoPac
Figure 50
Forward PE
Source: SinoPac
Source: SinoPac
Figure 49
| Balance sheet | |||||||
|---|---|---|---|---|---|---|---|
| (NT$m) | 2021 | 2022 | 2023 | 2024 | 2025 | 2026SP | 2027SP |
| Cash & bank deposits | 2568 | 2459 | 2058 | 2001 | 2483 | 3368 | 3341 |
| ST marketable securities | 100 | 0 | 0 | 2 | 70 | 70 | 70 |
| Accounts receivable (trade debtors) | 2991 | 2779 | 2743 | 3352 | 3331 | 3473 | 5133 |
| Inventories | 1663 | 1454 | 1189 | 1394 | 1436 | 2479 | 3796 |
| Prepaid, deferred tax and others | 106 | 141 | 87 | 79 | 95 | 95 | 95 |
| Other currentassets | 166 | 165 | 98 | 141 | 91 | 91 | 91 |
| Total Current Assets | 7595 | 6998 | 6175 | 6969 | 7506 | 9577 | 12525 |
| LT Investment | 1136 | 1130 | 901 | 954 | 1196 | 818 | 818 |
| Gross Fixed | 5869 | 6393 | 6507 | 8040 | 8692 | 9767 | 10622 |
| Unfinished projects | 186 | 706 | 1229 | 1142 | 1575 | 1475 | 1525 |
| Accum. Deprec. | (3227) | (3671) | (3996) | (4768) | (5396) | (6105) | (6621) |
| Fixed assets | 2829 | 3428 | 3741 | 4415 | 4871 | 5136 | 5526 |
| Deferred assets | 78 | 81 | 81 | 69 | 70 | 70 | 70 |
| Intangible assets | 156 | 154 | 192 | 154 | 140 | 140 | 140 |
| Other LT assets | 1079 | 1049 | 1161 | 1036 | 1066 | 1066 | 1066 |
| Total Assets | 12873 | 12840 | 12251 | 13596 | 14849 | 16808 | 20146 |
| Short-term borrowings | 1044 | 1429 | 1467 | 195 | 794 | 794 | 794 |
| Bills Issued | 0 | 0 | 0 | 0 | 0 | 0 | 0 |
| Accounts payable | 1922 | 1624 | 1409 | 1961 | 2016 | 2833 | 4338 |
| Curr. Of L-T Debt | 240 | 1119 | 774 | 233 | 119 | 375 | 243 |
| Others current liabilities | 1337 | 1220 | 1014 | 1127 | 1086 | 1076 | 1096 |
| Total Current liabilities | 4544 | 5392 | 4664 | 3516 | 4016 | 5078 | 6471 |
| Long-term debt | 2059 | 1216 | 1737 | 2991 | 2194 | 2194 | 2194 |
| Deferred Taxations | 302 | 317 | 308 | 356 | 419 | 419 | 419 |
| Other Liabilities | 436 | 260 | 285 | 272 | 287 | 462 | 737 |
| Total Liabilities | 7340 | 7185 | 6994 | 7134 | 6915 | 8152 | 9821 |
| Common Stocks | 1344 | 1344 | 1344 | 1419 | 1624 | 1753 | 1753 |
| Reserves | 1654 | 1691 | 1719 | 2312 | 2962 | 3045 | 3241 |
| Retained earnings | 2555 | 2492 | 2236 | 2529 | 3141 | 3649 | 5123 |
| Others | (21) | 128 | (43) | 202 | 208 | 208 | 208 |
| Shareholder funds | 5532 | 5655 | 5257 | 6462 | 7934 | 8655 | 10325 |
Source: SinoPac
Figure 50
| Cash dividend payout | ||||||
|---|---|---|---|---|---|---|
| (NT$m) Net profit | 2020 251 | 2021 511 | 2022 225 | 2023 (267) | 2024 344 | 2025 661 |
| Payout ratio | 31% | 36% | 33% | 0% | 29% | 36% |
| Cash dividend(NT$) | 0.7 | 1.5 | 0.6 | 0.0 | 0.7 | 1.6 |
| Dividend yield | 0.4% | 0.9% | 0.3% | 0.0% | 0.4% | 0.9% |
Source: SinoPac
ACEShas had a dividend payout ratio of around 29-36% in the past five years, except for 2023, when the company reported a loss. Weexpect to maintain a payout ratio around 35%as the ACES's earnings significantly improved, but the actual dividend payout depends on future investments and business plans.
Figure 51
Source: SinoPac
Figure 52
Figure 53
Source: SinoPac
| Cashflow statement | |||||||
|---|---|---|---|---|---|---|---|
| (NT$m) | 2021 | 2022 | 2023 | 2024 | 2025 | 2026SP | 2027SP |
| Net income | 508 | 223 | (268) | 344 | 661 | 830 | 1,961 |
| Depreciation | 564 | 651 | 651 | 661 | 669 | 709 | 516 |
| Amortization | 29 | 48 | 55 | 78 | 50 | 49 | 102 |
| Change in working cap. | (520) | (27) | 0 | (184) | 29 | (379) | (1,451) |
| Investment income | (31) | (10) | 11 | (3) | 37 | (10) | (9) |
| Others non-cash op | 219 | 298 | 214 | 74 | (236) | - | - |
| Cash flow from operation | 769 | 1,183 | 663 | 971 | 1,210 | 1,199 | 1,119 |
| Capex | (1,020) | (1,116) | (887) | (1,253) | (1,308) | (1,075) | (855) |
| LT investment decrease (increase) | (217) | (17) | 21 | - | 378 | - | - |
| ST investment decrease (increase) | 243 | 74 | 22 | (36) | (58) | - | - |
| Others CFI | 111 | (76) | (206) | 173 | 3 | - | - |
| Cash flow from investment | (883) | (1,136) | (1,050) | (1,117) | (984) | (1,075) | (855) |
| ST borrowing | (159) | 354 | 52 | (1,272) | 599 | - | - |
| LT borrowing | 314 | 16 | 150 | 336 | (91) | - | - |
| Bonds Issued | 603 | - | - | 999 | - | 1,000 | - |
| Bonds Redeemed | - | - | - | (1) | - | - | - |
| Dividend paid | (86) | (202) | (74) | - | (112) | (239) | (292) |
| Dir.&Emp.Bonus | - | - | - | - | - | - | - |
| Others CFF | 328 | (207) | (85) | (43) | (252) | - | - |
| Cash flow from financing | 1,000 | (39) | 43 | 19 | 144 | 761 | (292) |
| Net change in cash | 887 | 8 | (343) | (127) | 370 | 885 | (28) |
| Exchange Influence | (59) | (117) | (57) | 70 | 112 | - | - |
| Beginning cash | 1,740 | 2,568 | 2,459 | 2,058 | 2,001 | 2,483 | 3,368 |
| Ending cash | 2,568 | 2,459 | 2,058 | 2,001 | 2,483 | 3,368 | 3,341 |
Source: SinoPac
ACES Enters from Gen6 with Vertical Integration and flexible leadtime
CSPs are searching for a supplier able to provide both connectorsand cables
Competitive positioning
In high-speed connectors, ACES competes primarily withoverseas peers including Amphenol (APH), TE, and Molex. APH's edge lies in a development-technology lead of one to two generations, while ACES's relative strength rests on customers'recognition ondeliveringquality comparable to the overseas majors, alongside more flexible lead times, strong capacity-expansion support, and fast ramp-up.
The structural opportunity comes from the supply chain integration trend. As transmission speeds rise, CSPs increasingly prefer suppliers which canintegrate highspeed connectors with high-speed cablesand ship assembled,finished goods.
ACES is one of the few Taiwanese players with this vertical-integration footprint
Gen6suppliers include ACES, APH,TE, andLotes
Figure 54
| Peer comparison | Peer comparison | Peer comparison | Peer comparison | Peer comparison | Peer comparison | Peer comparison | Peer comparison | Peer comparison | Peer comparison | Peer comparison | Peer comparison | Peer comparison | Peer comparison | Peer comparison | Peer comparison |
|---|---|---|---|---|---|---|---|---|---|---|---|---|---|---|---|
| Company | Code | Mkt Cap (US$bn) | Rec | Earnings growth (%) | Earnings growth (%) | PE (x) | PB (x) | ROE (%) | |||||||
| 26SP | 27SP | 28SP | 26SP | 27SP | 28SP | 26SP | 27SP | 28SP | 26SP | 27SP | 28SP | ||||
| Taiwan | |||||||||||||||
| ACES | 3605 TT | 0.93 | O-PF | 17 | 121 | 33 | 33.1 | 15.0 | 11.3 | 3.5 | 2.9 | 2.4 | 10 | 21 | 23 |
| Bizlink | 3665 TT | 18.2 | O-PF | 50 | 94 | 20 | 37.7 | 19.9 | 16.5 | 9.5 | 6.8 | 5.2 | 27 | 40 | 36 |
| Longwell | 6290 TT | 1.5 | N-R | 23 | 11 | na | 28.6 | 25.8 | na | 5.0 | 4.9 | na | 18 | 20 | na |
| Lotes | 3533 TT | 6.5 | HLD | 11 | 19 | 29 | 24.0 | 20.1 | 15.6 | 4.7 | 4.2 | 3.6 | 21 | 22 | 25 |
| Alltop | 3526 TT | 0.6 | N-R | 25 | 33 | na | 16.0 | 12.8 | na | 4.5 | 4.1 | na | 32 | 42 | na |
| Argosy | 3217 TT | 0.4 | N-R | 2 | 9 | na | 10.3 | 10.0 | na | 2.4 | 2.4 | na | 29 | 31 | na |
| JPC | 6197 TT | 1.3 | N-R | 83 | 42 | na | 30.0 | 21.1 | na | 8.3 | 5.8 | na | 29 | 52 | na |
| Foreign | |||||||||||||||
| Amphenol | APH US | 211.3 | N-R | 60 | 23 | na | 51.5 | 32.1 | 23.1 | 16.0 | 11.7 | 8.5 | 41 | 38 | 32 |
| TE Connectivi ty | TEL US | 63.0 | N-R | 31 | 14 | na | 25.3 | 19.0 | 14.9 | 5.1 | 4.7 | 4.1 | 25 | 28 | 25 |
| FIT | 6088 HK | 4.6 | N-R | 68 | 46 | na | 25.2 | 17.0 | 9.5 | 1.7 | 1.6 | 1.4 | 9 | 13 | 13 |
Source: Sinopac,Bloomberg
ACES is one of the few Taiwanese players with this vertical-integration footprint: it holds wire-drawing technology transferred in-house from ITRI, produces everything from wire drawing through assembly on its own, and its commitment to moving into high-speed cableshas beennoted by AWS and Meta, backed by roughly two years of qualification work already completed.
By contrast, other Taiwanese peers have yet to build comparable vertical integration. Customers have historically split connectors and cables across separate suppliers, with cable suppliers represented by BizLink(3665TT) andLongwell (6290 TT), while peers such as Lotes (3533 TT),Alltop (3526 TT), Argosy (3217 TT) and JPCConnectivity (6197 TT) arelikewise strong in connectorsbut lack in-house cable capability.
Since the Gen5 qualified-supplier base was already fragmented, the Gen6 bar of combined connector-plus-cable capability becomes ACES's entry point, bringing ACES into design-in from Gen6. The qualified connector supplier base issmall, with suppliers includingAPH, TE, and ACES, with Lotesadded subsequently.
Peer comparison
ACES's primary local competitors in connectors include Lotes, Alltop, Argosy and JPC Connectivity. Inthe cable industry, it competes withBizlinkandLongwell. ACES's foreign peers include Amphenol, TE and FIT.
Target price calculation
We initiate coverage of ACESwith an O-PFrating and atarget price of NT$270, based on 20x 2H27-1H28SPEPS, supported by a strong 72% EPS Cagr in 202628SP.We use a PE-based methodology for ACES, in line with other connector companies. We initiate coverage with anOutperform rating.
Our target multiple of 20x is in line with the 2027SP average PE of 20.4x for Taiwanlisted connector and cable peers with direct AI datacentre exposure, namely BizLink, Lotes and JPC Connectivity. We view this as a reasonable anchor. ACES offers faster earnings growth than the group, with 2027SP EPS growth of 121% versus the peer average of 52%, while its 2027-28SP ROE of 21-24% sits at the low end of the peer range of 22-52%.
We also believe the target PE premium is justified as the AI revenue contribution, including AI data transmission and power, rises from 4% in 2024to 48% in 2027SP. The company maintains its key supplier position at Bloom as the company ramps up its capacity expansion, while ASIC customer wins and higher connector content from the Gen6 upgrade cycle should provide additional growth drivers.As the company gradually shifts away from its legacy consumer electronics base and its exposure to cyclical downturns, we see room for a structural rerating.
| Figure 55 | ||||
|---|---|---|---|---|
| Target price calculation | Target PE (x) | Valuation period | 12-month rolling EPS (NT$) | Target Price (NT$) |
| New | 20 | 2H27-1H28SP | 13.5 | 270 |
| Source: SinoPac |
Key risks
We see fourkey operational risks for ACES:
Raw material cost volatility:Copper prices drive a large share of Cogsfor ACES's cable products, while connectors carry far less exposure.ACES currently reprices its cable products with customers on a quarterly basis, which has allowed it to sustain a long-term GM of around 20% on power cables.However, the pass-through might be lagging, so sharp copper price swings could cause quarterly GM to fluctuate before repricing impact catches up.
Delays in ODM pull-in:ACES ships its high-speed connectors directly to ODM customers. Becauserack assembly sits at the final stage of the AI server supply chain, any upstream disruption, such as componentsshortages and assembly yield issue, could push out rack shipment schedules or reduce volumes.This could in turn lead ODMs to cut or defer orders for high-speed connectors from ACES, creating quarter-to-quarter volatility in server revenue.
Slower-than-expected ramp-up at Bloom Energy: Power cables for Bloom will account for 28%/35% of ACES's revenue in 2027/28SP, which makes Bloom's ramp-up thesingle largest swing factor in our forecasts. Delays could arise on both the supply and demand sides. On the supply side, Bloom could fall behind its capacity plan if new facility fit-out, equipment installation or hiring takes longer than expected. On the demand side, its datacentre customers could defer deployments due to grid interconnection, gas supply or financing hurdles, or due to regulatory headwinds such as tighter permitting and emissions rules for on-site gasfired generation, utility restrictions on behind-the-meter power, or changes to fuel cell tax incentives. Either scenario would directly reduce ACES's power cable shipments. As volumes scale, Bloom may also qualify a second cable supplier, which would add pressure to ACES's share and ASP.
Prolonged NB weakness: NB andConsumer remains ACES's largest segment at 35% of 2026SP revenue, and our forecasts assume it returns to 4%/12% growth in 2027/28SP on a Windows 12-driven replacement cycle. If end-demand stays soft or the replacement cycle slips, a further NB decline could offsetpart of the growth from Bloom and AI servers and dilute group GM.
Investment thesis
ACES is evolving from a notebook connector maker into a supplier of AI interconnects and power cables, with two growth engines ramping at the same time. The first is Bloom Energy. ACES has co-developed SOFC power cables with Bloom for about six years, and it is currently one of three suppliers of Bloom's power cable assemblies, with around one-third of the total. It ships inner PCS andhot-box cables in 2026 and adds external DLO high-voltage cables from 2027, with order visibility extending to 2028 and beyond. The second engine is AI/ASIC servers. On ASIC platforms, ODMs have more say in supplier selection, so ACES wins both motherboard and daughterboard sockets, which lifts content from 10-20 to ~30 units per rack. Gen6 raises connector ASP by ~15%, and a new in-chassis PCIe Gen6 cable line, qualified by two CSPs, adds a higher-content stream. ACES integrates vertically from wire drawing to final assembly, which makes it one of the few Taiwanese suppliers able to ship connector-plus-cable solutions as CSPs consolidate their vendor base.
Catalysts
(1) Bloom's capacity ramp from 2GW to 4GW/6GW in 2026-28 and new datacenterwins (Oracle, Nebius, AEP, Equinix) converting into cable orders; (2) DLO high-voltage cable shipments starting in 2027; (3) ASIC customer ramps in 2H26 and a broader product range beyond MCIO into Multi-Track, board-to-board and E1/E3 connectors; (4) rising Gen6 penetration on AI server trays; (5) high-speed cable lines expanding from two to eight by end-2026, with GM improving from ~20% toward ~30%.
Valuation details
We adopt a PE-based valuation methodology as we believe the market will mainly focus on the earnings growth outlooks of high-speed connector makers, which is better reflected with PE metrics. We assign a target multiple of 20x PE, more than +1sd of the three-year average, to reflect a strong outlook with margin expansion and an EPS Cagr of 72% in 2026-28 on solid Bloom Energy demand and increasing high speed connector content.
Investment risks
There could be downside risk to sales growth and margins if: (1) Bloom's deployments or backlog conversion slow on financing, gas supply or permitting delays, or ACES loses share among Bloom's cable suppliers; (2) ASIC programs ramp more slowly or CSP Capex is cut; (3) Gen6 adoption is slower than expected, or competition from Amphenol, TE, Molex and Lotes pressures ASP; (4) high-speed cable yield and GM improve more slowly than we assume; (5) NB and consumer demand weakens further on component shortages, tariffs and inflation; (6) TWD appreciation or higher copper prices squeeze margins.
ACES scores highin balance-sheet-quality
Figure 56
| Earnings and balance-sheet riskscores (lower the better) | Earnings and balance-sheet riskscores (lower the better) - Score | Earnings and balance-sheet riskscores (lower the better) - Comments |
|---|---|---|
| Earnings-quality flags | ||
| Capex indiscipline | 0 | |
| Cash burn | 1 | Capacity expansion for high-speed connectors, high-speed cable and power cable products |
| Rising non-core or intangibles | 0 | |
| Rising working capital | 0 | |
| Poor cash conversion | 0 | |
| Earnings-quality risk score (EQRS) | 1/5 | |
| Balance-sheet-quality flags | ||
| Cash burn | 1 | Capacity expansion for high-speed connectors, high-speed cable and power cable products |
| Excessive leverage | 0 | |
| Frequent fundraising | 0 | |
| Liquidity concerns | 0 | |
| Operational stress | 0 | |
| Balance-sheet-quality risk score (BQRS) | 1/5 |
Source: SinoPac
Detailed financials
Profit & Loss (NT$m)
| Year to 31 December | 2022A | 2023A | 2024A | 2025A | 2026SP | 2027SP | 2028SP |
|---|---|---|---|---|---|---|---|
| Revenue | 10,393 | 8,486 | 9,771 | 10,860 | 13,199 | 20,531 | 26,733 |
| Cogs (ex-D&A) | (7,461) | (6,028) | (6,710) | (7,317) | (9,157) | (14,566) | (19,258) |
| Gross Profit (ex-D&A) | 2,932 | 2,458 | 3,061 | 3,543 | 4,042 | 5,965 | 7,475 |
| Research & development costs | (574) | (621) | (593) | (615) | (861) | (1,489) | (1,844) |
| Selling & marketing expenses | (686) | (585) | (593) | (621) | (666) | (847) | (1,153) |
| Other SG&A | (916) | (876) | (858) | (991) | (787) | (749) | (926) |
| Other Op Expenses ex-D&A | - | 0 | - | 0 | - | - | - |
| Op Ebitda | 755 | 376 | 1,018 | 1,316 | 1,729 | 2,881 | 3,551 |
| Depreciation/amortisation | (699) | (706) | (740) | (719) | (758) | (618) | (491) |
| Op Ebit | 57 | (331) | 278 | 597 | 970 | 2,263 | 3,060 |
| Interest income | 27 | 50 | 42 | 31 | 34 | 35 | 35 |
| Interest expense | (85) | (109) | (104) | (79) | (72) | (73) | (73) |
| Net interest inc/(exp) | (58) | (59) | (62) | (48) | (38) | (38) | (38) |
| Associates/investments | (23) | (7) | 13 | 295 | 124 | 181 | 195 |
| Forex/other income | 212 | 23 | 108 | (30) | (85) | (56) | (57) |
| Asset sales/other cash items | - | - | - | - | - | - | - |
| Provisions/other non-cash items | 130 | 105 | 49 | 2 | 75 | 72 | 71 |
| Asset revaluation/Exceptional items | (3) | - | - | - | - | - | - |
| Profit before tax | 315 | (270) | 387 | 815 | 1,046 | 2,421 | 3,231 |
| Taxat ion | (92) | 2 | (43) | (154) | (216) | (460) | (614) |
| Profit after tax | 223 | (268) | 344 | 661 | 830 | 1,961 | 2,617 |
| Preference dividends | - | - | - | - | - | - | - |
| Profit for period | 223 | (268) | 344 | 661 | 830 | 1,961 | 2,617 |
| Minority interest | 2 | 2 | 0 | 0 | 0 | 0 | 0 |
| Net profit | 225 | (267) | 344 | 661 | 830 | 1,961 | 2,617 |
| Extraordinaries/others | 0 | 0 | 0 | 0 | 0 | 0 | 0 |
| Profit avail to ordinary shares | 225 | (267) | 344 | 661 | 830 | 1,961 | 2,617 |
| Dividends | (202) | (74) | 0 | (112) | (239) | (292) | 0 |
| Retained profit | 24 | (340) | 344 | 550 | 591 | 1,670 | 2,617 |
| Adjusted profit | 225 | (267) | 344 | 661 | 830 | 1,961 | 2,617 |
| EPS (NT$) | 1.7 | (2.0) | 2.4 | 4.4 | 5.1 | 11.2 | 14.9 |
| Adj EPS [pre excep] (NT$) | 1.7 | (2.0) | 2.4 | 4.3 | 5.1 | 11.2 | 14.9 |
| Core EPS (NT$) | 1.7 | (2.0) | 2.4 | 4.4 | 5.1 | 11.2 | 14.9 |
| DPS (NT$) | 0.6 | - | 0.7 | 1.6 | 1.8 | 3.9 | 5.2 |
Profit & loss ratios
| Year to 31 December | 2022A | 2023A | 2024A | 2025A | 2026SP | 2027SP | 2028SP |
|---|---|---|---|---|---|---|---|
| Growth (%) | |||||||
| Revenue growth (% YoY) | (1.7) | (18.3) | 15.1 | 11.1 | 21.5 | 55.5 | 30.2 |
| Ebitda growth (% YoY) | (31.8) | (50.3) | 171.0 | 29.2 | 31.4 | 66.7 | 23.3 |
| Ebit growth (% YoY) | (89.0) | (682.8) | nm | 114.2 | 62.6 | 133.2 | 35.2 |
| Net profit growth (%) | (55.9) | (218.3) | nm | 92.2 | 25.6 | 136.3 | 33.4 |
| EPS growth (% YoY) | (59.7) | (216.7) | nm | 81.5 | 16.6 | 120.5 | 33.4 |
| Adj EPS growth (% YoY) | (59.7) | (216.7) | nm | 81.5 | 16.6 | 120.5 | 33.4 |
| DPS growth (% YoY) | (63.3) | (100.0) | 72,087,981,90 0.0 | 118.1 | 13.4 | 120.5 | 33.4 |
| Core EPS growth (% YoY) | (59.7) | (216.7) | nm | 81.5 | 16.6 | 120.5 | 33.4 |
| Margins (%) | |||||||
| Gross margin (%) | 28.2 | 29.0 | 31.3 | 32.6 | 30.6 | 29.1 | 28.0 |
| Ebitda margin (%) | 7.3 | 4.4 | 10.4 | 12.1 | 13.1 | 14.0 | 13.3 |
| Ebit margin (%) | 0.5 | (3.9) | 2.9 | 5.5 | 7.4 | 11.0 | 11.4 |
| Net profit margin (%) | 2.2 | (3.1) | 3.5 | 6.1 | 6.3 | 9.6 | 9.8 |
| Core profit margin | 2.2 | (3.1) | 3.5 | 6.1 | 6.3 | 9.6 | 9.8 |
| Op cashflow margin | 11.4 | 7.8 | 9.9 | 11.1 | 9.1 | 5.5 | 3.6 |
| Returns (%) | |||||||
| ROE (%) | 4.1 | (4.9) | 6.0 | 9.5 | 10.3 | 21.1 | 23.6 |
| ROA (%) | 0.3 | (2.6) | 1.9 | 3.4 | 4.9 | 9.9 | 11.3 |
| ROIC (%) | 0.7 | (5.0) | 3.5 | 6.3 | 9.3 | 19.2 | 20.9 |
| ROCE (%) | 0.9 | (4.8) | 3.7 | 7.3 | 11.4 | 24.2 | 26.9 |
| Other key ratios (%) | |||||||
| Effective tax rate (%) | 29.1 | 0.6 | 11.1 | 18.8 | 20.6 | 19.0 | 19.0 |
| Ebitda/net int exp (x) | 13.1 | 6.4 | 16.5 | 27.2 | 45.3 | 76.1 | 93.7 |
| Exceptional or extraord. inc/PBT (%) | - | - | - | - | - | - | - |
| Dividend payout (%) | 32.8 | - | 30.1 | 36.1 | 35.1 | 35.1 | 35.1 |
Source: SinoPac
Database Great Meh
Balance sheet (NT$m)
evalu@tor The Global Equities Dalabase
| Year to 31 December | 2022A | 2023A | 2024A | 2025A | 2026SP | 2027SP | 2028SP |
|---|---|---|---|---|---|---|---|
| Cash & equivalents | 2,459 | 2,058 | 2,001 | 2,483 | 3,368 | 3,341 | 2,725 |
| Accounts receivable | 2,779 | 2,743 | 3,352 | 3,331 | 3,473 | 5,133 | 7,426 |
| Inventories | 1,454 | 1,189 | 1,394 | 1,436 | 2,479 | 3,796 | 4,937 |
| Other current assets | 165 | 98 | 142 | 161 | 161 | 161 | 161 |
| Current assets | 6,857 | 6,088 | 6,889 | 7,411 | 9,482 | 12,430 | 15,250 |
| Fixed assets | 3,428 | 3,741 | 4,415 | 4,871 | 5,136 | 5,526 | 6,104 |
| Investments | 1,211 | 981 | 1,023 | 1,267 | 888 | 888 | 888 |
| Goodwill | 0 | 0 | 0 | 0 | 0 | 0 | 0 |
| Other intangible assets | 154 | 192 | 154 | 140 | 140 | 140 | 140 |
| Other non-current assets | 1,191 | 1,248 | 1,115 | 1,161 | 1,161 | 1,161 | 1,161 |
| Total assets | 12,840 | 12,251 | 13,596 | 14,849 | 16,808 | 20,146 | 23,544 |
| Short term loans/OD | 2,548 | 2,241 | 428 | 913 | 1,169 | 1,037 | 1,040 |
| Accounts payable | 1,624 | 1,409 | 1,961 | 2,016 | 2,833 | 4,338 | 5,643 |
| Accrued expenses | - | - | - | - | - | - | - |
| Taxes payable | 0 | 0 | 0 | 0 | 0 | 0 | 0 |
| Other current liabs | 1,220 | 1,014 | 1,127 | 1,086 | 1,076 | 1,096 | 1,086 |
| Current liabilities | 5,392 | 4,664 | 3,516 | 4,016 | 5,078 | 6,471 | 7,769 |
| Long-term debt/leases/other | 1,216 | 1,737 | 2,991 | 2,194 | 2,194 | 2,194 | 2,194 |
| Convertible bonds | - | - | - | - | - | - | - |
| Provisions/other LT liabs | 577 | 593 | 628 | 706 | 880 | 1,156 | 1,328 |
| Total liabilities | 7,185 | 6,994 | 7,134 | 6,915 | 8,152 | 9,821 | 11,291 |
| Share capital | 1,344 | 1,344 | 1,419 | 1,624 | 1,753 | 1,753 | 1,753 |
| Retained earnings | 2,492 | 2,236 | 2,529 | 3,141 | 3,649 | 5,123 | 6,789 |
| Reserves/others | 1,691 | 1,719 | 2,312 | 2,962 | 3,045 | 3,241 | 3,502 |
| Shareholder funds | 5,528 | 5,300 | 6,260 | 7,726 | 8,447 | 10,117 | 12,045 |
| Minorities/other equity | 128 | (43) | 202 | 208 | 208 | 208 | 208 |
| Total equity | 5,655 | 5,257 | 6,462 | 7,934 | 8,655 | 10,325 | 12,253 |
| Total liabs & equity | 12,840 | 12,251 | 13,596 | 14,849 | 16,808 | 20,146 | 23,544 |
| Total debt | 3,764 | 3,978 | 3,419 | 3,107 | 3,363 | 3,230 | 3,234 |
| Net debt | 1,305 | 1,920 | 1,418 | 624 | (5) | (110) | 508 |
| Adjusted EV | 22,636 | 22,786 | 25,037 | 26,162 | 27,999 | 27,844 | 28,413 |
| BVPS (NT$) | 41.1 | 39.4 | 42.1 | 47.2 | 48.2 | 57.7 | 68.7 |
Balance sheet ratios
| Year to 31 December | 2022A | 2023A | 2024A | 2025A | 2026SP | 2027SP | 2028SP |
|---|---|---|---|---|---|---|---|
| Key ratios | |||||||
| Current ratio (x) | 1.3 | 1.3 | 2.0 | 1.8 | 1.9 | 1.9 | 2.0 |
| Growth in total assets (% YoY) | (0.3) | (4.6) | 11.0 | 9.2 | 13.2 | 19.9 | 16.9 |
| Growth in capital employed (% YoY) | 10.0 | 4.0 | 10.0 | 8.5 | 1.1 | 18.3 | 25.2 |
| Net debt to operating cashflow (x) | 1.1 | 2.9 | 1.5 | 0.5 | - | - | 0.5 |
| Gross debt to operating cashflow (x) | 3.2 | 6.0 | 3.5 | 2.6 | 2.8 | 2.9 | 3.4 |
| Gross debt to Ebitda (x) | 5.0 | 10.6 | 3.4 | 2.4 | 1.9 | 1.1 | 0.9 |
| Net debt/Ebitda (x) | 1.7 | 5.1 | 1.4 | 0.5 | - | - | 0.1 |
| Gearing | |||||||
| Net debt/equity (%) | 23.1 | 36.5 | 21.9 | 7.9 | (0.1) | (1.1) | 4.1 |
| Gross debt/equity (%) | 66.6 | 75.7 | 52.9 | 39.2 | 38.9 | 31.3 | 26.4 |
| Interest cover (x) | 1.0 | (2.6) | 3.1 | 7.9 | 13.9 | 31.5 | 42.3 |
| Debt cover (x) | 0.3 | 0.2 | 0.3 | 0.4 | 0.4 | 0.3 | 0.3 |
| Net cash per share (NT$) | (9.7) | (14.1) | (9.9) | (4.1) | 0.0 | 0.6 | (2.9) |
| Working capital analysis | |||||||
| Inventory days | 69.7 | 71.6 | 63.3 | 64.3 | 72.1 | 75.4 | 80.7 |
| Debtor days | 101.3 | 118.8 | 113.8 | 112.3 | 94.1 | 76.5 | 85.7 |
| Creditor days | 79.3 | 82.2 | 82.6 | 90.3 | 89.2 | 86.2 | 92.2 |
| Working capital/Sales (%) | 14.9 | 18.9 | 18.4 | 16.8 | 16.7 | 17.8 | 21.7 |
| Capital employed analysis | |||||||
| Sales/Capital employed (%) | 152.4 | 119.7 | 125.3 | 128.3 | 154.3 | 202.9 | 211.1 |
| EV/Capital employed (%) | 331.9 | 321.4 | 321.0 | 309.1 | 327.3 | 275.1 | 224.3 |
| Working capital/Capital employed (%) | 22.8 | 22.7 | 23.1 | 21.6 | 25.8 | 36.1 | 45.8 |
| Fixed capital/Capital employed (%) | 50.3 | 52.8 | 56.6 | 57.6 | 60.0 | 54.6 | 48.2 |
| Other ratios (%) | |||||||
| PB (x) | 4.2 | 4.4 | 4.1 | 3.6 | 3.6 | 3.0 | 2.5 |
| EV/Ebitda (x) | 30.0 | 60.6 | 24.6 | 19.9 | 16.2 | 9.7 | 8.0 |
| EV/OCF (x) | 19.1 | 34.4 | 25.8 | 21.6 | 23.4 | 24.9 | 29.6 |
| EV/FCF (x) | 339.1 | (101.7) | (88.5) | (266.4) | 225.8 | 105.4 | 390.2 |
| EV/Sales (x) | 2.2 | 2.7 | 2.6 | 2.4 | 2.1 | 1.4 | 1.1 |
| Capex/depreciation (%) | 171.4 | 136.2 | 189.6 | 195.6 | 151.5 | 165.8 | 247.6 |
Cashflow (NT$m)
evaor The Globai Equities Database
| Year to 31 December | 2022A | 2023A | 2024A | 2025A | 2026SP | 2027SP | 2028SP |
|---|---|---|---|---|---|---|---|
| Operating profit | 57 | (331) | 278 | 597 | 970 | 2,263 | 3,060 |
| Operating adjustments | 167 | 63 | 66 | 65 | (140) | (302) | (443) |
| Depreciation/amortisation | 699 | 706 | 740 | 719 | 758 | 618 | 491 |
| Working capital changes | (27) | 0 | (184) | 29 | (379) | (1,451) | (2,140) |
| Interest paid / other financial expenses | (10) | 11 | (3) | 37 | (10) | (9) | (9) |
| Tax paid | - | - | - | - | - | - | - |
| Other non-cash operating items | 298 | 214 | 74 | (236) | 0 | 0 | 1 |
| Net operating cashflow | 1,183 | 663 | 971 | 1,210 | 1,199 | 1,119 | 960 |
| Capital expenditure | (1,116) | (887) | (1,253) | (1,308) | (1,075) | (855) | (887) |
| Free cashflow | 67 | (224) | (283) | (98) | 124 | 264 | 73 |
| Acq/inv/disposals | 57 | 43 | (36) | 321 | - | - | - |
| Int, invt & associate div | (76) | (206) | 173 | 3 | - | - | - |
| Net investing cashflow | (1,136) | (1,050) | (1,117) | (984) | (1,075) | (855) | (887) |
| Increase in loans | 369 | 202 | 62 | 508 | 1,000 | - | - |
| Dividends | (202) | (74) | 0 | (112) | (239) | (292) | (689) |
| Net equity raised/others | (207) | (85) | (43) | (252) | 0 | 0 | 0 |
| Net financing cashflow | (39) | 43 | 19 | 144 | 761 | (292) | (689) |
| Incr/(decr) in net cash | 8 | (343) | (127) | 370 | 885 | (28) | (616) |
| Exch rate movements | (117) | (57) | 70 | 112 | 0 | 0 | 1 |
| Opening cash | 2,568 | 2,459 | 2,058 | 2,001 | 2,483 | 3,368 | 3,341 |
| Closing cash | 2,459 | 2,058 | 2,001 | 2,483 | 3,368 | 3,341 | 2,725 |
| OCF PS (NT$) | 8.8 | 4.9 | 6.8 | 8.0 | 7.3 | 6.4 | 5.5 |
| FCF PS (NT$) | 0.5 | (1.6) | (2.0) | (0.6) | 0.8 | 1.5 | 0.4 |
Cashflowratio analysis
| Year to 31 December | 2022A | 2023A | 2024A | 2025A | 2026SP | 2027SP | 2028SP |
|---|---|---|---|---|---|---|---|
| Growth (%) | |||||||
| Op cashflow growth (% YoY) | 53.8 | (43.9) | 46.3 | 24.7 | (0.9) | (6.6) | (14.2) |
| FCF growth (% YoY) | - | (435.5) | - | - | - | 113.0 | (72.4) |
| Capex growth (%) | 9.4 | (20.5) | 41.3 | 4.4 | (17.8) | (20.4) | 3.7 |
| Other key ratios (%) | |||||||
| Capex/sales (%) | 10.7 | 10.5 | 12.8 | 12.0 | 8.1 | 4.2 | 3.3 |
| Capex/op cashflow (%) | 94.4 | 133.8 | 129.1 | 108.1 | 89.7 | 76.4 | 92.4 |
| Operating cashflow payout ratio (%) | 6.3 | 0.0 | 10.7 | 19.7 | 24.3 | 61.6 | 95.8 |
| Cashflow payout ratio (%) | 17.0 | 11.1 | 0.0 | 9.2 | 19.9 | 26.1 | 0.0 |
| Free cashflow payout ratio (%) | 302.0 | - | - | - | 192.7 | 110.5 | 0.0 |
DuPont analysis
| Year to 31 December | 2022A | 2023A | 2024A | 2025A | 2026SP | 2027SP | 2028SP |
|---|---|---|---|---|---|---|---|
| Ebit margin (%) | 0.5 | (3.9) | 2.9 | 5.5 | 7.4 | 11.0 | 11.4 |
| Asset turnover (x) | 0.8 | 0.7 | 0.8 | 0.8 | 0.8 | 1.1 | 1.2 |
| Interest burden (x) | 5.6 | 0.8 | 1.4 | 1.4 | 1.1 | 1.1 | 1.1 |
| Taxburden (x) | 0.7 | 1.0 | 0.9 | 0.8 | 0.8 | 0.8 | 0.8 |
| Return on assets (%) | 0.3 | (2.6) | 1.9 | 3.4 | 4.9 | 9.9 | 11.3 |
| Leverage (x) | 2.3 | 2.3 | 2.2 | 2.0 | 1.9 | 1.9 | 1.9 |
| ROE (%) | 4.1 | (4.9) | 6.0 | 9.5 | 10.3 | 21.1 | 23.6 |
EVA ® analysis
| Year to 31 December | 2022A | 2023A | 2024A | 2025A | 2026SP | 2027SP | 2028SP |
|---|---|---|---|---|---|---|---|
| Ebit adj for tax | 40 | (329) | 248 | 484 | 770 | 1,833 | 2,479 |
| Average invested capital | 6,079 | 6,558 | 7,137 | 7,741 | 8,320 | 9,562 | 11,842 |
| ROIC (%) | 0.7 | (5.0) | 3.5 | 6.3 | 9.3 | 19.2 | 20.9 |
| Cost of equity (%) | 9.7 | 9.7 | 9.7 | 9.7 | 9.7 | 9.7 | 9.7 |
| Cost of debt (adj for tax) | 1.8 | 2.5 | 2.2 | 2.0 | 2.0 | 2.0 | 2.0 |
| Weighted average cost of capital (%) | 8.1 | 8.2 | 8.2 | 8.1 | 8.1 | 8.1 | 8.1 |
| EVA/IC (%) | (7.4) | (13.2) | (4.7) | (1.9) | 1.1 | 11.0 | 12.8 |
| EVA (NT$m) | (451) | (868) | (335) | (145) | 95 | 1,056 | 1,517 |
Source: SinoPac
Research subscriptions
To change your report distribution requirements, please contact your CLSA sales representative or email us at cib@clsa.com. You can also fine-tune your Research Alert email preferences at https://www.clsa.com/member/tools/email_alert/.
Companies mentioned
ACES (3605 TT -NT$172.00 -OUTPERFORM) 3M (N-R) AcBel Polytech (N-R) AEP (N-R) Alltop (N-R) Amazon (N-R) AMD (AMD US -US$631.75 -O-PF)¹ Amphenol (N-R) Apple (AAPL US -US$332.89 -O-PF)¹ Argosy (N-R) AWS (N-R) Bizlink (3665 TT -NT$2,325.0 -O-PF)² Bloom Energy (N-R) Brookfield (N-R) Bunzl (N-R) certainteed (N-R) Cisco (N-R) CPC (N-R) Equinix (N-R) FIT (N-R) Genesis (N-R) ITRI (N-R) JPC (N-R) Kaori (8996 TT -NT$1,600.0 -HC O-PF)² Ke Yan Investments (N-R) Kuang Ying (N-R) Living Spaces (N-R) Longwell (N-R) Lotes (3533 TT -NT$1,865.0 -HLD)² MEC IMEX (N-R) Meta (N-R) Microsoft (MSFT US -US$525.18 -O-PF)¹ Mitac (N-R) Molex (N-R) MTAR Technologies (N-R) Nebius (N-R) Nvidia (NVDA US -US$238.90 -HC O-PF)¹ Office Depot (N-R) OnTrac (N-R) Oracle (ORCL US -US$142.48 -HLD)¹ Porite (N-R) Quanta (2382 TT -NT$333.5 -O-PF)² Sanmina-SCI Corp (N-R) Schneider Electric (N-R) Syscom Computer (N-R) Taishin International (N-R) TD Synnex (N-R) TE Connectivity (N-R)
Tesla (TSLA US -US$378.73 -U-PF)³ Three-Circle (N-R) UPS (N-R) Vinatech (N-R) Walters&Wolf (N-R)
Wei Ji Investments (N-R)
¹ Covered byCLSA Americas; ² Covered by SinoPac; ³ Covered by CLSA