PDF 原檔:報告_BofA_鴻勁7769_20260729_original.pdf
圖片清單(已驗證 2026-07-31)
| 檔名 | size | 分類 | 親眼所見內容 |
|---|---|---|---|
260729_ml_hon-precision_002.png |
60.6KB | 真資料圖 | Handler system revenue(NT$mn,2024-2028E)長條圖疊加 Handler system YoY/Others YoY 雙折線,標示 Source: BofA Global Research estimates |
260729_ml_hon-precision_001.png |
20.0KB | 真資料圖 | Handler system quarterly production capacity 長條圖(1Q24-4Q28E,逐季遞增) |
260729_ml_hon-precision_003.png |
31.6KB | 真資料圖 | 股價走勢圖 + PO 沿革標註:16-Mar B Liu PO NT$5,000 → 28-Apr PO NT$5,500 → 24-Jun PO NT$7,800(本次報告 PO NT$7,800 維持不變) |
原始內容
Hon Precision
Strong 2Q26 sales with sustained growth in 2026/27
Maintain Rating: BUY | PO: 7,800 TWD | Price: 5,750 TWD
2Q26 sales strength on solid cold plate/handler demand
Hon Precision 2Q26 sales were +29% QoQ, reaching record high and beating BofAe/Street expectations of +13%/+16% QoQ, supported by particularly strong June monthly sales of +28% MoM. We attribute the sales strength to smoother-thanexpected handler qualification, coupled with robust demand for cold plate ahead of the ramp of Nvidia ' s Rubin GPU in 2H26. On favorable mix shift toward margin accretive cold plate products, we think 2Q26 GM could be lifted to 57.6% (vs. 56.2% in 1Q26).
Concerns on GPU/CPO delay should be manageable
Despite recent market concerns on delayed production ramp of Nvidia ' s Rubin GPU, we keep our 2H26 sales estimates of +12% HoH, as we believe the impact to Hon Precision ' s shipment delivery should be manageable with diverse and solid handler demand from other customers, such as AMD, Google, China customer, and US auto customer. For CPO insertion 4 O/E testing equipment, we believe customer ' s qualification remains on track, and late-3Q26 through year-end should be the key watch point for clearer equipment configuration and order visibility.
Margin improvement on equipment dollar content gain
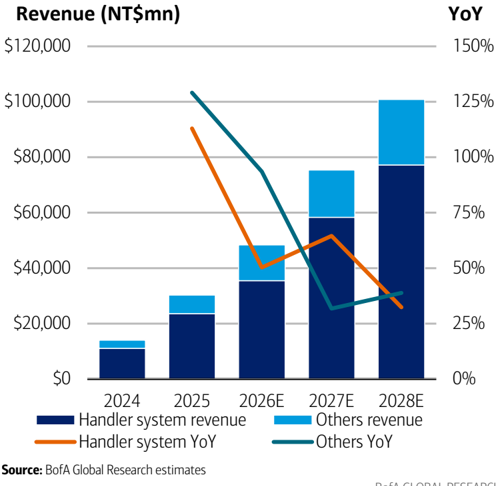
We model Hon Precision's handler system sales could grow at +48% CAGR from '26-'28 on +36%/+9% shipment/ASP CAGR as customers continue to migrate toward high-end specifications, including higher-power density ATC and build-in AOI. Spec upgrade along with sustained full utilization should lift GMs to 60% level in 2028. (BofAe 57.8% in '26)
Clear EPS growth trajectory underpins higher valuation
We maintain our Buy rating with NT$7,800 PO based on 36x 2H27-1H28 P/E, and keep our '26/'27/'28 EPS estimates at NT$114.39/180.02/243.88. We see strong multi-year growth ahead with decent sales/earnings CAGR at 44%/46% over '26-'28E.
| Estimates (Dec) (NT$) | 2024A | 2025A | 2026E | 2027E | 2028E |
|---|---|---|---|---|---|
| Net Income (Adjusted - mn) | 5,286 | 12,362 | 20,607 | 32,431 | 43,937 |
| EPS | 32.73 | 75.71 | 114.39 | 180.02 | 243.88 |
| EPS Change (YoY) | NA | 131.3% | 51.1% | 57.4% | 35.5% |
| Dividend / Share | 22.50 | 65.00 | 100.00 | 145.00 | 190.00 |
| Free Cash Flow / Share | 13.56 | 97.37 | 59.16 | 114.35 | 204.21 |
| Valuation (Dec) | |||||
| P/E | 175.69x | 75.95x | 50.27x | 31.94x | 23.58x |
| Dividend Yield | 0.391% | 1.13% | 1.74% | 2.52% | 3.30% |
| EV / EBITDA* | 155.01x | 64.92x | 39.46x | 24.58x | 18.09x |
| Free Cash Flow Yield* | 0.210% | 1.54% | 1.03% | 1.99% | 3.55% |
| * For full definitions of iQ method SM measures, see page 6. |
This research report provides general information only. No part of this report may be used or reproduced or quoted in any manner whatsoever in Taiwan by the press or other persons without the express written consent of BofA Securities.
- >> Employed by a non-US affiliate of BofAS and is not registered/qualified as a research analyst under the FINRA rules.
Refer to "Other Important Disclosures" for information on certain BofA Securities entities that take responsibility for the information herein in particular jurisdictions.
BofA Securities does and seeks to do business with issuers covered in its research reports. As a result, investors should be aware that the firm may have a conflict of interest that could affect the objectivity of this report. Investors should consider this report as only a single factor in making their investment decision.
Refer to important disclosures on page 7 to 9. Analyst Certification on page 4. Price
29 July 2026
Equity
Haas Liu >> Research Analyst Merrill Lynch (Taiwan) +886 2 2376 3727 haas.liu@bofa.com
Mike Yang >> Research Analyst Merrill Lynch (Taiwan) mike.c.yang@bofa.com
Cathy Hsu >> Research Analyst Merrill Lynch (Taiwan) cathy.hsu3@bofa.com
Stock Data
| Price | 5,750 TWD |
|---|---|
| Price Objective | 7,800 TWD |
| Date Established | 24-Jun-2026 |
| Investment Opinion | C-1-7 |
| 52-Week Range | 1,400 TWD-8,465TWD |
| Mrkt Val / Shares Out (mn) | 31,900 USD / 179.9 |
| Market Value (mn) | 1,034,598 TWD |
| Average Daily Value (mn) | 119.42 USD |
| Free Float | 44.6% |
| BofA Ticker / Exchange | XXPIF / TAI |
| Bloomberg / Reuters | 7769 TT / 7769.TW |
| ROE (2026E) | 33.0% |
| Net Dbt to Eqty (Dec-2025A) | -93.4% |
iQ profile SM Hon Precision
| Key Income Statement Data (Dec) | 2024A | 2025A | 2026E | 2027E | 2028E |
|---|---|---|---|---|---|
| (NT$ Millions) | |||||
| Sales | 13,992 | 30,271 | 48,376 | 75,365 | 100,855 |
| Gross Profit | 7,700 | 17,114 | 27,960 | 44,761 | 60,744 |
| Sell General &Admin Expense | (778) | (1,028) | (1,413) | (2,421) | (3,277) |
| Operating Profit | 6,285 | 15,046 | 24,753 | 39,803 | 54,125 |
| Net Interest &Other Income | 398 | 538 | 1,148 | 966 | 1,108 |
| Associates | NA | NA | NA | NA | NA |
| Pretax Income | 6,683 | 15,584 | 25,902 | 40,769 | 55,233 |
| Tax (expense) / Benefit | (1,397) | (3,222) | (5,294) | (8,338) | (11,296) |
| Net Income (Adjusted) | 5,286 | 12,362 | 20,607 | 32,431 | 43,937 |
| Average Fully Diluted Shares Outstanding | 162 | 163 | 180 | 180 | 180 |
| Key Cash Flow Statement Data | |||||
| Net Income | 5,286 | 12,362 | 20,607 | 32,431 | 43,937 |
| Depreciation &Amortization | 46 | 69 | 115 | 115 | 115 |
| Change in Working Capital | (3,509) | (3,998) | (8,091) | (9,986) | (5,327) |
| Deferred Taxation Charge | NA | NA | NA | NA | NA |
| Other Adjustments, Net | 485 | 7,753 | (47) | (47) | (47) |
| Cash Flow from Operations | 2,308 | 16,186 | 12,584 | 22,513 | 38,678 |
| Capital Expenditure | (133) | (286) | (1,940) | (1,940) | (1,940) |
| (Acquisition) / Disposal of Investments | (1,343) | 1,127 | (7,888) | 0 | 0 |
| Other Cash Inflow / (Outflow) | 153 | (272) | 389 | (29) | (5) |
| Cash Flow from Investing | (1,322) | 569 | (9,440) | (1,969) | (1,945) |
| Shares Issue / (Repurchase) | 894 | 34,466 | 0 | 0 | 0 |
| Cost of Dividends Paid | (4,800) | (3,636) | (11,695) | (17,993) | (26,090) |
| Cash Flow from Financing | (3,759) | 30,650 | (11,702) | (17,993) | (26,090) |
| Free Cash Flow | 2,175 | 15,900 | 10,644 | 20,573 | 36,738 |
| Net Debt | (7,888) | (54,228) | (53,528) | (56,079) | (66,722) |
| Change in Net Debt | 2,925 | (47,554) | 8,550 | (2,550) | (10,644) |
| Key Balance Sheet Data | |||||
| Property, Plant &Equipment | 1,888 | 2,106 | 3,842 | 5,678 | 7,515 |
| Other Non-Current Assets | 441 | 969 | 851 | 822 | 817 |
| Trade Receivables | 2,913 | 2,935 | 4,754 | 7,389 | 8,932 |
| Cash &Equivalents | 8,045 | 54,228 | 53,528 | 56,079 | 66,722 |
| Other Current Assets | 8,579 | 13,033 | 20,266 | 30,284 | 35,544 |
| Total Assets | 21,866 | 73,270 | 83,242 | 100,253 | 119,532 |
| Long-Term Debt | 0 | 0 | 0 | 0 | 0 |
| Other Non-Current Liabilities | 106 | 211 | 221 | 215 | 213 |
| Short-Term Debt | 157 | 0 | 0 | 0 | 0 |
| Other Current Liabilities | 7,871 | 15,028 | 16,302 | 19,647 | 21,567 |
| Total Liabilities | 8,134 | 15,239 | 16,523 | 19,862 | 21,780 |
| Total Equity | 13,732 | 58,031 | 66,719 | 80,391 | 97,752 |
| Total Equity &Liabilities | 21,866 | 73,270 | 83,242 | 100,253 | 119,532 |
| iQ method SM - Bus Performance* | |||||
| Return On Capital Employed | NA | 33.7% | 32.7% | 43.9% | 49.2% |
| Return On Equity | 77.0% | 34.5% | 33.0% | 44.1% | 49.3% |
| Operating Margin | 44.9% | 49.7% | 51.2% | 52.8% | 53.7% |
| EBITDA Margin | 45.2% | 49.9% | 51.4% | 53.0% | 53.8% |
| iQ method SM - Quality of Earnings* | |||||
| Cash Realization Ratio | 0.4x | 1.3x | 0.6x | 0.7x | 0.9x |
| Asset Replacement Ratio | 3.0x | 4.6x | 18.8x | 18.8x | 18.8x |
| Tax Rate (Reported) | 20.9% | 20.7% | 20.4% | 20.5% | 20.5% |
| Net Debt-to-Equity Ratio | -57.4% | -93.4% | -80.2% | -69.8% | -68.3% |
| Interest Cover | NM | NM | NM | NA | NA |
Key Metrics
- For full definitions of iQ method SM measures, see page 6.
Company Sector
Semiconductor Capital Equipment
Company Description
Hon Precision is a Taiwan-based semiconductor equipment supplier specializing in test handler system for FT and SLT across a wide range of applications, including AI/HPC, automotive, memory, and consumer electronics. Founded in 2025, with roots tracing back to Hon Technology established in 1999, the company's core strength lies in its turnkey service offering, delivering comprehensive, on-step test handler systems integrated with ATC solutions and cold plate technologies.
Investment Rationale
We have a Buy rating on Hon Precision, in view of its strong technology leadership in the semiconductor back-end testing equipment. It has a solid market position with around 70% share in FT handler market and close to 50% share in SLT handler market. Longer-term, the company could ride on the AI-driven structural back-end testing demand and dollar content gain from chips migration toward more complicated designs.
Stock Data
Price to Book Value
15.5x
Focus charts and tables
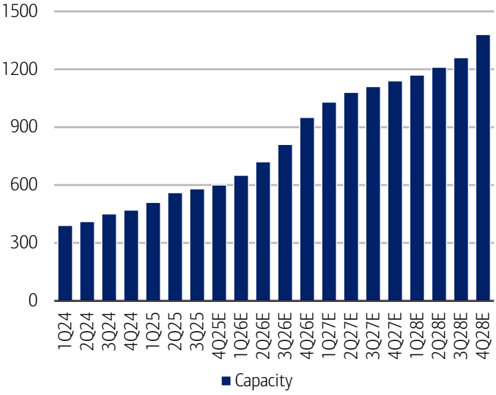
Exhibit 1: Hon precision handler system quarterly production capacity
We expect Hon Precision to expand capacity by +39%/+39% YoY in '26/'27
Handler system quarterly production capacity (unit)
Source: BofA Global Research estimates
Exhibit 3: Terms and definitions
Glossary of abbreviations/acronyms
| Term | Definition |
|---|---|
| AMD | Advanced Micro Devices |
| AOI | Automated Optical Inspection |
| ATC | Active Thermal Control |
| CPO | Co-Packaged Optics |
| FT | Final test |
| GPU | Graphic Processing Unit |
| O/E | Optical to electrical |
| SLT | System level test |
Source: BofA Global Research
BofA GLOBAL RESEARCH
Exhibit 2: Hon Precision revenue and YoY
We expect its sales to grow at 44% CAGR over 2026-2028
BofA GLOBAL RESEARCH
BofA GLOBAL RESEARCH
Price objective basis & risk
Hon Precision (XXPIF)
Our PO of NT$7,800 is based on 36x 2027E P/E, positioned at the upper half of its historical trading range of 8-56x. We believe a P/E based valuation is appropriate given Hon Precision's consistent profitability profile and structurally improving earnings quality through industry cycle, and the valuation multiple is underpinned by: 1) 44%/46% CAGR in sales and operating profit over 2025-27E, and 2) sustained ROE in the 30-40% range.
Downside risks are: 1) slowdown in back-end testing capacity expansion and 2) misexecution on equipment development and production ramp.