PDF 原檔:報告_BofA_台積電2330資本預算_20260818_original.pdf
圖片清單(已驗證 2026-08-19)
分類為「真資料圖」者才可嵌入 lib/ 頁,圖說須照抄下表「親眼所見內容」。標「未驗證」者一律不得嵌入;若日後需要,須先逐張 Read 現場補驗。
| 檔名 | size | 分類 | 親眼所見內容 |
|---|---|---|---|
報告_BofA_台積電2330資本預算_20260818_001.png |
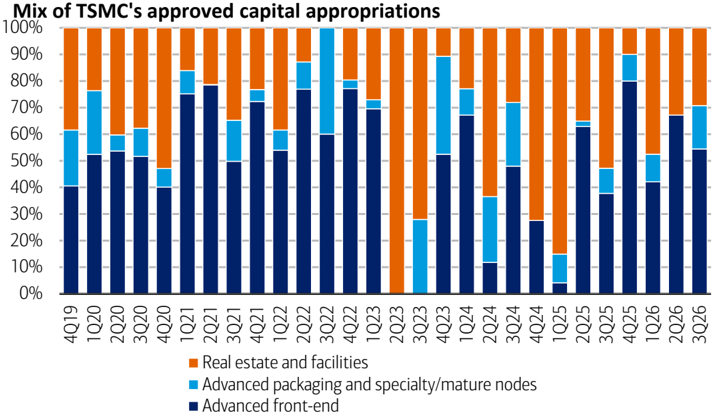
82KB | 真資料圖 | 標題「Mix of TSMC's approved capital appropriations」,4Q19–3Q26 逐季 100% 堆疊柱狀圖,三色分別為 Real estate and facilities、Advanced packaging and specialty/mature nodes、Advanced front-end |
報告_BofA_台積電2330資本預算_20260818_002.png |
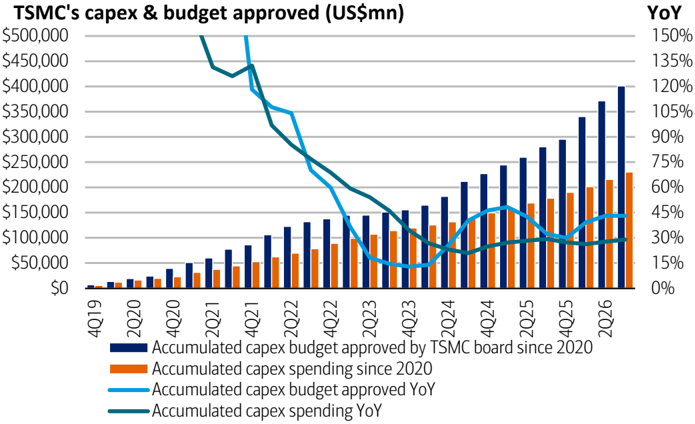
114KB | 真資料圖 | 標題「TSMC's capex & budget approved (US$mn)」,4Q19–2Q26 柱狀圖:深藍為 2020 年起累計董事會核准資本預算、橘色為累計資本支出;兩條折線為兩者 YoY(右軸 0–150%) |
報告_BofA_台積電2330資本預算_20260818_004.png |
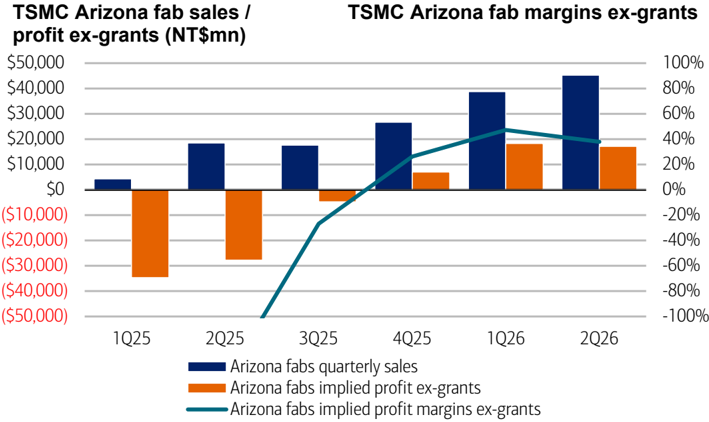
83KB | 真資料圖 | 雙標題「TSMC Arizona fab sales / profit ex-grants (NT$mn)」與「TSMC Arizona fab margins ex-grants」,1Q25–2Q26:深藍柱為亞利桑那廠季度營收(2Q26 約 NT$45,000mn)、橘柱為排除補助後隱含獲利(1Q25/2Q25 為負,3Q25 起轉正)、折線為排除補助後利潤率(2Q26 約 40%) |
報告_BofA_台積電2330資本預算_20260818_003.png/_005.png/_006.png |
77–97KB | 未驗證 | 未逐張 Read,不得嵌入 lib |
原始內容
Taiwan Semiconductor Manufacturing Co.
Capital appropriation ramping to support demand; US fab ramps progressing well
Maintain Rating: BUY | PO: 3,100 TWD | Price: 2,380 TWD
Solid capital budget for advanced front/back-end demand
BoD approved capital appropriations of US$29bn, putting the budget +99% YoY from 1Q-3Q26. While the quarterly trend could be lumpy, we would note budget mix (Exhibit 2) continues shifting to front-end expansion and a modest pick up in advanced back-end packaging and specialty process, suggesting it is undergoing a period of steep capacity ramp as facilities/clean room get ready (35% of budget LTM vs 47% avg. in ' 24-25). Based on our wafer demand estimate on GPUs, ASICs, x86/ARM server CPU, networking switch and existing mobile SoCs, the capex is on track to its guide midpoint of US$62bn in ' 26 and could reach US$80-85bn in ' 27 (vs. BofAe/street US$78bn/US$75bn) if its capital appropriation run rate sustains above the long term trend at +40-45% YoY.
GMs hold up well even with ramping overseas operation
While TSMC ' s depreciation could grow at ~20% CAGR from ' 26-28 amid significant capex growth to support demand across advanced and specialty technologies including JV with Sony for image sensor production in ' 29, the solid HPC demand pipeline along with the existing high-end mobile chipsets should allow it to better reflect the value of technology leadership, keeping its GMs solid at high-60% levels. It is noteworthy that its Arizona fabs sales was up 17% QoQ and 145% YoY to NT$45bn at 4% of TSMC ' s total sales. We also estimate its net margins ex-grants stayed resilient at 38% in 2Q26 (vs. 90% in ' 25 for its Arizona fabs and corporate average of ~50%), potentially moderating the margins dilution if it stays well executed on utilization/pricing in overseas fabs.
Stock at mid-cycle supported by robust AI demand pipeline
We maintain our Buy rating with PO at NT$3,100 on 20x '27 P/E. The share valuation is undemanding at 17x '27 P/E (vs. its long term 11-21x range) backed by 33%/40% sales/earnings CAGR on strong technology leadership and extending AI demand visibility.
| Estimates (Dec) (NT$) | 2024A | 2025A | 2026E | 2027E | 2028E |
|---|---|---|---|---|---|
| Net Income (Adjusted - mn) | 1,173,268 | 1,717,886 | 2,857,919 | 3,972,158 | 4,718,757 |
| EPS | 45.24 | 66.24 | 110.20 | 153.17 | 181.96 |
| EPS Change (YoY) | 39.9% | 46.4% | 66.4% | 39.0% | 18.8% |
| Consensus EPS (Visible Alpha) | 108.29 | 144.31 | 180.04 | ||
| Dividend / Share | 18.00 | 22.00 | 24.00 | 24.00 | 24.00 |
| Free Cash Flow / Share | 33.55 | 38.66 | 67.82 | 93.39 | 126.04 |
| ADR EPS (US$) | 7.04 | 10.62 | 17.31 | 24.06 | 28.58 |
| ADR Dividend / Share (US$) | 2.80 | 3.53 | 3.77 | 3.77 | 3.77 |
| Valuation (Dec) | |||||
| P/E | 52.60x | 35.93x | 21.60x | 15.54x | 13.08x |
| Dividend Yield | 0.756% | 0.924% | 1.01% | 1.01% | 1.01% |
| EV / EBITDA* | 29.50x | 22.31x | 14.34x | 10.35x | 8.87x |
| Free Cash Flow Yield* | 1.41% | 1.62% | 2.85% | 3.92% | 5.30% |
| * For full definitions of iQ method SM measures, see page 7. |
This research report provides general information only. No part of this report may be used or reproduced or quoted in any manner whatsoever in Taiwan by the press or other persons without the express written consent of BofA Securities.
>> Employed by a non-US affiliate of BofAS and is not registered/qualified as a research analyst under the FINRA rules.
Refer to "Other Important Disclosures" for information on certain BofA Securities entities that take responsibility for the information herein in particular jurisdictions.
BofA Securities does and seeks to do business with issuers covered in its research reports. As a result, investors should be aware that the firm may have a conflict of interest that could affect the objectivity of this report. Investors should consider this report as only a single factor in making their investment decision.
Refer to important disclosures on page 8 to 11. Analyst Certification on page 5. Price
18 August 2026
Equity
Haas Liu >> Research Analyst Merrill Lynch (Taiwan) +886 2 2376 3727 haas.liu@bofa.com
Mike Yang >> Research Analyst Merrill Lynch (Taiwan) +886 2 2376 3729 mike.c.yang@bofa.com
Robert Cheng >> Research Analyst Merrill Lynch (Taiwan) +886 2 2376 3731 robert.cheng@bofa.com
Cathy Hsu >> Research Analyst Merrill Lynch (Taiwan) +886 2 2376 3726 cathy.hsu3@bofa.com
Stock Data
| Price (Common / ADR) | 2,380TWD/430.97USD |
|---|---|
| Price Objective | 3,100TWD/590.00USD |
| Date Established | 13-Jul-2026/24-Jun-2026 |
| Investment Opinion | B-1-7 / B-1-7 |
| 52-WeekRange | 1,135TWD-2,535TWD |
| Market Value (mn) | 1,938,656 USD |
| Market Value (mn) | 61,719,041 TWD |
| Shares Outstanding (mn) | 25,932.4 / 5,186.5 |
| Average Daily Value (mn) | 2,668 USD |
| Free Float | 92.1% |
| BofA Ticker / Exchange | TSMWF/ TAI |
| BofA Ticker / Exchange | TSM / NYS |
| Bloomberg / Reuters | 2330 TT / 2330.TW |
| ROE (2026E) | 43.0% |
| Net Dbt to Eqty (Dec-2025A) | -37.3% |
iQ profile SM Taiwan Semiconductor Manufacturing Co.
| Key Income Statement Data (Dec) | 2024A | 2025A | 2026E | 2027E | 2028E |
|---|---|---|---|---|---|
| (NT$ Millions) | |||||
| Sales | 2,894,308 | 3,809,054 | 5,477,153 | 7,624,785 | 8,920,142 |
| Gross Profit | 1,624,354 | 2,281,294 | 3,654,584 | 5,107,101 | 5,989,971 |
| Sell General &Admin Expense | (96,888) | (99,222) | (108,728) | (131,058) | (147,877) |
| Operating Profit | 1,322,053 | 1,936,092 | 3,251,539 | 4,604,996 | 5,423,431 |
| Net Interest &Other Income | 83,786 | 105,574 | 195,028 | 181,827 | 263,268 |
| Associates | NA | NA | NA | NA | NA |
| Pretax Income | 1,405,839 | 2,041,666 | 3,446,566 | 4,786,823 | 5,686,699 |
| Tax (expense) / Benefit | (233,407) | (326,266) | (589,232) | (817,495) | (971,303) |
| Net Income (Adjusted) | 1,173,268 | 1,717,886 | 2,857,919 | 3,972,158 | 4,718,757 |
| Average Fully Diluted Shares Outstanding | 25,932 | 25,933 | 25,933 | 25,933 | 25,933 |
| Key Cash Flow Statement Data | |||||
| Net Income | 1,173,268 | 1,717,886 | 2,857,919 | 3,972,158 | 4,718,757 |
| Depreciation &Amortization | 662,797 | 688,096 | 831,710 | 1,053,944 | 1,179,802 |
| Change in Working Capital | (143,010) | (72,100) | (98,157) | (169,601) | (63,286) |
| Deferred Taxation Charge | NA | NA | NA | NA | NA |
| Other Adjustments, Net | 133,123 | (58,907) | 155,002 | 77,356 | 95,369 |
| Cash Flow from Operations | 1,826,177 | 2,274,976 | 3,746,474 | 4,933,857 | 5,930,643 |
| Capital Expenditure | (956,007) | (1,272,411) | (1,987,705) | (2,512,151) | (2,662,089) |
| (Acquisition) / Disposal of Investments | (58,000) | (37,014) | (59,179) | 3,026 | 189 |
| Other Cash Inflow / (Outflow) | 149,164 | 165,031 | 118,284 | (4,000) | 1,931 |
| Cash Flow from Investing | (864,843) | (1,144,393) | (1,928,601) | (2,513,125) | (2,659,970) |
| Shares Issue / (Repurchase) | (9) | (2) | (1) (570,514) | 0 (622,381) | 0 (622,381) |
| Cost of Dividends Paid Financing | (337,129) | (440,855) | (622,960) | ||
| Cash Flow from | (346,301) | (440,345) | (577,519) | (624,257) | |
| Free Cash Flow | 870,171 | 1,002,565 | 1,758,769 | 2,421,706 | 3,268,553 |
| Net Debt | (1,403,733) | (2,035,607) | (3,385,555) | (5,181,108) | (7,829,225) |
| Change in Net Debt | (556,872) | (647,079) | (1,247,470) | (1,798,352) | (2,648,292) |
| Key Balance Sheet Data | |||||
| Property, Plant &Equipment | 3,234,980 | 3,691,841 | 5,058,473 | 6,595,644 | 8,000,659 |
| Other Non-Current Assets | 368,606 | 424,052 | 455,441 | 462,135 | 463,065 |
| Trade Receivables | 272,088 | 281,791 | 336,627 | 421,001 | 445,123 |
| Cash &Equivalents | 2,422,020 | 3,068,595 | 4,421,297 | 6,214,973 | 8,862,511 |
| Other Current Assets | 394,245 | 466,745 | 528,263 | 653,244 | 721,183 |
| Total Assets | 6,691,938 | 7,933,024 | 10,800,100 | 14,346,996 | 18,492,541 |
| Long-Term Debt | 958,429 | 896,062 | 887,047 | 884,597 | 884,290 |
| Other Non-Current Liabilities | 145,408 | 118,147 | 180,257 | 213,694 | 241,939 |
| Short-Term Debt | 59,858 | 136,926 | 148,695 | 149,268 | 148,995 |
| Other Current Liabilities | 1,204,667 | 1,321,094 | 1,682,253 | 1,737,804 | 1,782,535 |
| Total Liabilities | 2,368,362 | 2,472,229 | 2,898,251 | 2,985,363 | 3,057,760 |
| Total Equity | 4,323,576 | 5,460,795 | 7,901,849 | 11,361,634 | 15,434,781 |
| Total Equity &Liabilities | 6,691,938 | 7,933,024 | 10,800,100 | 14,346,996 | 18,492,541 |
| iQ method SM - Bus Performance* | |||||
| Return On Capital Employed | 23.2% | 28.4% | 35.7% | 36.6% | 32.2% |
| Return On Equity | 30.3% | 35.4% | 43.0% | 41.4% | 35.3% |
| Operating Margin | 45.7% | 50.8% | 59.4% | 60.4% | 60.8% |
| EBITDA Margin | 68.6% | 68.9% | 74.6% | 74.2% | 74.0% |
| iQ method SM - Quality of Earnings* | |||||
| Cash Realization Ratio | 1.6x | 1.3x | 1.3x | 1.2x | 1.3x |
| Asset Replacement Ratio | 1.4x | 1.8x | 2.4x | 2.4x | 2.3x |
| Tax Rate (Reported) | 16.6% | 16.0% | 17.1% | 17.1% | 17.1% |
| Net Debt-to-Equity Ratio | -32.5% | -37.3% | -42.8% | -45.6% | -50.7% |
| Interest Cover | NM | NM | NM | NM | NM |
Key Metrics
- For full definitions of iQ method SM measures, see page 7.
Company Sector
Semiconductors
Company Description
TSMC was founded in 1987 and is listed in Taiwan (2330TT) and the US (TSM/NYS).TSMC is the largest and global leader in integrated circuit (IC) manufacturing. As a build-to-order foundry, it provides a wide range of valueadd activities: IC manufacturing, mask-making, IC design services, turnkey solutions, and process development. We attribute its success to its proven, winning business model, unparalleled scale advantage, optimized execution, and technology scope and depth. 5 shares = 1 ADR.
Investment Rationale
The ongoing semi content growth in mobile, rise of artificial intelligence (AI), and proliferation of Internet of Things (IoT) should result in sustainable upside in aggregate computing power globally. TSMC, as the leading contract manufacturer of semiconductor chips, is in a good position to capitalize. We are structurally positive on TSMC and expect it to sustain over 15% growth with rising FCF from 2026 onwards.
| Stock Data | |
|---|---|
| Shares / ADR | 5.00 |
| Price to Book Value | 7.9x |
Focus charts and tables
Exhibit 1: TSMC's approved capital appropriations mix
The budget approved is lumpy on a quarterly basis but shows a trend toward front/back-end capacity expansion in the past couple of quarters
Source: BofA Global Research estimates
Exhibit 2: TSMC's approved capital appropriations vs. actual capex trend
TSMC's accumulated capital appropriations YoY growth is reaccelerating
Source: BofA Global Research estimates
BofA GLOBAL RESEARCH
BofA GLOBAL RESEARCH
Exhibit 3: TSMC's Arizona fab sales/net profit trend
TSMC's reported net profit for its Arizona fabs improved in 2Q26
Source:
BofA Global Research estimates
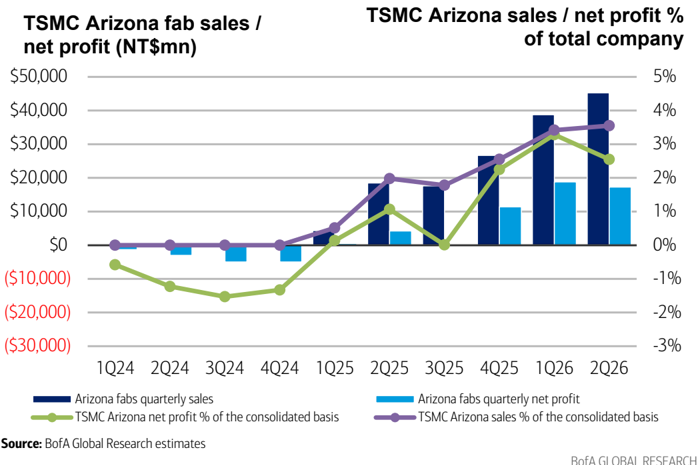
Exhibit 4: TSMC's Arizona fab sales/profit ex-grants trend
TSMC's Arizona fab margins ex-grants strengthened in 2Q26 and could improve further
Source: BofA Global Research estimates
BofA GLOBAL RESEARCH
BofA GLOBAL RESEARCH
Price objective basis & risk
Taiwan Semiconductor Manufacturing Co. (TSMWF / TSM)
Our PO for TSMC is NT$3,100 per share (US$590 per ADR), based on 20x 2027E P/E. TSMC's valuation has traded in the range of 10-26x PE from 2017. 20x is in the mid to high end of the historical range, above the average P/E of 18x. We think a PE above the average is justified given TSMC's enhanced industry position and mid-40% 5-year CAGR in AI should underpin a rerating
Downside risks to our price objective are: (1) greater-than-expected slowdown in global smartphone/consumer electronics demand, (2) Intel's potential insourcing strategy and ambitions in foundry service, (3) execution risks on advanced nodes, and (4) higher than expected tariffs.