260718_gs_mitac
PDF 原檔:報告_高盛_神達3706_20260718_original.pdf
圖片清單(已驗證 2026-07-20)
| 檔名 | size | 分類 | 親眼所見內容 |
|---|---|---|---|
260718_gs_mitac_001.png |
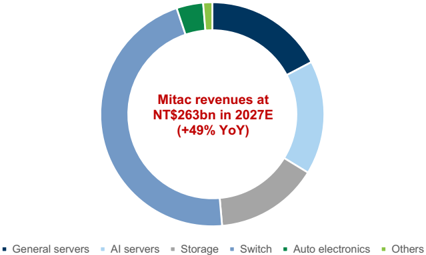
21KB | 真資料圖 | Exhibit 1:神達營收依產品別甜甜圈圖,中央標註「Mitac revenues at NT$263bn in 2027E (+49% YoY)」 |
260718_gs_mitac_002.png |
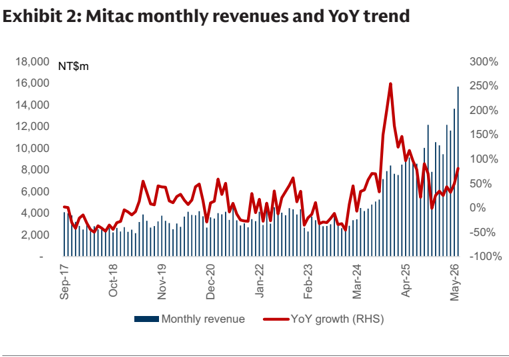
24KB | 真資料圖 | Exhibit 2:神達月營收長條圖 + YoY 成長率折線(Sep-17 至 May-26) |
260718_gs_mitac_003.png |
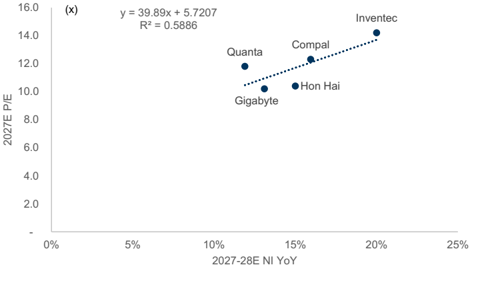
27KB | 真資料圖 | Exhibit 6:神達同業 2027E P/E vs 2027-28E 淨利 YoY 成長散點圖(含 Quanta/Compal/Inventec/Gigabyte/Hon Hai),附回歸線 |
260718_gs_mitac_004.png |
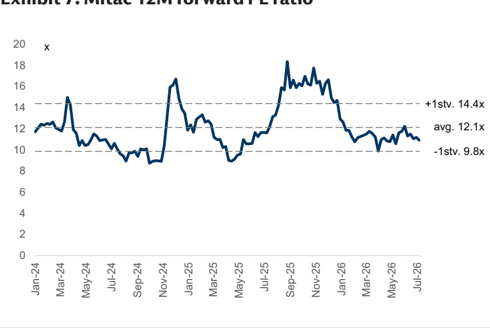
35KB | 真資料圖 | Exhibit 7:神達 12 個月 forward P/E 走勢圖(Jan-24 至 Jul-26),標註 +1stv 14.4x/均值 12.1x/-1stv 9.8x |
260718_gs_mitac_005.png |
39KB | 真資料圖 | Exhibit 8:神達 QFII(外資)持股比例走勢圖(Jan-24 至 Jul-26),最新約 8% |
260718_gs_mitac_006.png |
56KB | 真資料圖 | Exhibit 9:神達淨利長條圖 + 淨利率折線(2023-2028E),標註 2025-28E CAGR 25% |
260718_gs_mitac_007.png |
71KB | 真資料圖 | 神達(3706.TW)Goldman Sachs 評等與目標價沿革圖(2023-2026),最新目標價 137(本次報告下修前) |
原始內容
For the exclusive use of KEVINLU@LENOVO.COM
Mitac (3706.TW): New equipment procurement announced; AI liquid-cooled racks showcased in 2026 WAIC; Buy
Mitac announced new equipment procurement on July 16 (link), worth US$106m, post the US$74m announced on June 29. These two procurements total US$180m, or NT$5.4bn, and along with the 1Q26 capex of NT$1.5bn, the spending is 257% higher than 2025 capex of NT$1.9bn, re fl ecting Mitac's strong commitment on capacity expansion and customers' strong demand on AI infrastructure. The company's three new factories in US and one new factory in Taiwan started mass production in 2Q26, driving May / June revenues back to double digit QoQ, leading 2Q26 revenues up by 29% QoQ. With these new capacities ramping up, we expect 3Q26 revenues to increase by 10% QoQ, and accelerate to +32% QoQ in 4Q26 on the back of new factories in Taiwan and US entering mass production. Entering 2H26, we expect the company to expand from networking racks to AI liquid cooled server racks, further driving its product portfolio diversi fi cation and riding on the AI infrastructure upcycle. Maintain Buy.
Exhibit 1: Mitac revenues by products
Source: Goldman Sachs Global Investment Research
During the 2026 WAIC (world arti fi cial intelligence conference, July 17 - 20, Shanghai), Mitac showcased comprehensive AI infrastructure across CPU server, GPU server, storage, liquid-cooled rack, air-cooled rack, etc. re fl ecting its strong R&D to provide customized AI con fi guration for enterprises or tier-2 CSPs (link). As we highlighted in June, we raised global AI infrastructure spending (Global Server TAM): (1) AI servers implied AI chips were raised by 14% / 22% / 14% in 2026E-28E, (2) US CSPs' AI capex was raised by 8% / 27% / 25% in 2026-28E, and (3) China CSP's AI capex was raised by 37% / 44% / 55% in 2026E-28E, re fl ecting our positive view on the ongoing AI infrastructure upcycle. Key products Mitac showcased in 2026 WAIC:
Goldman Sachs does and seeks to do business with companies covered in its research reports. As a result, investors should be aware that the fi rm may have a con fl ict of interest that could a ff ect the objectivity of this report. Investors should consider this report as only a single factor in making their investment decision. For Reg AC certi fi cation and other important disclosures, see the Disclosure Appendix, or go to www.gs.com/research/hedge.html. Analysts employed by non-US a ffi liates are not registered/quali fi ed as research analysts with FINRA in the U.S.
Verena Jeng
+852-2978-1681 | verena.jeng@gs.com Goldman Sachs (Asia) L.L.C.
Allen Chang
+852-2978-2930 | allen.k.chang@gs.com Goldman Sachs (Asia) L.L.C.
Yifan Hu
+852-2978-0996 | yifan.hu@gs.com Goldman Sachs (Asia) L.L.C.
e92c7a75ab8b4efbba794e6b187208c8
For the exclusive use of KEVINLU@LENOVO.COM
(1) AI liquid-cooled rack, G4826Z5, powered by AMD MI355X GPU, aiming for massive AI model training with sustained high-throughput and minimal latency, (2) AI air-cooled rack, G8825Z5, powered by 8 AMD MI350X GPU per server, and one rack could contain four servers, aiming for training and inferencing, (3) AI liquid-cooled rack under OCP ORv3 standard, including 14 HPC servers (C2811Z5), powered by AMD EPYC 9005 series processors, o ff ering high-performance servers with optimizing energy utilization and fl exible rack con fi guration to secure a faster roll out, (4) high-density storage rack, TS70A-B8056, through the collaboration across hardware and software, the storage rack could facilitate computing e ffi ciency and agentic AI workload operation.
Source: Company data
Exhibit 3: Mitac monthly revenues preview
| Apr-26 | May-26 | Jun-26 | Jul-26 (E) | Aug-26 (E) | Sep-26 (E) | 1Q26 | 2Q26 | 3Q26E | |
|---|---|---|---|---|---|---|---|---|---|
| Rev (NT$m) | 11,633 | 13,639 | 15,683 | 14,114 | 14,820 | 15,922 | 31,864 | 40,954 | 44,857 |
| YoY | 32% | 49% | 81% | 65% | 140% | 59% | 35% | 54% | 81% |
| MoM/QoQ | -4% | 17% | 15% | -10% | 5% | 7% | 4% | 29% | 10% |
| GS estimates (NT$m) | 33,830 | 44,192 | |||||||
| Act. Vs. GS. | -6% | -7% |
Source: Company data, Goldman Sachs Global Investment Research
Earnings revision: We reduce 2026 / 27E net income by 12% / 5% and keep our 2028-30E estimates largely unchanged. The net income cut is mainly on lower revenues and GM, re fl ecting the gradual ramp up of new capacity in 2026, along with GM being a ff ected by (1) AI server racks carrying lower GM compared to the existing networking racks, (2) new capacity ramping up carrying higher depreciation and lower yield rate, and (3) high raw material costs. The company's GM declined from 12.6% in 2023 to 9.2% in 1Q26, and we model a similar GM level in coming years. Upside catalysts to our GM estimates include: (1) faster-than-expected capacity and yield rate ramp up, (2) higher-than-expected customization level of AI servers, (3) higher-than-expected customers exposure to enterprises, and (4) faster-than-expected raw material costs decline.
e92c7a75ab8b4efbba794e6b187208c8
For the exclusive use of KEVINLU@LENOVO.COM
Exhibit 4: Earnings revision
| 2026E | 2026E | 2028E | 2028E | 2028E | 2029E | 2029E | 2029E | 2030E | 2030E | 2030E | 2030E | ||||
|---|---|---|---|---|---|---|---|---|---|---|---|---|---|---|---|
| NT$m | Old | New | Diff% | Old | New | Diff% | Old | New | Diff% | Old | New | Diff% | Old | New | Diff% |
| Revenues | 199,768 | 176,700 | -12% | 263,945 | 263,383 | 0% | 304,260 | 303,904 | 0% | 347,143 | 345,622 | 0% | 387,717 | 388,862 | 0% |
| GP | 21,498 | 16,158 | -25% | 24,922 | 23,486 | -6% | 27,594 | 27,627 | 0% | 30,462 | 30,601 | 0% | 33,388 | 33,308 | 0% |
| OP | 11,397 | 8,970 | -21% | 13,592 | 12,816 | -6% | 15,119 | 15,076 | 0% | 16,402 | 16,431 | 0% | 18,073 | 18,142 | 0% |
| Net income | 10,610 | 9,347 | -12% | 12,354 | 11,715 | -5% | 13,282 | 13,228 | 0% | 14,074 | 14,065 | 0% | 15,228 | 15,210 | 0% |
| EPS (diluted) | 7.98 | 7.03 | -12% | 9.29 | 8.81 | -5% | 9.99 | 9.95 | 0% | 10.59 | 10.58 | 0% | 11.46 | 11.44 | 0% |
| Margins | |||||||||||||||
| GM | 10.7% | 9.1% | 9.4% | 8.9% | 9.1% | 9.1% | 8.8% | 8.9% | 8.6% | 8.6% | |||||
| Opex ratio | 5.0% | 4.1% | 4.3% | 4.1% | 4.2% | 4.1% | 4.1% | 4.1% | 4.0% | 3.9% | |||||
| OPM | 5.7% | 5.1% | 5.1% | 4.9% | 5.0% | 5.0% | 4.7% | 4.8% | 4.7% | 4.7% | |||||
| NM | 5.4% | 5.3% | 4.7% | 4.4% | 4.4% | 4.4% | 4.1% | 4.1% | 4.0% | 3.9% |
Source: Goldman Sachs Global Investment Research
Exhibit 5: Mitac P&L
| (NT$ m) | 1Q25 | 2Q25 | 3Q25 | 4Q25 | 1Q26 | 2Q26E | 3Q26E | 4Q26E | 2024 | 2025 | 2026E | 2027E | 2028E | 2029E | 2030E |
|---|---|---|---|---|---|---|---|---|---|---|---|---|---|---|---|
| Revenue | 23,665 | 26,624 | 24,762 | 30,526 | 31,864 | 40,954 | 44,857 | 59,024 | 61,360 | 105,577 | 176,700 | 263,383 | 303,904 | 345,622 | 388,862 |
| Gross profit | 2,779 | 2,854 | 3,285 | 3,061 | 2,934 | 3,738 | 4,149 | 5,337 | 7,368 | 11,980 | 16,158 | 23,486 | 27,627 | 30,601 | 33,308 |
| Operating income | 1,239 | 1,253 | 1,672 | 1,210 | 1,184 | 1,969 | 2,351 | 3,466 | 1,784 | 5,374 | 8,970 | 12,816 | 15,076 | 16,431 | 18,142 |
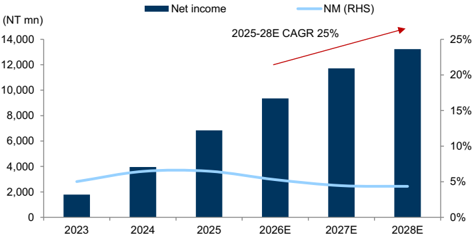
| Net income | 1,342 | 1,487 | 2,059 | 1,949 | 1,461 | 1,850 | 2,511 | 3,526 | 3,959 | 6,838 | 9,347 | 11,715 | 13,228 | 14,065 | 15,210 |
| EPS, diluted (NT$) | 1.11 | 1.23 | 1.55 | 1.25 | 1.10 | 1.39 | 1.89 | 2.65 | 3.28 | 5.15 | 7.03 | 8.81 | 9.95 | 10.58 | 11.44 |
| Margins / ratio | |||||||||||||||
| Gross margin | 11.7% | 10.7% | 13.3% | 10.0% | 9.2% | 9.1% | 9.3% | 9.0% | 12.0% | 11.3% | 9.1% | 8.9% | 9.1% | 8.9% | 8.6% |
| Opex ratio | -6.5% | -6.0% | -6.5% | -6.1% | -5.5% | -4.3% | -4.0% | -3.2% | -9.1% | -6.3% | -4.1% | -4.1% | -4.1% | -4.1% | -3.9% |
| Operating margin | 5.2% | 4.7% | 6.8% | 4.0% | 3.7% | 4.8% | 5.2% | 5.9% | 2.9% | 5.1% | 5.1% | 4.9% | 5.0% | 4.8% | 4.7% |
| Net margin | 5.7% | 5.6% | 8.3% | 6.4% | 4.6% | 4.5% | 5.6% | 6.0% | 6.5% | 6.5% | 5.3% | 4.4% | 4.4% | 4.1% | 3.9% |
| QoQ | |||||||||||||||
| Revenue | 1% | 13% | -7% | 23% | 4% | 29% | 10% | 32% | |||||||
| Gross profit | 11% | 3% | 15% | -7% | -4% | 27% | 11% | 29% | |||||||
| Operating income | 71% | 1% | 33% | -28% | -2% | 66% | 19% | 47% | |||||||
| Net income | 32% | 11% | 38% | -5% | -25% | 27% | 36% | 40% | |||||||
| EPS, diluted | 32% | 11% | 26% | -19% | -12% | 27% | 36% | 40% | |||||||
| YoY | |||||||||||||||
| Revenue | 145% | 103% | 63% | 30% | 35% | 54% | 81% | 93% | 73% | 72% | 67% | 49% | 15% | 14% | 13% |
| Gross profit | 113% | 68% | 76% | 23% | 6% | 31% | 26% | 74% | 64% | 63% | 35% | 45% | 18% | 11% | 9% |
| Operating income | 2151% | 185% | 197% | 67% | -4% | 57% | 41% | 186% | nm | 201% | 67% | 43% | 18% | 9% | 10% |
| Net income | 94% | 34% | 80% | 92% | 9% | 24% | 22% | 81% | 122% | 73% | 37% | 25% | 13% | 6% | 8% |
Source: Company data, Goldman Sachs Global Investment Research
Valuation: We continue to derive our target price via near-term PE and roll over from 2026E to 2027E. We continue to derive our target P/E multiple from peers' trading P/E vs. forward year EPS growth (methodology unchanged with updated numbers), which is at 13.3x (vs. 14.7x of our previous TP implied 2027E PE), re fl ecting the recent sector de-rating under AI server model transition. Our new target PE multiple continues to be above Mitac's historical avg. PE of 12.1x, re fl ecting our positive view on its AI products expansion. TP at NT$117 (13.3x 2027E PE vs. 19% NI YoY in 2027-28E on avg.), vs. NT$137 previously. Maintain Buy.
Exhibit 6: Mitac peers PE vs. forward year NI YoY
Source: Goldman Sachs Global Investment Research
Exhibit 7: Mitac 12M forward PE ratio
Source: Company data, Goldman Sachs Global Investment Research, Bloomberg
e92c7a75ab8b4efbba794e6b187208c8
For the exclusive use of KEVINLU@LENOVO.COM
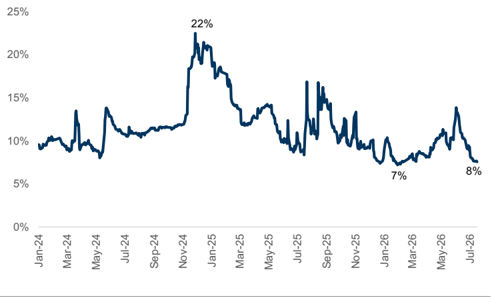
Exhibit 8: Mitac QFII holdings
Source: TEJ
Exhibit 9: Mitac net income trend
Source: Company data, Goldman Sachs Global Investment Research
Valuation: We are Buy rated on Mitac. We derive our 12M TP of NT$117 on a target P/E multiple of 13.3x our 2027E EPS. Our target P/E of 13.3x is derived from the correlation between P/E and EPS growth of Mitac's peers, based on Mitac's 2027E-28E EPS YoY growth.
Key risks: Slower-than-expected AI server shipment ramp up pace; slower-than-expected networking equipment ramp up pace; fi ercer-than-expected market competition.
| 3706.TW | 12m Price Target: NT$117.00 | Price: NT$88.30 | Price: NT$88.30 | Upside: 32.5% | Upside: 32.5% |
|---|---|---|---|---|---|
| Buy | Buy | ||||
| Market c ap: NT$117.4b n / $ 3 . 6 b n En terpr is e v a lu e: NT$1 22 . 0 b n / $ 3 . 8 b n 3m AD T V : NT$ 2 . 0 b n / $ 63 . 6mn Ta iw a n G reater Chin a Te chnology M &A R a n k: 3 L ea s e s incl . in n et d ebt & EV? : Y e s | Revenue (NT$m n ) N e w Revenue (NT$ mn) Old EBITDA (NT$ mn) E PS(NT$) N e w EPS (NT$) Old P/E (X) P/B (X) Dividend yield (%) CROCI (%) EPS (NT$) | 12/25 1 0 5 , 577 .0 111,861.8 6,710.5 5 . 15 5.56 13.7 1.3 4.2 28.3 3 /26 1.10 | 12/26E 176 , 6 99. 6 199,768.4 10,632.5 7 .03 7.98 12.6 1.6 4.6 22.7 6/26E 1.39 | 12/27E 26 3,3 82 . 8 263,945.4 14,494.3 8 . 81 9.29 10.0 1.5 5.8 22.1 9 /26E 1.89 | 12/28E 303,903. 6 304,259.8 16,760.8 9.9 5 9.99 8.9 1.4 6.6 23.7 12/26E 2.65 |
Source: Company data, Goldman Sachs Research estimates, FactSet. Price as of 17 Jul 2026 close.
e92c7a75ab8b4efbba794e6b187208c8
For the exclusive use of KEVINLU@LENOVO.COM