PDF 原檔:報告_野村_國巨2327_20260701_original.pdf
圖片清單(已驗證 2026-07-03)
| 檔名 | size | 分類 | 親眼所見內容 |
|---|---|---|---|
報告_野村_國巨2327_20260701_003.png |
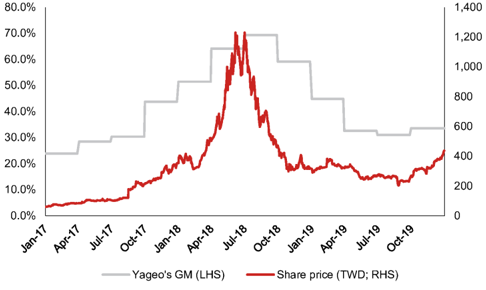
40KB | 真資料圖 | Fig.2 國巨毛利率 vs 股價(2017–2019 上一輪上行週期,GM 峰值 ~63%) |
報告_野村_國巨2327_20260701_004.png |
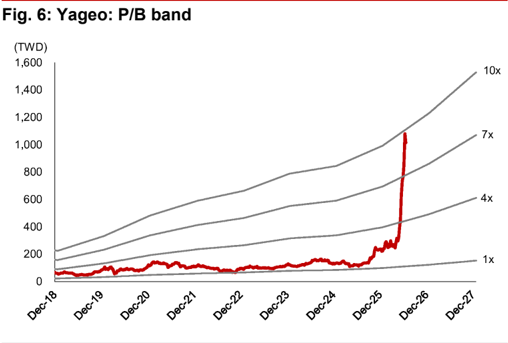
41KB | 真資料圖 | Fig.6 P/B band(1x–10x,2026 股價急漲至 7x 附近) |
報告_野村_國巨2327_20260701_006.png |
109KB | 真資料圖 | 野村評等/目標價三年沿革圖 + 表(2023-07 TP 112.99 → 2026-04 TP 415) |
皆股價/估值/評等圖,lib 不嵌。<40KB 未列(_001/_002/_005)。
原始內容
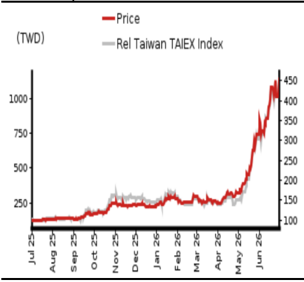
Relative performance chart
EQUITY: TECHNOLOGY
Price
(TWD)
1000-
750-
500-
2501
7-400
- 350
-300
-250
-200
YAGEO Corporation 2327.TW 2327 TT
EQUITY: TECHNOLOGY
Churra. I CEC Namura
Enjoying stronger pricing power in this upcycle
The upcycle is still in the early stage and could last longer than the previous cycle; maintain Buy
Action: Maintain Buy; lift TP to TWD1,350, implying ~18% upside
We raise 2026F/27F/28F EPS from TWD18.7/24.4/29.2 to TWD20.9/33.2/45.0 due to a likely structural passive component industry shortage and an accelerated capacitor price hike. We think the current strong AI demand for high-cap MLCC at Murata (6981 JP, Buy) and SEMCO (009150 KS, Buy) is crowding out allocation to non-AI applications, and demand overflows could benefit Greater China passive makers such as Yageo whose current portfolios are skewed towards the 'low-end' and boost their pricing power. Specifically for Yageo, we believe it could leverage a broader product lineup for bundle sales of tantalum capacitors and R-chips (of which it is the world's largest manufacturer, according to Yageo) with MLCCs, at a more favorable pricing to monetize the structural uptrend. As such, we raise our TP to TWD1,350 (from TWD415), based on 30x 2028F EPS of TWD45.0 (previously 19x 2H26-1H27F EPS of TWD21.8), with the target multiple at the higher end of Yageo's historical trading band (8-40x) to discount the AI-driven business rally and a more favorable pricing environment. The stock currently trades at 34x 2027F EPS.
A more sound upcycle that could last longer than the previous one (2017-18)
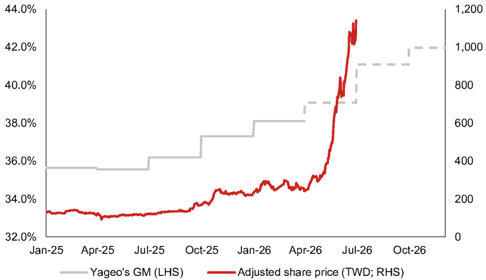
Based on the previous upcycle, we believe the share price could peak roughly a quarter ahead of its gross margin (GM) peak (Fig. 1 ), and so far Yageo's GM is still in the early stage of expansion (Fig. 2 ). Also, we think the current AI-driven cycle might last longer than the previous cycle underpinned by automobile electrification, due to: 1) a much faster organic revenue growth for AI chips (TSMC [2330 TT, Buy] estimates at high-50% over 2024-29E; report ) vs. a long-term automobile industry CAGR of 5-10%; and 2) a faster AI platform refresh cadence (almost one new generation every year). We estimate Yageo's GM will expand from 36.2% in 2025 to 48.3% in 2028F, still below the 2018 high of 63.3%. We advise monitoring whether pricing dynamics would be in favor of Yageo given a likely worsening industry supply/demand imbalance into 2027-28F.
Massive content increases and capacity drain by AI is the root cause
Our industry checks suggest >3x MLCC content growth in nVidia's (NVDA US, Not rated) upcoming VR200 vs. GB300. Although Yageo is not a direct MLCC supplier, the significant capacity drain at Murata and SEMCO could squeeze allocation to notably mid/high-cap names with demand overflowing to Yageo for a richer mix. We also expect more tantalum capacitor to be used in AWS Trainium 3 vs. the prior generation, and Yageo is a leading tantalum capacitor supplier globally.
| Year-end 31 Dec Currency (TWD) | FY25 Actual | FY26F New | FY27F New | Old | FY28F New | ||
|---|---|---|---|---|---|---|---|
| Old | Old | ||||||
| Revenue (mn) | 132,930 | 174,417 | 186,351 | 211,612 | 245,013 | 244,216 | 301,989 |
| Reported net profit (mn) | 23,634 | 38,348 | 42,853 | 50,075 | 68,073 | 59,966 | 92,414 |
| Normalised net profit (mn) | 23,634 | 38,348 | 42,853 | 50,075 | 68,073 | 59,966 | 92,414 |
| FD normalised EPS | 11.51 | 18.68 | 20.87 | 24.39 | 33.15 | 29.20 | 45.00 |
| FD norm. EPS growth (%) | 20.8 | 62.3 | 81.3 | 30.6 | 58.9 | 19.8 | 35.8 |
| FD normalised P/E (x) | 99.0 | - | 54.6 | - | 34.4 | - | 25.3 |
| EV/EBITDA (x) | 61.0 | - | 37.2 | - | 24.0 | - | 17.6 |
| Price/book (x) | 13.5 | - | 11.5 | - | 9.2 | - | 7.4 |
| Dividend yield (%) | 0.5 | - | 0.8 | - | 1.3 | - | 1.8 |
| ROE (%) | 15.8 | 22.8 | 25.5 | 23.1 | 29.7 | 23.8 | 32.5 |
| Net debt/equity (%) | 32.7 | 11.0 | 9.7 | net cash | net cash | net cash | net cash |
Source: Company data, Nomura estimates
Global Markets Research 1 July 2026
| Rating Remains | Buy |
|---|---|
| Target price Increased from TWD 415.00 | TWD 1,350.00 |
| Closing price 1 July 2026 | TWD 1,140.00 |
| Implied upside | +18.4% |
| Market Cap (USD mn) | 74,122.5 |
| ADT (USD mn) | 995.6 |
Relative performance chart
Source: LSEG, Nomura
Research Analysts
Taiwan Technology
Anne Lee, CFA - NITB anne.lee@nomura.com +886(2) 21769966
Eric Chen, CFA - NITB
eric.chen@nomura.com +886(2) 21769965
Carol Hu - NITB
carol.r.hu@nomura.com +886(2) 21769963
Production Complete: 2026-07-01 12:20 UTC
Key data on YAGEO Corporation
Performance
| (%) | 1M | 3M | 12M | ||
|---|---|---|---|---|---|
| Absolute (TWD) | 44.3 | 353.3 | 831.6 | M cap (USDmn) | 74,122.5 |
| Absolute (USD) | 42 | 353.8 | 752.6 | Free float (%) | 72.0 |
| Rel to Taiwan TAIEX Index | 42.6 | 314.2 | 727 | 3-mth ADT (USDmn) | 995.6 |
Income statement (TWDmn)
| Year-end 31 Dec | FY24 | FY25 | FY26F | FY27F | FY28F |
|---|---|---|---|---|---|
| Revenue | 121,667 | 132,930 | 186,351 | 245,013 | 301,989 |
| Cost of goods sold | -79,864 | -84,800 | -111,352 | -132,880 | -156,144 |
| Gross profit | 41,803 | 48,130 | 74,999 | 112,134 | 145,845 |
| SG&A | -18,418 | -18,329 | -21,613 | -26,072 | -28,577 |
| Employee share expense | |||||
| Operating profit | 23,386 | 29,801 | 53,386 | 86,061 | 117,268 |
| EBITDA | 33,014 | 39,635 | 64,070 | 97,595 | 129,652 |
| Depreciation | -9,629 | -9,834 | -10,684 | -11,534 | -12,384 |
| Amortisation | |||||
| EBIT | 23,386 | 29,801 | 53,386 | 86,061 | 117,268 |
| Net interest expense | 2,190 | 1,571 | 1,212 | 1,212 | 1,212 |
| Associates & JCEs | |||||
| Other income | 1,287 | -252 | 409 | 0 | 0 |
| Earnings before tax | 26,863 | 31,120 | 55,007 | 87,273 | 118,480 |
| Income tax | -7,377 | -7,343 | -12,117 | -19,200 | -26,066 |
| Net profit after tax | 19,487 | 23,777 | 42,890 | 68,073 | 92,414 |
| Minority interests | -130 | -143 | -37 | 0 | 0 |
| Other items | |||||
| Preferred dividends | |||||
| Normalised NPAT | 19,356 | 23,634 | 42,853 | 68,073 | 92,414 |
| Extraordinary items | |||||
| Reported NPAT | 19,356 | 23,634 | 42,853 | 68,073 | 92,414 |
| Dividends | -10,265 | -12,344 | -19,284 | -30,633 | -41,586 |
| Transfer to reserves | 9,091 | 11,290 | 23,569 | 37,440 | 50,828 |
| Valuations and ratios | |||||
| Reported P/E (x) | 119.6 | 99.0 | 54.6 | 34.4 | 25.3 |
| Normalised P/E (x) | 119.6 | 99.0 | 54.6 | 34.4 | 25.3 |
| FD normalised P/E (x) | 119.6 | 99.0 | 54.6 | 34.4 | 25.3 |
| Dividend yield (%) | 0.4 | 0.5 | 0.8 | 1.3 | 1.8 |
| Price/cashflow (x) | 74.3 | 75.8 | 40.3 | 34.2 | 24.9 |
| Price/book (x) | 14.2 | 13.5 | 11.5 | 9.2 | 7.4 |
| EV/EBITDA (x) | 73.9 | 61.0 | 37.2 | 24.0 | 17.6 |
| EV/EBIT (x) | 104.3 | 81.2 | 44.6 | 27.2 | 19.5 |
| Gross margin (%) | 34.4 | 36.2 | 40.2 | 45.8 | 48.3 |
| EBITDA margin (%) | 27.1 | 29.8 | 34.4 | 39.8 | 42.9 |
| EBIT margin (%) | 19.2 | 22.4 | 28.6 | 35.1 | 38.8 |
| Net margin (%) | 15.9 | 17.8 | 23.0 | 27.8 | 30.6 |
| Effective tax rate (%) | 27.5 | 23.6 | 22.0 | 22.0 | 22.0 |
| Dividend payout (%) | 53.0 | 52.2 | 45.0 | 45.0 | 45.0 |
| ROE (%) | 15.0 | 15.8 | 25.5 | 29.7 | 32.5 |
| ROA (pretax %) | 8.0 | 9.7 | 17.1 | 26.7 | 34.8 |
| Growth (%) | |||||
| Revenue | 13.1 | 9.3 | 40.2 | 31.5 | 23.3 |
| EBITDA | 13.2 | 20.1 | 61.7 | 52.3 | 32.8 |
| Normalised EPS | -8.8 | 20.8 | 81.3 | 58.9 | 35.8 |
| Normalised FDEPS | -8.8 | 20.8 | 81.3 | 58.9 | 35.8 |
Source: Company data, Nomura estimates
Cashflow statement (TWDmn)
| Year-end 31 Dec | FY24 | FY25 | FY26F | FY27F | FY28F |
|---|---|---|---|---|---|
| EBITDA | 33,014 | 39,635 | 64,070 | 97,595 -11,205 | 129,652 |
| Change in working capital Other operating cashflow | -664 -1,188 | 3,716 -12,488 | 4,512 -10,533 | -17,988 | -10,954 -24,854 |
| Cashflow from operations | 31,162 | 30,863 | 58,049 | 68,402 | 93,845 |
| Capital expenditure | -6,363 | -5,588 | -8,500 | -8,500 | -8,500 |
| 24,799 | 25,275 | 49,549 | 59,902 | 85,345 | |
| Free cashflow | -22,731 | 18,667 | |||
| Reduction in investments | 0 | 0 | 0 | ||
| Net acquisitions | 0 | 0 | 0 | 0 | 0 |
| Dec in other LT assets liabilities | 0 | 0 | 0 | 0 | 0 0 |
| Inc in other LT Adjustments | 0 | 0 | 0 | 0 | |
| -666 | -16,805 | 0 | 0 | 0 | |
| CF after investing acts | 1,402 | 27,138 | 49,549 | 59,902 | 85,345 |
| Cash dividends | -8,369 | -10,265 | -12,344 | -19,284 | -30,633 |
| Equity issue | 0 | 0 | 0 | 0 | 0 |
| Debt issue | 12,200 | 7,070 | 0 | 0 | 0 |
| Convertible debt issue | |||||
| Others acts | 2,933 | -3,587 | 0 | 0 | 0 |
| CF from financial | 6,764 | -6,782 | -12,344 | -19,284 | -30,633 |
| Net cashflow | 8,166 | 20,356 | 37,205 | 40,618 | 54,712 |
| Beginning cash | 52,951 | 61,118 | 81,473 | 118,678 | 159,296 |
| Ending cash | 61,118 | 81,473 | 118,678 | 159,296 | 214,008 |
| Ending net debt | 78,195 | 56,962 | 19,757 | -20,861 | -75,572 |
| Balance sheet (TWDmn) | |||||
| As at 31 Dec | FY24 | FY25 | FY26F | FY27F | FY28F |
| Cash & equivalents | 61,118 | 81,473 | 118,678 | 159,296 | 214,008 |
| Marketable securities | 40,704 | 16,634 | 16,634 | 16,634 | 16,634 |
| Accounts receivable | 21,969 | 27,792 | 33,543 | 44,102 | 54,358 |
| Inventories | 27,823 | 34,519 | 41,193 | 48,405 | |
| 31,636 | |||||
| Other current assets | 6,674 | 7,811 | 7,811 | 7,811 | 7,811 |
| Total current assets | 158,288 | 165,346 | 211,186 | 269,037 44,974 | 341,216 44,974 |
| LT investments Fixed assets | 39,141 | 44,974 | 44,974 63,121 | 60,087 | |
| 66,410 | 65,305 | 56,203 | |||
| Goodwill | 94,926 | 106,700 | 106,700 | 106,700 | 106,700 |
| Other intangible assets | |||||
| Other LT assets | 7,911 | 8,464 | 8,416 | 8,416 | 8,416 |
| Total assets | 366,676 | 390,789 | 434,397 | 489,214 | 557,509 |
| 76,348 | 76,348 | ||||
| Short-term debt | 68,735 | 76,348 | 76,348 | ||
| Accounts payable | 15,003 | 18,031 | 31,179 | 37,206 | 43,720 |
| Other current liabilities | 30,240 | 41,700 | 41,700 | 41,700 | 41,700 |
| Total current liabilities | 113,978 | 136,079 | 149,226 | 155,254 | 161,768 |
| Long-term debt | 70,578 | 62,088 | 62,088 | 62,088 | 62,088 |
| Convertible debt | |||||
| Other LT liabilities | 19,566 | 18,626 | 18,626 | 18,626 | 18,626 |
| Total liabilities | 204,123 | 216,793 | 229,940 | 235,968 | 242,481 |
| Minority interest Preferred stock | |||||
| Common stock | 5,188 | 5,182 | 5,134 | 5,134 | 5,134 |
| Retained earnings | 147,616 | 161,842 | 192,351 | 241,141 | 302,922 |
| Proposed dividends Other equity and | 9,749 | 6,972 | 6,972 | 6,972 | 6,972 |
| reserves Total shareholders' equity | 162,553 | 173,997 | 204,457 | 253,246 | 315,028 |
| Total equity & liabilities | 366,676 | 390,789 | 434,397 | 489,214 | 557,509 |
| Liquidity (x) | |||||
| Current ratio | 1.39 | 1.22 | 1.42 | 1.73 | 2.11 |
| Interest cover | - | - | - | - | - |
| Leverage Net debt/EBITDA | 2.37 | 1.44 | 0.31 | net cash | net cash |
| (x) Net debt/equity (%) | 48.1 | 32.7 | 9.7 | net cash | net cash |
| Per share | |||||
| Reported EPS (TWD) | 9.53 | 11.51 | 20.87 | 33.15 | 45.00 |
| Norm EPS (TWD) | 9.53 | 11.51 | 20.87 | 33.15 | 45.00 |
| FD norm EPS (TWD) | 9.53 | 11.51 | 20.87 | 33.15 | 45.00 |
| BVPS (TWD) | 80.05 | 84.74 | 99.56 | 123.32 | 153.41 |
| DPS (TWD) | 5.00 | 6.00 | 9.39 | 14.92 | 20.25 |
| Activity (days) | |||||
| Days receivable | 63.6 | 68.3 | 60.1 | 57.8 | 59.7 |
| Days inventory | 125.5 | 128.0 | 108.4 | 104.0 | 105.0 |
| Days payable Cash cycle | 69.4 119.8 | 71.1 125.2 | 80.7 87.8 | 93.9 67.9 | 94.8 69.8 |
Source: Company data, Nomura estimates
Company profile
Yageo is the global largest R-chip and tantalum capacitor and 3rd largest MLCC and inductor supplier (in terms of capacity). It has high market share in global passive components industry.
Valuation Methodology
Our target price for Yageo is TWD1,350, which is based on 30x 2028F EPS of TWD45.0. Our 30x P/E multiple is at the higher end of 8-40x P/E range since 2018. The benchmark index is TAIEX.
Risks that may impede the achievement of the target price
Key downside risks: 1) longer than expected inventory correction resulting in a low UTR, which would pressure ASPs; 2) failure to pass through high raw material costs from the high inflation in 2021; 3) intensifying competition from Greater China vendors; and 4) Higher OPEX than expected by new sensor business
ESG
Yageo corporation declares the metal conflict-free on products supplied to consumers. Yageo take due diligence with supply chain to assure the metals are not derived from or sourced from mines in conflict areas. Yageo establish and implement enviromental management of energy saving and waste minimization, strengthen resources recycling and reuse, reduce and disuse environment-prohibited material.
80.0%
70.0%
60.0%
50.0%
40.0%
30.0%
20.0%
10.0%
0.0%
Apr-17
1,400
1,200
1,000
Fig. 1: Yageo share price vs. GM trend in the 2017-18 upcycle
600
400
38.0%
36.0%
34.0%
32.0%
Jan-25
1,000
800
600
400
Source: Company data, Nomura estimates
Source: Company data, Nomura research
Fig. 3: Yageo: Earnings forecast revisions
| New forecasts | New forecasts | New forecasts | Previous forecasts | Previous forecasts | Previous forecasts | Change (%) | Change (%) | Change (%) | |
|---|---|---|---|---|---|---|---|---|---|
| TWD mn | 2026F | 2027F | 2028F | 2026F | 2027F | 2028F | 2026F | 2027F | 2028F |
| Revenue | 186,351 | 245,013 | 301,989 | 174,417 | 211,612 | 244,216.0 | 6.8 | 15.8 | 23.7 |
| Gross profit | 74,999 | 112,134 | 145,845 | 68,686 | 85,325 | 99,633.2 | 9.2 | 31.4 | 46.4 |
| Operating profit | 53,386 | 86,061 | 117,268 | 47,873 | 63,336 | 76,017.1 | 11.5 | 35.9 | 54.3 |
| Pretax profit | 55,007 | 87,273 | 118,480 | 49,231 | 64,199 | 76,879.3 | 11.7 | 35.9 | 54.1 |
| Net profit | 42,853 | 68,073 | 92,414 | 38,348 | 50,075 | 59,965.8 | 11.7 | 35.9 | 54.1 |
| EPS (TWD) | 20.87 | 33.15 | 45.00 | 18.68 | 24.39 | 29.2 | |||
| Margins (%) | |||||||||
| Gross margin | 40.2 | 45.8 | 48.3 | 39.4 | 40.3 | 40.8 | 0.9 | 5.4 | 7.5 |
| Operating margin | 28.6 | 35.1 | 38.8 | 27.4 | 29.9 | 31.1 | 1.2 | 5.2 | 7.7 |
| Pretax margin | 29.5 | 35.6 | 39.2 | 28.2 | 30.3 | 31.5 | 1.3 | 5.3 | 7.8 |
| Net margin | 23.0 | 27.8 | 30.6 | 22.0 | 23.7 | 24.6 | 1.0 | 4.1 | 6.0 |
Source: Nomura estimates
Fig. 4: Yageo: P&L
| (TWDm) | 1Q25 | 2Q25 | 3Q25 | 4Q25 | 2025 | 1Q26 | 2Q26F | 3Q26F | 4Q26F | 2026F | 1Q27F | 2Q27F | 3Q27F | 4Q27F | 2027F | 2028F |
|---|---|---|---|---|---|---|---|---|---|---|---|---|---|---|---|---|
| Net revenue | 31,104 | 32,771 | 33,087 | 35,968 | 132,930 | 38,166 | 45,011 | 50,114 | 53,061 | 186,351 | 55,409 | 59,544 | 63,478 | 66,582 | 245,013 | 301,989 |
| COGS | 20,018 | 21,119 | 21,112 | 22,551 | 84,800 | 23,624 | 27,421 | 29,519 | 30,789 | 111,352 | 30,830 | 32,291 | 34,093 | 35,666 | 132,880 | 156,144 |
| Gross profit | 11,086 | 11,652 | 11,974 | 13,417 | 48,130 | 14,542 | 17,590 | 20,595 | 22,272 | 74,999 | 24,580 | 27,253 | 29,386 | 30,916 | 112,134 | 145,845 |
| Op expenses | 4,623 | 4,609 | 4,412 | 4,685 | 18,329 | 4,929 | 5,241 | 5,555 | 5,888 | 21,613 | 6,006 | 6,367 | 6,749 | 6,951 | 26,072 | 28,577 |
| Op profit | 6,463 | 7,044 | 7,562 | 8,732 | 29,801 | 9,613 | 12,349 | 15,040 | 16,384 | 53,386 | 18,573 | 20,886 | 22,637 | 23,965 | 86,061 | 117,268 |
| Non-op income | 710 | (15) | 650 | (26) | 1,319 | 712 | 303 | 303 | 303 | 1,621 | 303 | 303 | 303 | 303 | 1,212 | 1,212 |
| Pretax profit | 7,173 | 7,028 | 8,212 | 8,706 | 31,120 | 10,325 | 12,652 | 15,343 | 16,687 | 55,007 | 18,876 | 21,189 | 22,940 | 24,268 | 87,273 | 118,480 |
| Net profit | 5,530 | 4,998 | 6,356 | 6,751 | 23,634 | 8,001 | 9,869 | 11,968 | 13,016 | 42,853 | 14,724 | 16,528 | 17,893 | 18,929 | 68,073 | 92,414 |
| EPS (TWD) | 2.69 | 2.43 | 3.10 | 3.29 | 11.51 | 3.90 | 4.81 | 5.83 | 6.34 | 20.87 | 7.17 | 8.05 | 8.71 | 9.22 | 33.15 | 45.00 |
| Operating ratios (%) | ||||||||||||||||
| Gross margin | 35.6% | 35.6% | 36.2% | 37.3% | 36.2% | 38.1% | 39.1% | 41.1% | 42.0% | 40.2% | 44.4% | 45.8% | 46.3% | 46.4% | 45.8% | 48.3% |
| Operating margin | 20.8% | 21.5% | 22.9% | 24.3% | 22.4% | 25.2% | 27.4% | 30.0% | 30.9% | 28.6% | 33.5% | 35.1% | 35.7% | 36.0% | 35.1% | 38.8% |
| Pretax profit margin | 23.1% | 21.4% | 24.8% | 24.2% | 23.4% | 27.1% | 28.1% | 30.6% | 31.4% | 29.5% | 34.1% | 35.6% | 36.1% | 36.4% | 35.6% | 39.2% |
| Net profit margin | 17.8% | 15.3% | 19.2% | 18.8% | 17.8% | 21.0% | 21.9% | 23.9% | 24.5% | 23.0% | 26.6% | 27.8% | 28.2% | 28.4% | 27.8% | 30.6% |
| Year-to-year (%) | ||||||||||||||||
| Net revenue | 9% | 4% | 4% | 20% | 9% | 23% | 37% | 51% | 48% | 40% | 45% | 32% | 27% | 25% | 31% | 23% |
| Gross profit | 15% | 6% | 7% | 35% | 15% | 31% | 51% | 72% | 66% | 56% | 69% | 55% | 43% | 39% | 50% | 30% |
| Operating profit | 30% | 9% | 14% | 65% | 27% | 49% | 75% | 99% | 88% | 79% | 93% | 69% | 51% | 46% | 61% | 36% |
| Pretax profit | 18% | -5% | 14% | 41% | 16% | 44% | 80% | 87% | 92% | 77% | 83% | 67% | 50% | 45% | 59% | 36% |
| Net profit | 20% | -8% | 13% | 85% | 22% | 45% | 97% | 88% | 93% | 81% | 84% | 67% | 50% | 45% | 59% | 36% |
| Qtr-to-Qtr (%) | ||||||||||||||||
| Net revenue | 4% | 5% | 1% | 9% | 6% | 18% | 11% | 6% | 4% | 7% | 7% | 5% | ||||
| Gross profit | 11% | 5% | 3% | 12% | 8% | 21% | 17% | 8% | 10% | 11% | 8% | 5% | ||||
| Operating profit | 22% | 9% | 7% | 15% | 10% | 28% | 22% | 9% | 13% | 12% | 8% | 6% | ||||
| Pretax profit | 16% | -2% | 17% | 6% | 19% | 23% | 21% | 9% | 13% | 12% | 8% | 6% | ||||
| Net profit | 52% | -10% | 27% | 6% | 19% | 23% | 21% | 9% | 13% | 12% | 8% | 6% |
Source: Company data, Nomura estimates
44.0%
42.0%
Fig. 2: Yageo's GM vs. share price
Fig. 5: Yageo: P/E band
(TWD)
1,600
1,400
1,200
1,000
800
600
400
200
0
Dec-18
Fig. 5: Yageo: P/E band
Dec-19
40x
30x
Fig. 6: Yageo: P/B band
(TWD)
1,600
1,400
1,200
Source: TEJ, Company data, Nomura research
10x
Source: TEJ, Company data, Nomura research
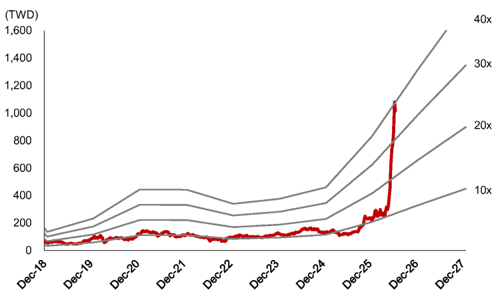
Source: TEJ, Company data, Nomura research
Rating and target price chart (three year history)
1000.00
900.00
800.00
700.00
600.00
500.00
300.00
200.00
100.00
0.00
YAGEO Corporation
Appendix A-1
Di
26
29
This report has been produced by Nomura International (Hong Kong) Ltd., Taipei Branch (NITB), Taiwan. See Disclaimers for Nomura Group entity details.