PDF 原檔:報告_元富_景碩3189_20260930_original.pdf
圖片清單(已驗證 2026-10-03)
ingest 時建立的「眼見為憑」圖片索引,是 lib/ 嵌圖的唯一真相來源;<40KB 未 Read 者免列(預設 logo/小表格截圖)。
| 檔名 | size | 分類 | 親眼所見內容 |
|---|---|---|---|
報告_元富_景碩3189_20260930_005.png |
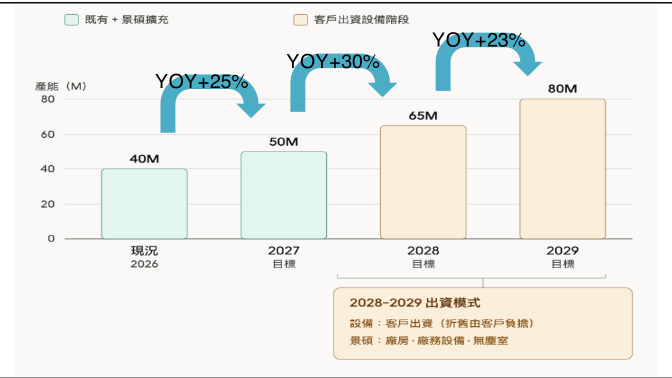
43KB | 真資料圖 | ABF 月產能長條圖:現況 2026 約 40M、2027 目標 50M(YOY+25%)、2028 目標 65M(YOY+30%)、2029 目標 80M(YOY+23%);圖例區分「既有+景碩擴充」與「客戶出資設備階段」;註記 2028-2029 出資模式:設備由客戶出資(折舊由客戶負擔)、景碩負責廠房·廠務設備·無塵室 |
報告_元富_景碩3189_20260930_006.png |
54KB | 真資料圖(財務類) | Sales YoY(藍線)與 PER(黃線)2012–2027 時序折線圖,Sources: Masterlink |
報告_元富_景碩3189_20260930_003.png |
55KB | 文字卡 | Exhibit 2 ESG 評分卡:TESG Rating B+、2024 永續報告書已揭露/已驗證、2026-Jun 全產業排名 396/2559、交易所產業 52/235 |
報告_元富_景碩3189_20260930_007.png |
165KB | 文字卡 | TESG 環境構面 SASB 主產業排名 227/907 雷達圖與環境構面分析文字 |
報告_元富_景碩3189_20260930_008.png |
161KB | 文字卡 | TESG 社會構面 SASB 主產業排名 345/907 雷達圖與分析文字 |
報告_元富_景碩3189_20260930_009.png |
50KB | 文字卡 | TESG 治理構面 SASB 主產業排名 42/907 雷達圖 |
報告_元富_景碩3189_20260930_010.png |
71KB | 文字卡 | 治理構面同產業排名趨勢折線與治理構面分析文字 |
報告_元富_景碩3189_20260930_001.png _002.png _004.png |
14KB/28KB/37KB | 未 Read(<40KB) | 預設小圖(首頁表格/圖表截圖),未驗證 |
原始內容
元富投顧
景碩(3189)
個股報告
BUY
台灣50 中型100 MSCI
元富投顧研究部
研究員 鄭羽涵 Michelle Cheng
yuhancheng@masterlink.com.tw
評等
日期:
目前收盤價 (NT$):
2026/9/30
955.0
目標價 (NT$):
1400
52週最高最低(NT$):
106-962
加權指數:
47631.96
公司基本資料
股本 (NT$/mn):
市值 (NT$/mn):
5,269
503,190
市值 (US$/mn):
16,773
20日平均成交量(仟股):
20,017
PER (2026):
66
PBR (2026):
11.32
外資持股比率:
22.34
TCRI
4
| 股價表現 | 1-m | 3-m | 6-m |
|---|---|---|---|
| 絕對報酬率(%) | 6.2 | 17.9 | 171.3 |
| 加權指數報酬率 | 2.8 | 5.9 | 43.9 |
| 2026 Key Changes | Current | Previous |
|---|---|---|
| 評等 | BUY | BUY |
| 目標價 (NT$) | 1400 | 1250 |
| 營業收入 (NT$/mn) | 54,382 | 56,051 |
| 毛利率 (%) | 30.2 | 27.5 |
| 營益率 (%) | 17.4 | 15.0 |
| EPS (NT$) | 14.47 | 12.30 |
| BVPS(NT$) | 86.13 | 83.96 |
積極擴產搶攻市佔
- 8月份自結大幅優於預期,上調獲利水準:8月份營收48.10億元, +6%MOM,+41%YOY,8 月份自結稅前淨利 11.10 億元,佔 3Q26 預估獲利 43%,優於預期,稅前淨利率 23.1%,歸屬母公司稅後淨 利 8.17 億元,佔 3Q26 預估獲利 41%,優於預期,淨利率 17.0%, 回推 8 月份毛利率應有 34%(毛利率原估 29.6%,以 8 月份數字推估 3Q26 ABF毛利率已達四成水準);8月單月自結EPS 1.59元,優於 預期,上調3Q26 EPS至4.72元。
- CPU載板景碩為成長亮點,積極展開擴產計畫:對景碩而言,CPU 成長最為顯著,Hybrid Type(T布混搭E布)材料導入後,預期將推動 景碩在Vera CPU市佔率提升。價格方面,預期2H26 ABF載板每 季漲價 15%,帶動獲利水準持續上揚。擴產方面,ABF 月產能預計 由目前 4000 萬顆提升至 2027 年的 5000 萬顆,後續 2028、2029 年更將分別擴充至6500萬顆及8000萬顆。
- 維持買進評等:看好AI帶動高層數ABF需求長期成長,景碩將受惠 CPU 市佔率提升,且 GPU 亦有佈局發,後續營收與毛利率可望逐季 向上,故維持買進,目標價1400元(38x2027EPS)。
Sources: Masterlink
Source: TEJ
本刊載之報告為元富投顧於特定日期之分析,已力求陳述內容之可靠性,純屬研究性質,僅作參考,使用者應明瞭內容之時效性,審慎考 量投資風險,並就投資結果自行負責。報告著作權屬元富投顧所有,禁止任何形式之抄襲、引用或轉載。
個股報告
元富投顧
景碩為華碩轉投資IC載板廠 景碩科技成立於2000年,資本額52億元,為華碩集團旗下轉投資IC載板廠商, 主要生產各種積體電路用球型柵狀陣列(BGA)基板,公司發展策略著重少量多樣 利基型 BGA 基板;總公司位於桃園新屋,主要生產基地位於台灣(桃園新屋、 新竹新豐、桃園楊梅)以及中國(江蘇蘇州)。
景碩2025年產品營收佔比:Substrate 82%(ABF 46%+BT36%)、隱形眼鏡(晶 碩)18%。元富預估2026年Substrate佔比提升至85%,+43%YOY,其中ABF 受惠 AI 晶片,+44%YOY,佔比提升至 48%,隱形眼鏡佔比 15%,+16%YOY; 預估 2027 年 Substrate 佔比提升至 89%,其中 ABF 佔比顯著提升至 57%, +83%YOY。
Exhibit 3: 景碩產品營收
| Sales(NT$mn) | 2025 | % | YoY | 2026(F) | % | YoY | 2027(F) | % | YoY |
|---|---|---|---|---|---|---|---|---|---|
| Substrate | 32,312 | 82% | 36%46,244 | 85% | 43%74,336 | 89% | 61% | ||
| ABF | 18,055 | 46% | 36%25,998 | 48% | 44%47,577 | 57% | 83% | ||
| BT | 14,356 | 36% | 40%20,244 | 37% | 41%26,759 | 32% | 32% | ||
| 隱形眼鏡 | 7,039 | 18% | 3% | 8,138 | 15% | 16% | 8,951 | 11% | 10% |
| 合計 | 39,351 | 100% | 29% | 54,382 | 100% | 38% | 83,287 | 100% | 53% |
Sources: Company、Masterlink
景碩 8 月份營收 48.10 億元,+6%MOM,+41%YOY,8 月份自結稅前淨利 11.10 億元,佔 3Q26 預估獲利 43%,優於預期,稅前淨利率 23.1%,歸屬母公司稅 後淨利 8.17 億元,佔 3Q26 預估獲利 41%,優於預期,淨利率 17.0%,回推 8 月份毛利率應有34%(毛利率原估29.6%,以8月份數字推估3Q26 ABF毛利率 已達四成水準);8月單月自結EPS 1.59元,優於預期,上調3Q26 EPS至4.72 元。
展望後市,樂觀看待 2026~2029 年載板需求,AI 仍是最大成長動能,對景碩而 言,CPU成長最為顯著,其次為GPU,Hybrid Type(T布混搭E布)材料導入後, 預期將推動景碩在Vera CPU市佔率提升,至於GPU,Rubin平台及AMD MI 系列景碩均已開始布局,未來具高度成長潛力。價格方面,ABF 載板上游原料 供給仍吃緊,1H26 載板廠漲價僅反映上游原料漲價,1H26 每季僅調漲個位數 水準,2H26 原材料成本持續墊高,又 AI 需求擴增之下,載板廠產能供不應求, 元富預期2H26 ABF載板每季漲價15%,帶動獲利水準持續上揚。
產能布局方面,公司持續聚焦高階 ABF 載板擴產,ABF 月產能預計由目前 4000 萬顆提升至 2027 年的 5000 萬顆,後續 2028、2029 年更將分別擴充至 6500 萬顆及 8000 萬顆,且景碩新增產能已獲 AI 客戶高度支持,設備投資由客戶出 資,顯示客戶積極渴求產能,需求能見度看至2029年。
綜上所述,元富調整景碩2026年EPS至14.47元、2027年EPS至36.64元。
8 月份自結大幅優於預期,上調獲 利水準
CPU 載板景碩為成長亮點,積極 展開擴產計畫
Exhibit 4: 景碩ABF價格QOQ與毛利率預估
Sources: Masterlink
Exhibit 5: 景碩擴產計畫
Sources: Masterlink
元富看好 AI 帶動高層數 ABF 需求長期成長,景碩將受惠 CPU 市佔率提升,且 GPU 亦有佈局發,後續營收與毛利率可望逐季向上,故維持買進,目標價 1400 元(38x2027EPS)。
Exhibit 6: Sales YOY & PER
元富投顧
維持買進評等
個股報告
元富投顧
TESG企業永續指標
治理 Governance
SASB主產業排名
資料來源:TEJ
本刊載之報告為元富投顧於特定日期之分析,已力求陳述內容之可靠性,純屬研究性質,僅作參考,使用者應明瞭內容之時效性,審慎考 量投資風險,並就投資結果自行負責。報告著作權屬元富投顧所有,禁止任何形式之抄襲、引用或轉載。
元富證券投資顧問股份有限公司 台北市敦化南路二段97號19樓 (02)2325-3299 (115)金管投顧新字第016號
個股報告
個股報告
| Comprehensive income statement - Year-end Dec. 31 | Comprehensive income statement - FY24 IFRS | Comprehensive income statement - FY25 IFRS | FY26 F IFRS | NT$m - FY27 F IFRS | Consolidated Balance Sheet - Year-end Dec. 31 | Consolidated Balance Sheet - FY24 IFRS | Consolidated Balance Sheet - FY25 IFRS | FY26 F IFRS | NT$m - FY27 F IFRS |
|---|---|---|---|---|---|---|---|---|---|
| Net sales | 30,535 | 39,351 | 54,382 | 83,287 | Cash | 14,400 | 12,281 | 23,302 | 44,145 |
| COGS | 21,867 | 31,037 | 37,970 | 49,908 | Marketable securities | 2,276 | 4,055 | 3,221 | 3,716 |
| Gross profit | 8,668 | 8,314 | 16,412 | 33,379 | A/R & N/R | 2,500 | 3,900 | 2,668 | 2,792 |
| Operating expense | 7,572 | 5,645 | 6,961 | 10,577 | Inventory | 2,981 | 4,828 | 3,476 | 3,474 |
| Operating profit | 1,095 | 2,670 | 9,450 | 22,801 | Others | 7,520 | 3,874 | 4,890 | 4,982 |
| Total non-operate. Inc. | 508 | 417 | 361 | 343 | Total current asset | 29,677 | 28,938 | 37,556 | 59,109 |
| Pre-tax profit | 1,603 | 3,087 | 9,812 | 23,145 | Long-term invest. | 100 | 138 | 290 | 255 |
| Total Net profit | 1,331 | 2,717 | 8,916 | 20,830 | Total fixed assets | 36,409 | 41,937 | 35,380 | 36,337 |
| Minority | 0 | 0 | 0 | 0 | Total other assets | 49,759 | 51,036 | 48,506 | 49,500 |
| Net Profit | 49 | 1,596 | 7,512 | 19,309 | Total assets | 79,435 | 79,973 | 86,062 | 108,608 |
| EPS (NT$) | 0.11 | 3.51 | 14.47 | 36.64 | |||||
| Y/Y % | FY24 | FY25 | FY26 F | FY27 F | Short-term Borrow | 2,452 | 3,053 | 2,305 | 2,603 |
| Sales | 13.8 | 28.9 | 38.2 | 53.2 | A/P &N/P | 2,500 | 3,900 | 2,668 | 2,792 |
| Gross profit | 1,148.5 | -4.1 | 97.4 | 103.4 | Other current liab. | 12,039 | 13,153 | 20,245 | 41,472 |
| Operating profit | 387.3 | 143.7 | 254.0 | 141.3 | Total current liab. | 16,990 | 20,106 | 25,217 | 46,867 |
| Pre-tax profit | 343.6 | 92.6 | 217.8 | 135.9 | L-T borrows | 13,779 | 11,197 | 12,757 | 13,253 |
| Net profit | 虧轉盈 | 3,164.4 | 370.7 | 157.0 | Other L-T liab. | 8,788 | 7,297 | 8,282 | 8,434 |
| EPS | -97.2 | 3,090.9 | 312.2 | 153.3 | Total liability. | 39,557 | 38,600 | 46,256 | 68,554 |
| Margins % | FY24 | FY25 | FY26 F | FY27 F | |||||
| Gross | 28.4 | 21.1 | 30.2 | 40.1 | Common stocks | 4,566 | 4,568 | 4,552 | 4,558 |
| Operating | 3.6 | 6.8 | 17.4 | 27.4 | Reserves | 7,358 | 7,375 | 7,187 | 7,268 |
| EBITDA | 23.6 | 25.9 | 0.0 | 0.0 | Retain earnings | 27,954 | 29,430 | 28,068 | 28,229 |
| Pre-tax | 5.3 | 7.8 | 18.0 | 27.8 | Total Equity | 39,878 | 41,373 | 39,807 | 40,054 |
| Net | 0.2 | 4.1 | 13.8 | 23.2 | Total Liab. & Equity | 79,435 | 79,973 | 86,062 | 108,608 |
| Comprehensive Quarterly Income Statement | Comprehensive Quarterly Income Statement - 1Q26 IFRS | Comprehensive Quarterly Income Statement - 2Q26F IFRS | Comprehensive Quarterly Income Statement - 3Q26F IFRS | NT$m - 4Q26F IFRS | Consolidated Statement of Cash flow - Year-end Dec. 31 | Consolidated Statement of Cash flow - FY24 IFRS | Consolidated Statement of Cash flow - FY25 IFRS | Consolidated Statement of Cash flow - FY26 F IFRS | NT$m - FY27 F IFRS |
|---|---|---|---|---|---|---|---|---|---|
| Net sales | 11,105 | 12,496 | 14,534 | 16,246 | Net income | 49 | 1,596 | 7,512 | 19,309 |
| Gross profit | 2,349 | 3,261 | 4,912 | 5,889 | Dep & Amort | 6,065 | 7,159 | 9,292 | 14,231 |
| Operating profit | 891 | 1,679 | 3,093 | 3,788 | Investment income | -5 | 1 | -11 | -1 |
| Total non-ope inc. | 74 | 106 | 55 | 126 | Changes in W/C | -907 | -1,986 | -390 | -446 |
| Pre-tax profit | 964 | 1,784 | 3,148 | 3,914 | Other adjustment | 2,503 | 1,323 | 1,888 | 1,336 |
| Net profit | 549 | 1,311 | 2,487 | 3,166 | Cash flow - ope. | 7,705 | 8,093 | 18,291 | 34,429 |
| EPS | 1.17 | 2.57 | 4.72 | 6.01 | Capex | -10,289 | -6,007 | -8,000 | -14,000 |
| Y/Y % | 1Q26 | 2Q26F | 3Q26F | 4Q26F | Change in L-T inv. | 0 | 0 | 0 | 0 |
| Net sales | 28.8 | 30.7 | 40.3 | 50.3 | Other adjustment | 1,182 | -1,862 | -745 | -947 |
| Gross profit | 21.0 | 61.8 | 150.1 | 146.1 | Cash flow -inve. | -9,107 | -7,869 | -8,745 | -14,947 |
| Operating profit | 77.7 | 170.7 | 392.6 | 311.4 | Free cash flow | -2,584 | 2,086 | 10,291 | 20,429 |
| Net profit | 98.9 | 287.5 | 632.8 | 392.9 | Inc. (Dec.) debt | 1,624 | -1,684 | 1,972 | 1,989 |
| Q/Q % | 1Q26 | 2Q26F | 3Q26F | 4Q26F | Cash dividend | 0 | 0 | -1,223 | -918 |
| Net sales | 2.7 | 12.5 | 16.3 | 11.8 | Other adjustment | 1,956 | -3,673 | -9,807 | -20,426 |
| Gross profit | -1.8 | 38.8 | 50.6 | 19.9 | Cash flow-Fin. | 996 | -3,270 | 1,233 | 1,073 |
| Operating profit | -3.3 | 88.5 | 84.3 | 22.4 | Exchange influence | 71 | -39 | 0 | -14 |
| Net profit | -14.5 | 138.6 | 89.8 | 27.3 | Change in Cash | -335 | -3,084 | 11,020 | 20,843 |
| Margins % | 1Q26 | 2Q26F | 3Q26F | 4Q26F | Ratio Analysis | ||||
| Gross | 21.2 | 26.1 | 33.8 | 36.3 | Year-end Dec. 31 | FY24 | FY25 | FY26 F | FY27 F |
| Operating | 8.0 | 13.4 | 21.3 | 23.3 | ROA | 0.1 | 2.0 | 9.0 | 19.8 |
| Net | 4.9 | 10.5 | 17.1 | 19.5 | ROE | 0.1 | 3.9 | 18.5 | 48.4 |
Option exp. in R.O.C. GAAP & IFRS
MasterLink Securities - Stock Rating System
STRONG BUY: Total return expected to appreciate 50% or more over a 3-month period.
BUY: Total return expected to appreciate 15% to 50% over a 3-month period.
HOLD: Total return expected to be between 15% to -15% over a 3-month period.
SELL: Total return expected to depreciate 15% or more over a 3-month period.
Additional Information Available on Request
©2026 MasterLink Securities. All rights reserved.
This information has been compiled from sources we believe to be reliable, but we do not hold ourselves responsible for its completeness or accuracy. It is not an offer to sell or solicitation of an offer to buy any securities. MasterLink and its affiliates and their officers and employees may or may not have a position in or with respect to the securities mentioned herein. This firm (or one of its affiliates) may from time to time perform investment banking or other services or solicit investment banking or other business from, any company mentioned in this report. All opinions and estimates included in this report constitute our judgment as of this date and are subject to change without notice. MasterLink has produced this report for private circulation to professional and institutional clients only. All information and advice is given in good faith but without any warranty.