PDF 原檔:報告_麥格理_矽力-KY_20260514_original.pdf
原始內容
rec history
— 6415 [LHS]
800.00
-
Rel TAlEX [RHS) • Price Target
-
120.00
•
Outperform
200.00
Technology
Dec-23
40.00
20.00
Jul-24 Mar-25 Oct-25 |
May-26
Source: FactSet. Macauarie Research. Mav 2026 (all fiaures in
Silergy
2026: Back to high sales growth
Key Points
- We continue to believe in Silergy's long-term growth story and forecast 20%+ annual revenue growth over 2026-28.
- Key catalysts include ASP upside in 2026 from product mix and price hikes; transition to Gen 4 product should help lower the cost basis.
- Kkey risks include the strength of the upcycle, sustained new design wins, and competition from foreign and local peers
- Continue to expect market-share gains . Silergy is the largest power management IC (PMIC) supplier in China by sales and product breadth. We believe the company should continue to benefit from localisation trends (local suppliers in China in aggregate have less than 20% market share). The company has been aggressively designing (and designing in) new and higher-end products, with a key focus on auto and data centres.
- 4Q25 earnings conference - Key message: The company forecasts sales growth returning to 20%+ in 2026, with upside risk to ASPs (especially in the wake of trailing-edge foundry price hikes). Management believes auto-related sales could reach near 20% of total sales in 2026, while Gen 4 products could exceed 20% by year-end.
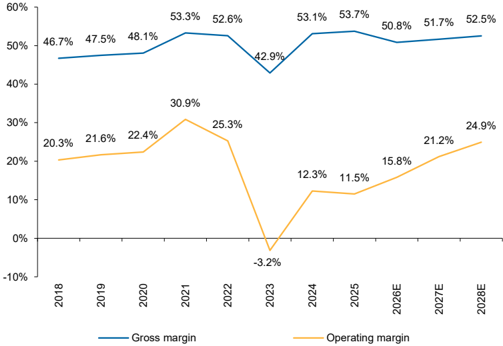
- 1Q26 EPS beat despite margin miss : Silergy released 1Q26 earnings after market on 14 May and will hold a call on 15 May. GPM missed expectations, but EPS was a beat (higher non-op, lower taxes). Despite the margin miss, we expect long-term GPM upside on product mix improvement and a lower cost basis (transition to Gen 4 products on 300mm). We also believe the company will be able to pass through foundry price hikes to customers in 2026.
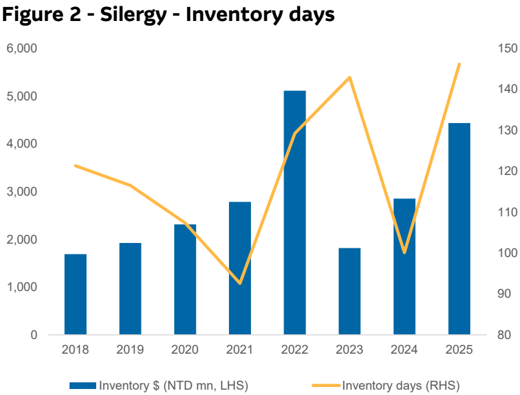
- Key reasons for weaker-than-expected 2025 : 1) Slow non-AI-related demand, 2) customer inventory digestion, 3) some customer push-out of new product launches, 4) lower-than-expected yields in early stages of Gen 4 product ramp, and 5) exit from some lower-margin products.
Earnings Changes : None.
Valuation : We raise our target price 39%, to NT$702 from NT$504, based on a 30x 2028E P/E (2027E previously).
Catalysts: Accelerated YoY sales growth from 1Q26; sustainable GPM upside trend on improving product mix (with potential price hikes).
Investment Thesis and Recommendation
We continue to like Silergy's China semiconductor localisation story, improving product mix, technology innovation capabilities, and long-term growth outlook.
Semicons & Semicon Equip
Taiwan
Jeffrey Ohlweiler
Leo Tsai
| 6415 TT | Outperform |
|---|---|
| Price (at 14 May 2026) | TWD503.00 |
| 12-month target | TWD702.00 |
| 12-month TSR (%) | 40.5 |
| Volatility Index | High |
| Market Cap (Local) (m) | 195,641 |
| Market Cap (USD) (m) | 6,204 |
| Free Float (%) | 89 |
| 30-day avg turnover (USD) (m) | 95.5 |
Investment Fundamentals
| Year end 31 Dec Revenue (m) | 2025A 18,812 | 2026E 23,540 | 2027E 29,306 | 2028E 36,430 |
|---|---|---|---|---|
| Revenue growth (%) | 1.9 | 25.1 | 24.5 | 24.3 |
| EBIT (m) | 2,161 | 3,725 | 6,207 | 9,078 |
| EBIT growth (%) | (4.7) | 72.4 | 66.6 | 46.3 |
| Reported profit (m) | 2,478 | 4,376 | 6,513 | 9,095 |
| Adjusted profit (m) | 2,478 | 4,376 | 6,513 | 9,085 |
| EPS rep [TWD] | 6.4 | 11.3 | 16.8 | 23.4 |
| EPS rep growth (%) | 7.6 | 76.1 | 48.8 | 39.6 |
| Net debt/equity (%) | (36.3) | (33.2) | (32.2) | (32.9) |
| ROA (%) | 5.1 | 8.1 | 12.3 | 16.2 |
| ROE (%) | 6.8 | 11.2 | 15.1 | 18.7 |
| PER rep (x) | 78.5 | 44.6 | 30.0 | 21.5 |
| EV/EBITDA (x) | 58.0 | 37.0 | 23.9 | 17.0 |
| P/BV (x) | 5.2 | 4.8 | 4.3 | 3.8 |
| Total div yield (%) | 0.5 | 0.9 | 1.2 | 1.6 |
Quant (rank vs. global sector)
584 / 654
6415 TT rel TAIEX performance, & rec history
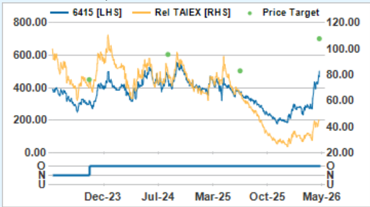
Source: FactSet, Macquarie Research, May 2026 (all figures in TWD unless noted, TP in TWD)
Key Risks to Investment Thesis
- 1) A significant deceleration in the semi/PMIC upcycle from 2026 could weaken growth over 2026-28.
- 2) A Slower-than-expected ramp-up of new products (eg, server/auto) could slow GPM expansion.
- 3) US-China trade tensions (foreign companies using fewer Chinese semiconductors) and heightened competition (locally and foreign) could negatively affect demand.
Figure 1 - Silergy - Annual revenue breakdown
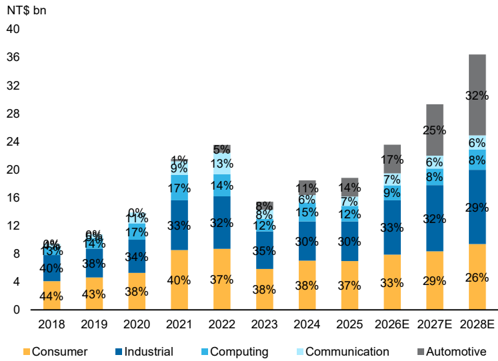
Source: Company data, Macquarie Research, May 2026
Silergy (6415 TT) TWD/(m) unless otherwise noted
| Income Statement Dec FY | 2025A | 2026E | 2027E | 2028E | Q1/26A | Q2/26E | Balance Sheet | 2025A | 2026E | 2027E | 2028E |
|---|---|---|---|---|---|---|---|---|---|---|---|
| Revenue | 18,812 | 23,540 | 29,306 | 36,430 | 4,860 | 5,674 | Cash | 17,055 | 17,017 | 18,132 | 20,602 |
| Cost of Goods Sold | 9,102 | 11,765 | 14,168 | 17,300 | 2,517 | 2,823 | Receivables | 2,354 | 2,897 | 3,592 | 4,448 |
| Gross Profit | 9,710 | 11,775 | 15,137 | 19,130 | 2,343 | 2,852 | Inventories | 4,434 | 5,513 | 6,687 | 8,114 |
| Depreciation | 579.6 | 589.8 | 589.8 | 589.8 | 147.5 | 147.5 | Investments | 9,325 | 9,325 | 9,325 | 9,325 |
| Amortisation | 211.7 | 222.2 | 222.2 | 222.2 | 55.6 | 55.6 | Fixed Assets | 5,261 | 7,513 | 9,765 | 12,017 |
| EBIT | 2,161 | 3,725 | 6,207 | 9,078 | 390.0 | 859.7 | Other Assets | 5,743 | 5,521 | 5,299 | 5,076 |
| Net Interest Income | 356.4 | 570.5 | 670.5 | 610.5 | 143.8 | 143.4 | Total Assets | 44,171 | 47,786 | 52,799 | 59,582 |
| Associates | (61.5) | 0.0 | 0.0 | 0.0 | 0.0 | 0.0 | Payables | 945.0 | 1,175 | 1,425 | 1,729 |
| Forex Gains / Losses | 17.3 | 0.0 | 0.0 | 0.0 | 0.0 | 0.0 | Short Term Debt | 662.4 | 662.4 | 662.4 | 662.4 |
| Other Pre-Tax Income | 204.3 | 412.0 | 202.4 | 186.0 | 253.0 | 53.0 | Long Term Debt | 2,695 | 2,695 | 2,695 | 2,695 |
| Pre-Tax Profit | 2,677 | 4,708 | 7,079 | 9,885 | 786.8 | 1,056 | Other Liabilities | 2,116 | 2,116 | 2,116 | 2,116 |
| Tax Expense | (144.1) | (331.7) | (566.4) | (790.0) | (18.0) | (84.5) | Total Liabilities | 6,418 | 6,648 | 6,898 | 7,202 |
| Net Profit | 2,533 | 4,376 | 6,513 | 9,095 | 768.8 | 971.6 | Shareholders' Funds | 36,755 | 40,140 | 44,903 | 51,382 |
| Minority Interests | (55.0) | 0.0 | 0.0 | 0.0 | 0.0 | 0.0 | Minority Interests | 436.7 | 436.7 | 436.7 | 436.7 |
| Reported Earnings | 2,478 | 4,376 | 6,513 | 9,095 | 768.8 | 971.6 | Other | 561.1 | 561.1 | 561.1 | 561.1 |
| Adjusted Earnings | 2,478 | 4,376 | 6,513 | 9,085 | 768.8 | 971.6 | Total S/H Equity | 37,753 | 41,138 | 45,901 | 52,380 |
| Basic Shares Outstanding | 387.0 | 388.0 | 388.0 | 388.0 | 388.0 | 388.0 | Total Liab & S/H Funds | 44,171 | 47,786 | 52,799 | 59,582 |
| Diluted Shares Outstanding | 386.8 | 388.0 | 388.0 | 388.0 | 388.0 | 388.0 | Net Debt / Equity (%) | (36.3) | (33.2) | (32.2) | (32.9) |
| EPS (rep) [TWD] | 6.4 | 11.3 | 16.8 | 23.4 | 2.0 | 2.5 | ROE (%) | 6.8 | 11.2 | 15.1 | 18.7 |
| Total DPS [TWD] | 2.6 | 4.5 | 5.9 | 8.2 | 0.0 | 0.0 | ROA (%) | 5.1 | 8.1 | 12.3 | 16.2 |
| ROIC (%) | 12.0 | 14.4 | 20.8 | 26.8 | |||||||
| Ratio | 2025A | 2026E | 2027E | 2028E | Cash Flow Analysis | 2025A | 2026E | 2027E | 2028E | ||
| Revenue Growth (%) | 1.9 | 25.1 | 24.5 | 24.3 | - | - | EBITDA | 2,952 | 4,537 | 7,019 | 9,890 |
| EBITDA Growth (%) | (1.0) | 53.7 | 54.7 | 40.9 | - | - | Tax Paid | (144.1) | (331.7) | (566.4) | (790.0) |
| EBIT Growth (%) | (4.7) | 72.4 | 66.6 | 46.3 | - | - | Chgs in Working Cap | 1,073 | 1,392 | 1,618 | 1,979 |
| EPS Growth (adj) (%) | 7.6 | 76.1 | 48.8 | 39.5 | - | - | Net Interest Paid | 356.4 | 570.5 | 670.5 | 610.5 |
| Gross Profit Margin (%) | 51.6 | 50.0 | 51.7 | 52.5 | - | - | Other | (1,933) | (2,373) | (3,034) | (3,772) |
| EBITDA Margin (%) | 15.7 | 19.3 | 23.9 | 27.1 | - | - | Operating Cashflow | 2,304 | 3,796 | 5,707 | 7,918 |
| EBIT Margin (%) | 11.5 | 15.8 | 21.2 | 24.9 | - | - | Acquisitions | (6,349) | 0.0 | 0.0 | 0.0 |
| Net Profit Margin (%) | 13.2 | 18.6 | 22.2 | 24.9 | - | - | Capex | (2,060) | (2,842) | (2,842) | (2,842) |
| Payout Ratio (%) | 39.9 | 40.0 | 35.0 | 35.0 | - | - | Other | (124.4) | 0.0 | 0.0 | 0.0 |
| PE (rep) (x) | 78.5 | 44.6 | 30.0 | 21.5 | - | - | Investing Cashflow | (8,534) | (2,842) | (2,842) | (2,842) |
| EV/EBITDA (x) | 58.0 | 37.0 | 23.9 | 17.0 | - | - | Dividend (Ordinary) | (927.4) | (991.2) | (1,750) | (2,605) |
| EV/EBIT (x) | 79.8 | 45.1 | 27.1 | 18.5 | - | - | Debt Movements | 1,590 | 0.0 | 0.0 | 0.0 |
| Price/Book (x) | 5.2 | 4.8 | 4.3 | 3.8 | - | - | Other | 103.1 | 0.0 | 0.0 | 0.0 |
| Total Div Yield (%) | 0.5 | 0.9 | 1.2 | 1.6 | - | - | Financing Cashflow | 765.5 | (991.2) | (1,750) | (2,605) |
| Net Chg in Cash/Debt | (5,464) | (37.7) | 1,114 | 2,470 | |||||||
| Free Cashflow | 243.9 | 953.5 | 2,865 | 5,076 |
Source: Company data, Macquarie Research May 2026
Company Description
Silergy is a leading IC design house specialising in power management IC (PMIC). It is the largest PMIC design house in China. Its products are widely used in consumer, communication, computing (including server and SSDs), industrial, and automobile applications. Although Silergy is a fabless IC design company, it has its own process technology and outsources production to a diverse base of foundries.
Source: Company data, Macquarie Research, May 2026
NT$m
GM %
Operating profit
OPM %
1Q26
48.2%
390
8.0%
Figure 3 - Silergy - 1Q26 results review
Net income
Net margin
EPS (NT$)
1Q25
4,094
2,206
53.9%
244
6.0%
380
000 %
-9.9%
-15.1%
-48.9%
-9.1%
MACQ
4,885
2,545
52.1%
509
10.4%
653
Diff %
-0.5%
-7.9%
-23.3%
20.6%
BBG
4,823
2,484
51.5%
545
11.3%
668
Diff %
-28.4%
17.7%
| 769 | 809 | 359 | -5.0% 114.4% | 589 | 30.4% | 594 | 29.3% |
|---|---|---|---|---|---|---|---|
| 15.8% | 15.0% | 8.8% | 12.1% | 12.3% | |||
| 1.98 | 2.09 | 0.93 | -5.3% 112.9% | 1.52 | 30.0% | 1.51 | 30.8% |
Source: Company data, Bloomberg, Macquarie Research, May 2026
Figure 4 - Silergy - Monthly sales trends
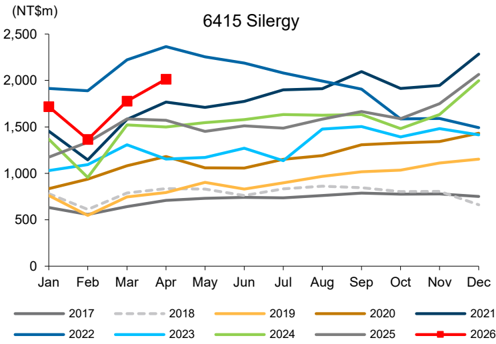
Source: Company data, Macquarie Research, May 2026
Figure 6 - Silergy - P&L
| (NT$m) | 1Q25 | 2Q25 | 3Q25 | 4Q25 | 1Q26 | 2Q26E | 3Q26E | 4Q26E | 2024 | 2025 | 2026E | 2027E | 2028E |
|---|---|---|---|---|---|---|---|---|---|---|---|---|---|
| Net Sales | 4,094 | 4,564 | 4,763 | 5,392 | 4,860 | 5,674 | 6,369 | 6,637 | 18,455 | 18,812 | 23,540 | 29,306 | 36,430 |
| Gross profit | 2,206 | 2,349 | 2,395 | 2,760 | 2,343 | 2,852 | 3,215 | 3,365 | 9,936 | 9,710 | 11,775 | 15,137 | 19,130 |
| Op income | 244 | 545 | 608 | 764 | 390 | 860 | 1,183 | 1,292 | 2,267 | 2,161 | 3,725 | 6,207 | 9,078 |
| Pretax income | 380 | 627 | 804 | 866 | 787 | 1,056 | 1,378 | 1,487 | 2,583 | 2,677 | 4,708 | 7,079 | 9,875 |
| Net income | 359 | 630 | 680 | 809 | 769 | 972 | 1,268 | 1,368 | 2,286 | 2,478 | 4,376 | 6,513 | 9,085 |
| Adjusted EPS (NT$) | 0.93 | 1.63 | 1.76 | 2.09 | 1.98 | 2.50 | 3.27 | 3.52 | 5.95 | 6.40 | 11.28 | 16.79 | 23.41 |
| Profitability | |||||||||||||
| Gross Margin | 53.9% | 51.5% | 50.3% | 51.2% | 48.2% | 50.3% | 50.5% | 50.7% | 53.8% | 51.6% | 50.0% | 51.7% | 52.5% |
| Operating Margin | 6.0% | 11.9% | 12.8% | 14.2% | 8.0% | 15.2% | 18.6% | 19.5% | 12.3% | 11.5% | 15.8% | 21.2% | 24.9% |
| Pretax Margin | 9.3% | 13.7% | 16.9% | 16.1% | 16.2% | 18.6% | 21.6% | 22.4% | 14.0% | 14.2% | 20.0% | 24.2% | 27.1% |
| Net Margin | 8.8% | 13.8% | 14.3% | 15.0% | 15.8% | 17.1% | 19.9% | 20.6% | 12.4% | 13.2% | 18.6% | 22.2% | 24.9% |
| Sequential growth | |||||||||||||
| Net Sales | -19.9% | 11.5% | 4.4% | 13.2% | -9.9% | 16.8% | 12.2% | 4.2% | |||||
| Gross profit | -22.0% | 6.5% | 1.9% | 15.2% | -15.1% | 21.7% | 12.7% | 4.7% | |||||
| Op income | -73.6% | 123.2% | 11.7% | 25.5% | -48.9% | 120.4% | 37.6% | 9.3% | |||||
| Pretax income | -59.4% | 65.2% | 28.3% | 7.6% | -9.1% | 34.2% | 30.5% | 7.9% | |||||
| Net income | -59.9% | 75.7% | 8.0% | 18.9% | -5.0% | 26.4% | 30.5% | 7.9% | |||||
| EPS | -60.2% | 75.5% | 7.8% | 19.0% | -5.2% | 26.4% | 30.5% | 7.9% | |||||
| YoY Growth | |||||||||||||
| Net Sales | 6.6% | -1.1% | -2.6% | 5.5% | 18.7% | 24.3% | 33.7% | 23.1% | 19.6% | 1.9% | 25.1% | 24.5% | 24.3% |
| Gross profit | 10.8% | -5.3% | -9.1% | -2.4% | 6.2% | 21.4% | 34.2% | 21.9% | 51.0% | -2.3% | 21.3% | 28.6% | 26.4% |
| Op income | 215.4% | -0.6% | -15.4% | -17.3% | 59.8% | 57.9% | 94.4% | 69.3% | -566.0% | -4.7% | 72.4% | 66.6% | 46.3% |
| Pretax income | 63.0% | -0.1% | 2.3% | -7.5% | 107.3% | 68.4% | 71.3% | 71.7% | 315.1% | 3.6% | 75.9% | 50.4% | 39.5% |
| Net income | 359.6% | 12.4% | -9.6% | -9.6% | 114.4% | 54.2% | 86.4% | 69.1% | 206.5% | 8.4% | 76.6% | 48.8% | 39.5% |
| EPS | 356.3% | 11.6% | -10.2% | -10.3% | 113.5% | 53.7% | 86.1% | 68.6% | 204.3% | 7.6% | 76.1% | 48.8% | 39.5% |
Source: Company data, Macquarie Research, May 2026
4025
5,392
2,760
51.2%
764
YoY %
18.7%
6.2%
59.9%
107.3%
Figure 5 - Silergy - Annual GPM and OPM trends
Source: Company data, Macquarie Research, May 2026
Source: TEJ, Macquarie Research, May 2026
Figure 9 - Silergy - 1yr forward PE
Source: TEJ, Macquarie Research, May 2026
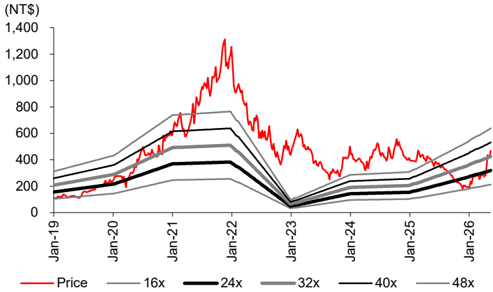
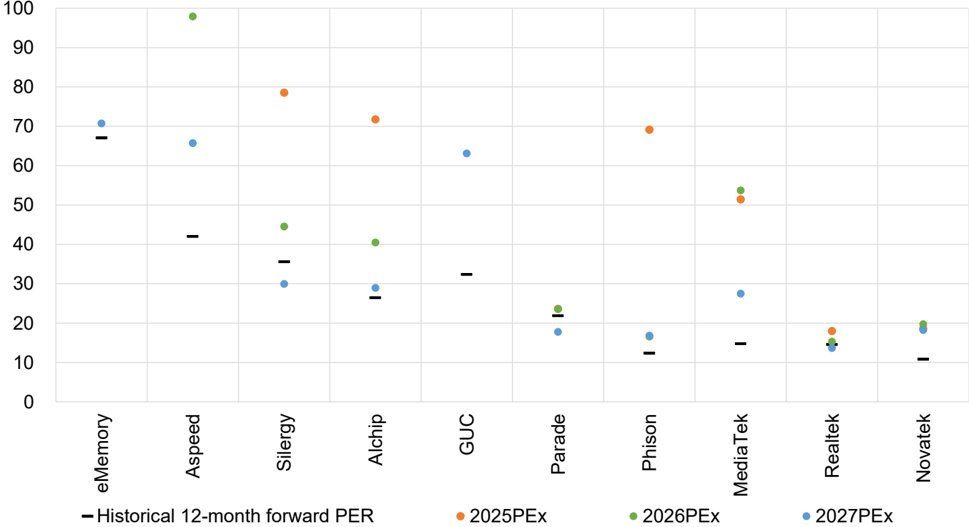
Figure 11 - IC design - P/E valuation
Source: Bloomberg, Macquarie Research, May 2026
Note: Priced as of market close of 14 May 2026 (Bloomberg). All other data is Macquarie.
Figure 8 - Silergy - Dividend and payout ratio
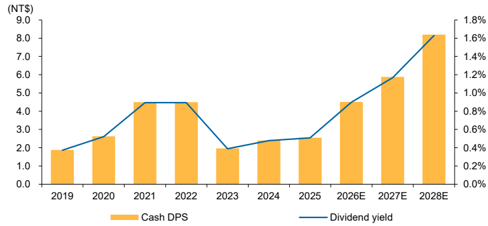
Source: Company data, Macquarie Research, May 2026
Source: TEJ, Macquarie Research, May 2026
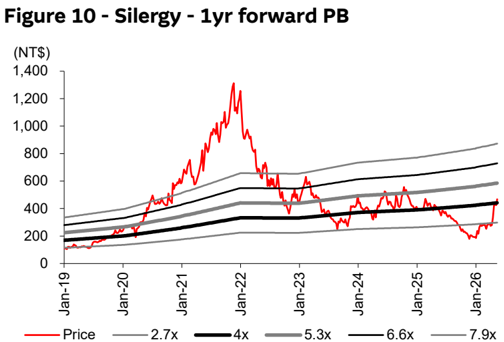
Key Quant Findings
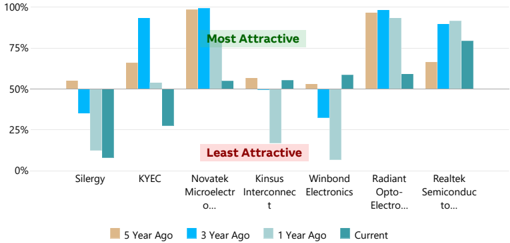
The quant model currently holds a strong negative view on Silergy. The strongest style exposure is Growth, indicating this stock has good historic and/or forecast growth. Growth metrics focus on both top and bottom line items. The weakest style exposure is Profitability, indicating this stock is not efficiently converting investments to earnings; proxied by ratios like ROE or ROA.
Macquarie Alpha Model: Key rankings
The Macquarie Quant's flagship Alpha model is a dynamic multi-factor model based on a staple of quant factors such as value, momentum, revisions, quality, and risk.
| Global | Market (Country) | Sector | |
|---|---|---|---|
| Whole Universe | Taiwan | Semiconductors & Semiconductor Equip. | |
| Macquarie Alpha Model | 16257/17956 | 900/977 | 584/654 |
| Fundamental (Consensus) * | 5835/17956 | 174/977 | 228/654 |
Current and Historical Alpha Model Rank
The chart shows the Macquarie Alpha model market ranking against the company's peers and over recent history.
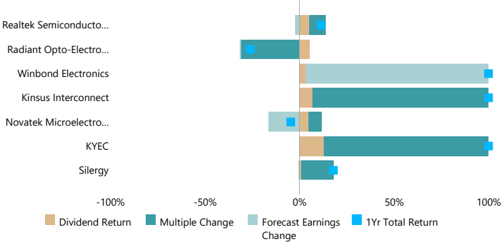
Drivers of Stock Return
Breakdown of 1-year total return (local currency) into returns from dividends, changes in forward earnings estimates and the resulting change in earnings multiple.
Alpha Model Decomposition
The Macquarie Alpha is decomposed into its sector and market relative factor & styles exposures (a higher/better percentile is coded in green, whilst lower in red).
| Percentile relative to | Percentile relative to | ||
|---|---|---|---|
| Factors / Styles | sectors (/654) | market (/977) | Core factors in definition |
| ALPHA | 11% | 8% | Built from the styles below |
| VALUE | 59% | 12% | Book, CF, Yield, Earnings Multiples |
| ANALYST | 39% | 67% | Revisions (Earnings, Recommendations) |
| MOMENTUM | 17% | 66% | Price Momentum |
| GROWTH | 80% | 91% | EPS, Sales (Forecast, Historic) |
| PROFITABILITY | 24% | 49% | ROE, Margin, Asset Turnover |
| QUALITY | 32% | 49% | Accruals, Earn Stability, Cash Conversion |
| CAPITAL | 40% | 16% | Investment/Capex, Net share issuance |
| LIQUIDITY | 20% | 36% | Size, Turnover, Analyst Coverage |
| LOW RISK | 19% | 11% | Beta, Volatility, Earn.Cert, Leverage |
| TECHNICAL | 73% | 52% | MACD, RSI, Bollinger, Williams R, etc |
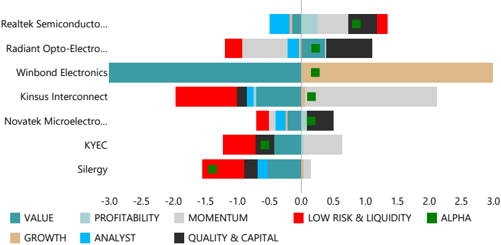
Factors driving the Alpha Model vs peers
For the comparable firms this chart shows the key underlying styles and their contribution to the current overall raw Alpha score.
Macquarie Style Returns over last year
Recent performance to Macquarie style factors
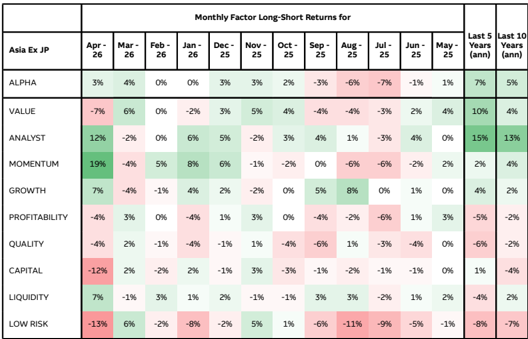
| Monthly Factor Long-Short Returns for | Monthly Factor Long-Short Returns for | Monthly Factor Long-Short Returns for | Monthly Factor Long-Short Returns for | Monthly Factor Long-Short Returns for | Monthly Factor Long-Short Returns for | Monthly Factor Long-Short Returns for | Monthly Factor Long-Short Returns for | Monthly Factor Long-Short Returns for | Monthly Factor Long-Short Returns for | Monthly Factor Long-Short Returns for | Monthly Factor Long-Short Returns for | |||
|---|---|---|---|---|---|---|---|---|---|---|---|---|---|---|
| Asia Ex JP | Apr - 26 | Mar - 26 | Feb - 26 | Jan - 26 | Dec - 25 | Nov - 25 | Oct - 25 | Sep - 25 | Aug - 25 | Jul - 25 | Jun - 25 | May - 25 | Last 5 Years (ann) | Last 10 Years (ann) |
| ALPHA | 3% | 4% | 0% | 0% | 3% | 3% | 2% | -3% | -6% | -7% | -1% | 1% | 7% | 5% |
| VALUE | -7% | 6% | 0% | -2% | 3% | 5% | 4% | -4% | -4% | -3% | 2% | 4% | 10% | 4% |
| ANALYST | 12% | -2% | 0% | 6% | 5% | -2% | 3% | 4% | 1% | -3% | 4% | 0% | 15% | 13% |
| MOMENTUM | 19% | -4% | 5% | 8% | 6% | -1% | -2% | 0% | -6% | -6% | -2% | 2% | 2% | 4% |
| GROWTH | 7% | -4% | -1% | 4% | 2% | -2% | 0% | 5% | 8% | 0% | 1% | 0% | 4% | 2% |
| PROFITABILITY | -4% | 3% | 0% | -4% | 1% | 3% | 0% | -4% | -2% | -6% | 1% | 3% | -5% | -2% |
| QUALITY | -4% | 2% | -1% | -4% | -1% | 1% | -4% | -6% | 1% | -3% | -4% | 0% | -6% | -2% |
| CAPITAL | -12% | 2% | -2% | 2% | -1% | 3% | -3% | -1% | -2% | -1% | -1% | 0% | 1% | -4% |
| LIQUIDITY | 7% | -1% | 3% | 1% | 2% | -1% | -1% | 3% | 3% | -2% | 1% | 2% | -4% | 2% |
| LOW RISK | -13% | 6% | -2% | -8% | -2% | 5% | 1% | -6% | -11% | -9% | -5% | -1% | -8% | -7% |
Source (all charts): FactSet, Refinitiv, and Macquarie Quant. For more details on the Macquarie Alpha model or for more customised analysis and screens, please contact the Macquarie Global Quantitative Team: maccapequitiesresearchquantglobal@macquarie.com. Explanation for items on this page can be found at https://www.macquarieinsights.com/rp/d/r/p/OTUyMzg1
Analysts
Jeffrey Ohlweiler
- +8862 2734 7512
jeffrey.ohlweiler@macquarie.com
Macquarie Capital Limited, Taiwan Securities Branch