PDF 原檔:報告_UBS_萬潤6187_20260727_original.pdf
圖片清單(已驗證 2026-07-27)
範圍性驗證:逐張 Read 內容價值最高的 4 張(002 / 007 / 008 / 012)。其餘 17 張未逐張 Read(依報告 Figure 標題多為 PE band、上下檔情境、營收組合圓餅與產品照),未嵌入。
| 檔名 | size | 分類 | 親眼所見內容 |
|---|---|---|---|
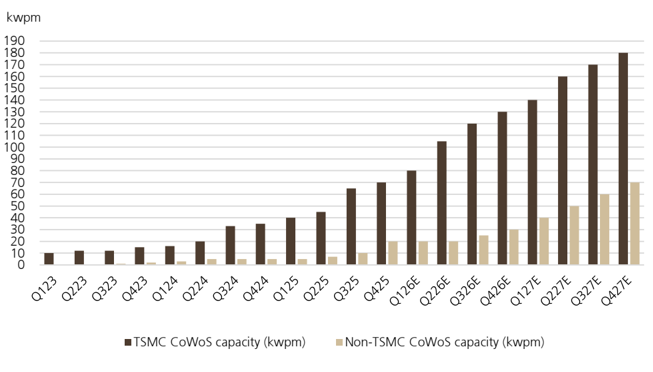
| 報告_UBS_萬潤6187_20260727_002.png | 44KB | 真資料圖 | 柱狀圖,橫軸 Q123→Q427E,縱軸 kwpm 0-190。深棕柱為 TSMC CoWoS capacity,自 Q123 約 10kwpm 升至 Q426E 約 135、Q427E 約 180;淺色柱為 Non-TSMC CoWoS capacity,Q325 起明顯放大,Q427E 約 70 |
| 報告_UBS_萬潤6187_20260727_007.png | 32KB | 真資料圖 | 堆疊柱狀圖,橫軸 2024→2028E,縱軸 NT$m 0-25,000。分色為 CoWoS / CoPoS / CPO / SoIC / Flip chip & others。2026E 總額約 9,000 幾乎全為 CoWoS;2027E 約 14,000(CoWoS 約 10,500+CPO 約 2,000+CoPoS 少量);2028E 約 23,500,其中 CoPoS(淺棕)躍居最大約 10,000、CoWoS 降至約 7,000、CPO 約 5,500 |
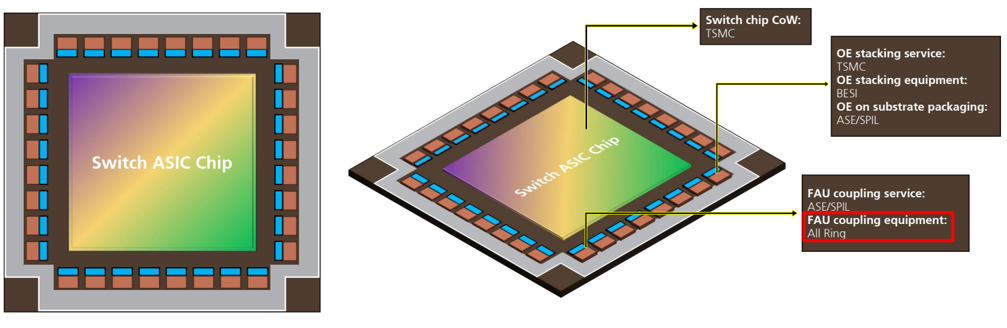
| 報告_UBS_萬潤6187_20260727_008.png | 163KB | 真資料圖 | NVIDIA CPO 封裝配置示意圖:中央 Switch ASIC Chip,四周排列 OE 模組。右側四個標註框指出各環節供應商——Switch chip CoW:TSMC;OE stacking service:TSMC、OE stacking equipment:BESI、OE on substrate packaging:ASE/SPIL;FAU coupling service:ASE/SPIL、FAU coupling equipment:All Ring(紅框標示) |
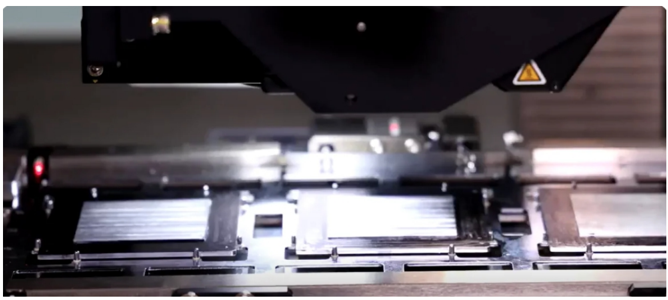
| 報告_UBS_萬潤6187_20260727_012.png | 175KB | 真資料圖 | 設備實照:機台取放頭(雙夾爪與噴嘴)位於輸送軌道上方,軌道上排列多個金屬散熱片/載具工件——對應報告 Figure 12「Heatsink placement tool」 |
原始內容
Initiation of Coverage
All Ring Tech
Share gainer in expanding advanced packaging TAM
Major beneficiary of rising advanced packaging investment
We initiate coverage of All Ring with a Buy rating and a price target of NT$1,550, implying 65% upside. All Ring is a well established automation and equipment supplier for the semiconductor back end, providing underfill, heatsink attach and automated optical inspection (AOI) tools for TSMC and ASE's CoWoS packaging. We are optimistic about the sustained capex cycle of advanced packaging in the next two to three years, backed by strong cloud AI demand and the emerging co-packaged optics (CPO) opportunity. The stock has pulled back 32% from its previous peak in April 2026 due to broader market deleveraging, concerns about hyperscaler capex and an expectation reset for the CPO ramp. At 15x 2027-28E PE, the stock presents attractive risk-reward, considering a 35% earnings CAGR in 2027-30E.
Accelerated industry expansion of advanced packaging and tech upgrade
Advanced packaging plays a critical role in supporting cloud AI chips for greater compute performance and high-speed interconnect between compute and memory at lower power. We believe TSMC and ASE will accelerate CoWoS expansion in 2027E. Industry capex could trend up further in 2028-29E, driven by CoPoS, SoIC, and other technologies in Taiwan, the US, and Southeast Asia. New technologies such as CoPoS could lift All Ring's tool ASP by 15% or more, given upgraded capability and throughput. All Ring may also expand its share in CoPoS through improved execution and TSMC's localization. We forecast All Ring's SEMI sales to grow 78%/53%/70% in 2026/2027/2028.
CPO to be a new driver in 2027E and beyond
All Ring is also well positioned in CPO, a new optical interconnect solution with high bandwidth and reasonable power consumption for next-generation AI servers (see our CPO deep dive). All Ring's major opportunity in 2027-28E could be in fiber array unit (FAU) coupling with optical engine (OE). We believe All Ring may be leading its major competitor in terms of tool throughput and performance. We forecast CPO to contribute 13%/23% of sales in 2027/2028.
Valuation: Initiate with a Buy rating and a price target of NT$1,550
We forecast 2026/2027/2028 EPS of NT$28.03/NT$45.06/NT$78.81, with our 2028E EPS 18% ahead of consensus. Our price target of NT$1,550 is based on 25x average 2027-28E PE. We believe PE close to the high end of its historical range is justified, considering: 1) a 35% long-term earnings CAGR; 2) the cloud AI mega-trend driving structural advanced packaging investment; and 3) All Ring's strengthening industry position and share expansion. We initiate with a Buy rating.
| Highlights (NT$m) | 12/23 | 12/24 | 12/25 | 12/26E | 12/27E | 12/28E | 12/29E | 12/30E |
|---|---|---|---|---|---|---|---|---|
| Revenues | 1,205 | 5,535 | 5,366 | 9,351 | 14,194 | 23,937 | 28,031 | 31,166 |
| EBIT (UBS) | 85 | 1,427 | 1,611 | 3,277 | 5,394 | 9,455 | 11,493 | 13,402 |
| Net earnings (UBS) | 138 | 1,311 | 1,485 | 2,699 | 4,339 | 7,589 | 9,219 | 10,790 |
| EPS (UBS, diluted) (NT$) | 1.59 | 14.57 | 15.26 | 27.71 | 44.54 | 77.90 | 94.63 | 110.77 |
| DPS (net) (NT$) | 1.61 | 10.90 | 10.80 | 19.62 | 31.54 | 55.16 | 67.01 | 78.43 |
| Net (debt) / cash | 287 | 3,309 | 3,947 | 4,198 | 3,959 | 1,919 | 13,997 | (14,637) |
| Profitability/valuation | 12/23 | 12/24 | 12/25 | 12/26E | 12/27E | 12/28E | 12/29E | 12/30E |
| EBIT (UBS) margin% | 7.1 | 25.8 | 30.0 | 35.0 | 38.0 | 39.5 | 41.0 | 43.0 |
| ROIC (EBIT)% | 5.4 | 73.0 | 68.2 | 123.2 | 127.5 | 106.6 | 142.2 | 65.4 |
| EV/EBITDA (UBS core) x | 53.0 | 19.0 | 19.5 | 26.8 | 16.2 | 9.2 | 7.5 | 6.3 |
| P/E (UBS, diluted) x | 61.1 | 21.7 | 23.0 | 34.0 | 21.1 | 12.1 | 10.0 | 8.5 |
| Equity FCF (UBS) yield% | 1.1 | 2.4 | 4.3 | 1.2 | 1.8 | 1.1 | 18.9 | (24.1) |
| Dividend yield (net)% | 1.7 | 3.4 | 3.1 | 2.1 | 3.3 | 5.9 | 7.1 | 8.3 |
Source: Company accounts, LSEG Eikon, UBS estimates. Metrics marked as (UBS) have had analyst adjustments applied. Valuations: based on an average share price that year, (E): based on a share price of NT$ 942.00 on 24-Jul-2026 17:03:47 CST
Equities
Taiwan
Semiconductors
12-month rating
12m price target
Price (24 Jul 2026)
RIC:
6187.TWO
BBG:
6187 TT
Trading data and key metrics
| 52-wk range | NT$1,390.00-314.50 |
|---|---|
| Market cap. | NT$91.9b/US$2.84b |
| Shares o/s | 97.5m (ORD) |
| Free float | 77% |
| Avg. daily volume ('000) | 1,182 |
| Avg. daily value (m) | NT$1,384.2 |
| Common s/h equity (12/26E) | NT$8.16b |
| P/BV (12/26E) | 11.2x |
| Net debt to EBITDA (12/26E) | NM |
| EPS (UBS, diluted) (NT$) | From | To | %ch | Cons. |
|---|---|---|---|---|
| 12/26E | - | 27.71 | - | 25.06 |
| 12/27E | - | 44.54 | - | 41.14 |
| 12/28E | - | 77.9 | - | 52.01 |
Sunny Lin
Analyst sunny.lin@ubs.com +886-2-8722 7346
Ryan Sun
Associate Analyst ryan-za.sun@ubs.com +886-2-8722 7267
Christine Chen, CFA
Associate Analyst christine.chen@ubs.com +886-2-8722 7361
Buy
Prior : No Rating
NT$1,550.00
Prior :
NT$942.00
Thesis Map UBS Research THESIS MAP a guide to our thinking and what´s where in this report
Pivotal Questions
UBS VIEW
EVIDENCE
WHAT´S PRICED IN?
Upside/Downside Spectrum
Company Description
Q: Can All Ring sustain sales growth beyond the CoWoS capex cycle?
Yes. We are optimistic about the next capex cycle for advanced packaging, led by SoIC, CoPoS, and CPO in the upcoming years. We believe All Ring will remain a key back-end equipment supplier to major foundries and OSATs, with a rising share and an expanding equipment offering. In the near term, industry CoWoS expansion is set to accelerate across TSMC and ASE in H226-2027E, supported by a larger cloud AI market. Industry CoWoS capacity may reach >250kwpm by end-2027E from 160kwpm at end-2026E. We forecast All Ring's SEMI sales to grow 78% YoY in 2026, mainly supported by CoWoS, then 53% in 2027 and 70% in 2028, backed by a wider portfolio of new technologies, including SoIC, CoPoS, and CPO, on top of CoWoS.
Q: Could All Ring benefit from CPO?
Yes. We think All Ring's robotic arm and software algorithm expertise will position it at the forefront of FAU coupling equipment, critical for CPO adoption. All Ring mainly competes with Sungho from Korea, although we believe All Ring's tools may offer better coupling, with likely greater throughput. Given the cloud AI trend toward higher bandwidth to 3.2T and above, with a tighter power budget, we think CPO may have increasing industry adoption and become a more mainstream interconnect solution for next-generation AI servers in upcoming years (see our CPO deep dive). The technology is still in the early stage of mass production, although we anticipate the supply chain to start building capacity in 2027-28. We forecast All Ring to recognise CPO sales for 100 FAU coupling tools in 2027 and 300 in 2028, with CPO reaching 13%/23% of sales in 2027/2028.
We initiate at Buy and a price target of NT$1,550, implying 65% upside. We are optimistic about the sustained capex cycle of advanced packaging in the next two to three years, underpinned by cloud AI and the emerging CPO opportunity. Industry capex could rise further in 2028-29, driven by CoPoS, SoIC and other technologies in Taiwan, the US and Southeast Asia. New technologies such as CoPoS may lift All Ring's tool ASP >15%, on better capability and throughput. All Ring may expand share in CoPoS through improved execution and TSMC's localization. We forecast All Ring's SEMI sales to grow 78%/53%/70% in 2026/2027/28 and CPO to contribute 13%/23% of sales in 2027/2028.
Accelerated capex guidance by industry leaders such as TSMC and ASE indicates strong equipment demand for advanced packaging in 2026-27. TSMC noted the necessity to narrow the supplydemand gap for CoWoS, with progress in next-generation CoPoS packaging technology. The tech industry is also investing more resources to bring CPO into commercialisation in upcoming years.
After a recent pullback, All Ring is trading at 21x 2027E PE, a discount to advanced packaging peers. We believe the market underestimates new drivers such as CPO, CoPoS and SoIC. Regarding All Ring's positioning in FAU coupling vs. Sungho, we believe All Ring has several competitive advantages, including superior tool and software integration, relationships in the Taiwanese ecosystem leading to CPO development, and high R&D intensity to respond to customer requirements and drive hardware and productivity upgrades.
| Value drivers (2027E/2028E) | SEMI sales growth | CPO tool shipments | GM |
|---|---|---|---|
| NT$1,800 upside | 89%/49% | 250/350 | 56%/58% |
| NT$1,550 base | 53%/70% | 100/300 | 53%/54% |
| NT$500 downside | 35%/55% | 50/100 | 50%/51% |
Source: UBS estimates
Founded in 1996, All Ring is a leading automation and equipment supplier for the semiconductor back-end packaging and passive component manufacturing industries.
Can All Ring sustain sales growth beyond the CoWoS capex cycle?
Accelerating CoWoS industry expansion into 2027E
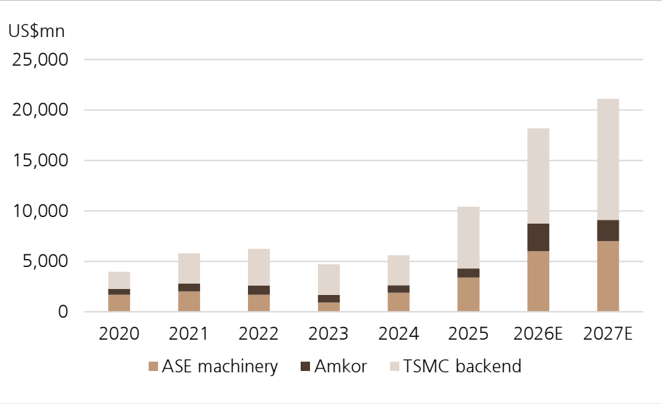
Advanced packaging has emerged as the essential technology enabler of highperformance compute chips since 2023, when cloud AI demand took off after the success of ChatGPT. Importantly, 2.5D die-to-die advanced packaging drives high-speed interconnect between accelerator chips and HBMs within the same package and supports a robust performance upgrade for AI chips even with slower Moore's law scaling for the front end. TSMC has been the leading advanced packaging supplier in the space with CoWoS (chip-on-wafer on-substrate) packaging technology and is investing capex continuously to satisfy high demand from AI/HPC applications. We forecast industry CoWoS capacity to continue rising from 90kwpm in 2025 to 160kwpm in 2026, then further to over 250kwpm in 2027, with demand continuing to outpace supply (see our latest CoWoS industry report). ASE and Amkor, the OSATs serving as non-TSMC advanced packaging suppliers, are also benefiting from larger advanced packaging demand and expanding advanced packaging capacity due to supply tightness at TSMC. We estimate packaging-related capex at TSMC, ASE and Amkor will remain high, from an aggregate US$4.7bn in 2023 to US$21.1bn in 2027 (our capex estimates are in Figure 2 R i s n c g a p e x b y T S M C , A E d m k o r f v t ).
All Ring is a key equipment supplier for TSMC's CoWoS. All Ring is the major supplier for lid placement, underfill dispensers and AOI tools for the on-substrate (oS) process of CoWoS . All Ring has benefited from the strong capex cycle of TSMC's CoWoS since 2023. We believe CoWoS orders could be sustained into 2027E, with accelerating expansion across TSMC and ASE.
Figure 1: We forecast industry CoWoS capacity to expand from 90kwpm at end2025 to >250kwpm by 2027
Source: UBS estimates
Figure 2: Rising capex by TSMC, ASE and Amkor for advanced packaging and testing
Source: Company data, UBS estimates
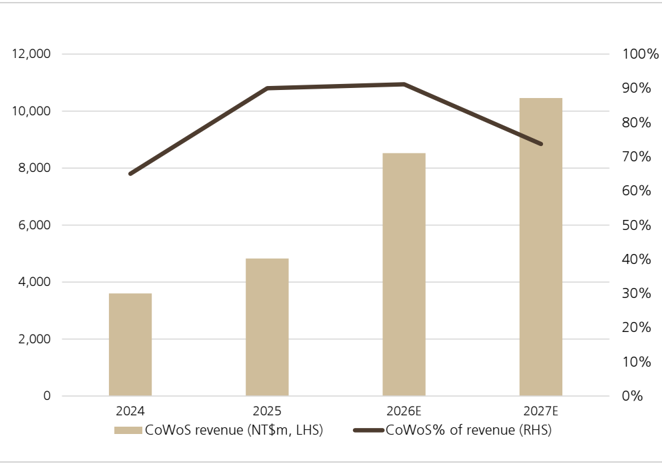
Figure 3: CoWoS order visibility to be sustained into 2026-27E - All Ring's sales from CoWoS, amount and as % of total sales
Source: UBS estimates
TSMC's CoPoS is the next opportunity beyond CoWoS
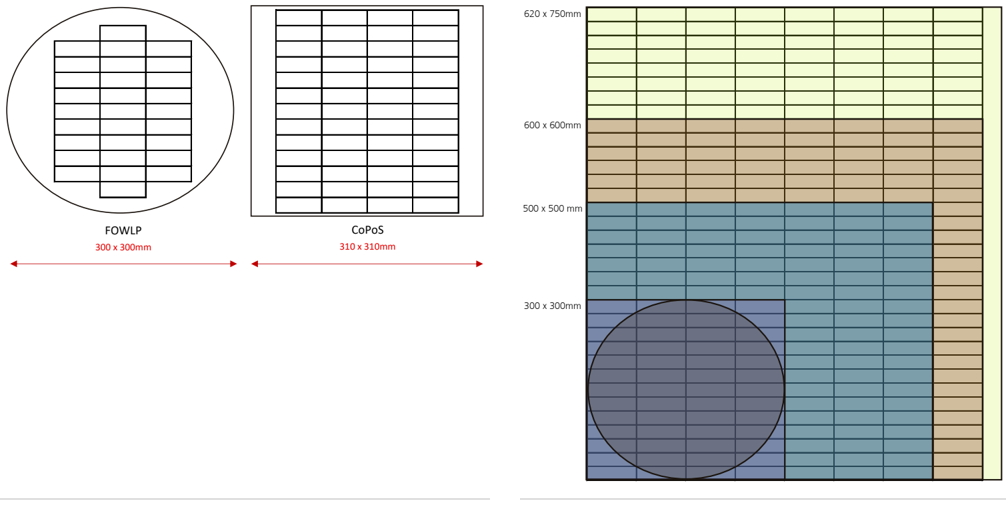
Beyond the CoWoS investment cycle, we believe TSMC has been aggressively developing next-generation 2.5D packaging technology CoPoS (chip-on-panel-onsubstrate). (For more, see our industry deep dive on CoPoS vs. Intel's EMIB-T.) CoPoS is being developed to satisfy the much larger package size (ie, 9-10x reticle size or larger) that aims to integrate four or more compute accelerators and over ten HBM stacks with more robust compute capability. TSMC's target is to put the technology into mass production in 2028, and it is setting up an R&D mini-line for technology verification. We think CoPoS is likely to drive another wave of equipment investment in 2027E and beyond.
Figure 4: Area utilisation of CoPoS (FO PLP) vs. CoWoS (FO WLP)
Figure 5: CoPoS (FO PLP) can achieve much larger carrier areas vs. CoWoS (FO WLP)
Source: UBS
Source: UBS
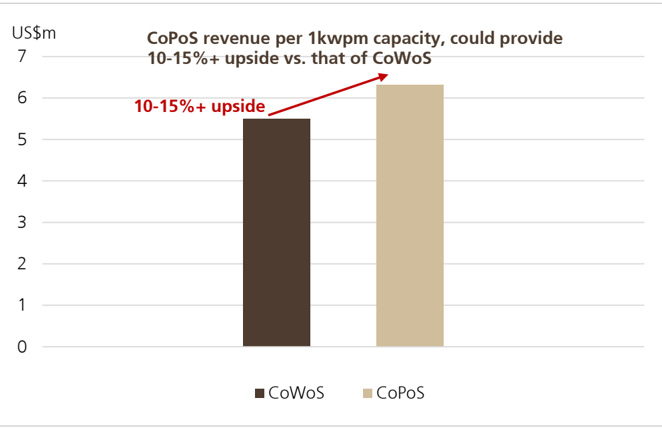
With its strong capability and track record in CoWoS, All Ring is likely to remain a major supplier for CoPoS across its tool sets of lid attach, underfill and AOI for the oS process, with further potential to gain share in underfill for the CoP process. In TSMC's CoWoS, the underfill and relevant AOI tools for CoW are supplied by ASYMTEK in the US, although we believe All Ring, through close collaboration with TSMC, may expand to CoP and gain more content. Even for oS-related equipment, including underfill, AOI and lid placement, we believe CoPoS could drive a 10-15%+ higher tool ASP , given a larger substrate and more complex chip package structures.
For every 1kwpm in CoWoS capacity, we estimate All Ring could drive ~US$5.5m in revenue (or NT$150-160m). We believe CoPoS may provide at least 10-15% upside for the tool ASP , or a US$6.0-6.3m revenue opportunity, with potential upside from a CoP share gain.
Figure 6: All Ring's revenue opportunity per 1 kwpm of CoWoS and CoPoS
Source: UBS estimates
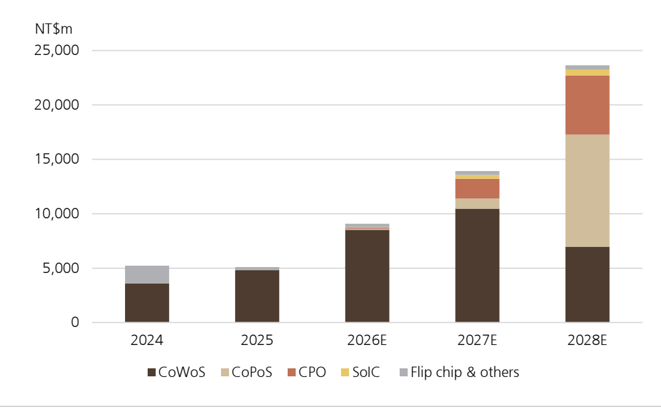
In addition to TSMC's back-end technologies, much higher industry investment in advanced packaging as a whole, across 2.5D packaging, 3D stacking, CPO and others, may also open up opportunities for All Ring to capture.
Figure 7: All Ring's SEMI sales by CoWoS, CoPoS, SoIC, CPO, and others in 202428E
Source: UBS estimates
Could All Ring benefit from CPO?
The data center bottleneck has shifted from compute to interconnect. With the rapid leap of compute performance of new AI accelerators, the bandwidth of interconnect has to be upgraded as well, while optimizing power consumption. CPO is set to power tomorrow's AI data centers, when interconnect migrates to 3.2T and above, as the current networking technologies (including traditional pluggable and copper) run out of steam. (See our in-depth report on CPO technology.) Nvidia is leading the industry's technological development, with scale-out (interconnect between racks) CPO switch scheduled to enter mass production in H226 for Rubin racks, with higher volume in 2027. Scale-up (interconnect within a rack) CPO solutions may begin in 2028, with Nvidia's next-generation rack architecture for Rubin Ultra and Feynman looking to integrate CPO with switch trays. Scale-up for XPUs (interconnect directly with XPUs on the compute board) may happen in 2029, based on Nvidia's current roadmap.
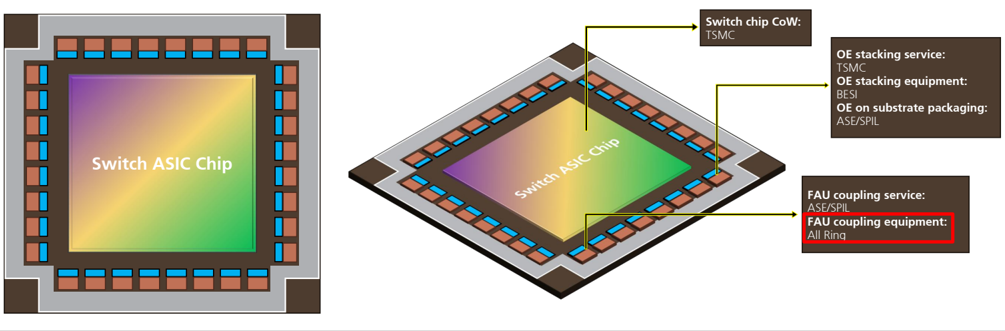
All Ring will play a critical role in the CPO supply chain in upcoming years. With its expertise in automation R&D on robotic arms and six-plane algorithms, All Ring will supply FAU coupling tools to OSATs such as ASE and SPIL. The tools will align FAUs with OEs. FAU coupling requires high-precision alignment on three planes (X, Y, and Z), especially at the initial stages of CPO adoption, when active alignment is necessary to grant the least insertion loss. The equipment will couple FAUs with OEs and glue the two components via underfill dispensers, then cure the underfill to solidify the attachment. From purely an oS process perspective, All Ring's FAU coupling equipment may generate a higher revenue opportunity per substrate, given the amount of FAUs that need to be attached to OEs (ie, 32 OEs for Nvidia's Spectrum scale-out switch) and lower throughput than for CoWoS, as the oS process is more mature and simplified.
TSMC
Figure 8: Nvidia's CPO packaging layout and notable suppliers
Source: UBS
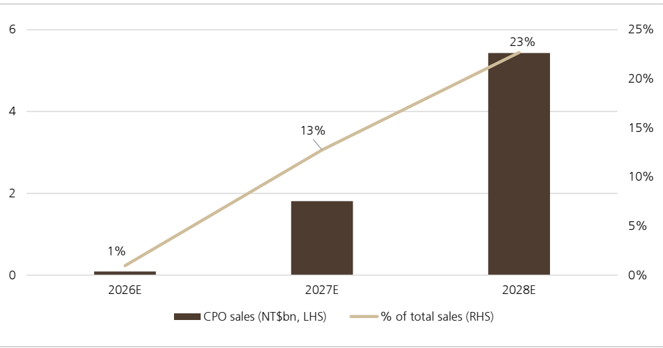
We are constructive on All Ring's industry positioning for FAU coupling and AOI equipment in 2027 and beyond, given its technological capability and close partnerships with TSMC and ASE/SPIL. We believe All Ring may comprise a >50% share in FAU coupling equipment and secure more orders vs. main competitor ADS Tech (a subsidiary of Sungho Electronics) in Korea. We forecast the FAU coupling opportunity to drive revenue of NT$1.8bn in 2027 and NT$5.4bn in 2028 for All Ring, accounting for 13%/23% of total sales, with a steady gross margin profile at least in line with the corporate target of 50-55%.
Figure 9: All Ring's CPO FAU coupling sales forecast
Source: UBS estimates
We believe All Ring is working on multiple CPO projects, with upside potential from additional tool offerings for other heterogeneous packaging/integration, which may come through in late 2027E or 2028E.
Company background
Founded in 1996 and listed on the Taiwan Stock Exchange in 2002, All Ring is a leading automation and equipment supplier for the semiconductor back-end packaging and passive component manufacturing industries. All Ring is highly R&D-focused, with 65% of its employees working in R&D, and it holds over 200+ patents. Headquartered in Kaohsiung, All Ring operates in Taiwan (Kaohsiung, HsinChu, Taichung), the US, Japan, Malaysia and Mainland China. Chairman Lu Ching-Lai, the founder, has led the company since its inception. According to its 2025 annual report, Mr. Lu and his wife currently own 13% of the company's shares.
The company began by manufacturing tools for passive component manufacturing but has expanded into semiconductor back-end packaging through long-established partnerships with global OSAT and foundry customers. All Ring started supplying ASE in 2000 and became involved in Apple's system-in-package (SiP) assembly in 2015. With
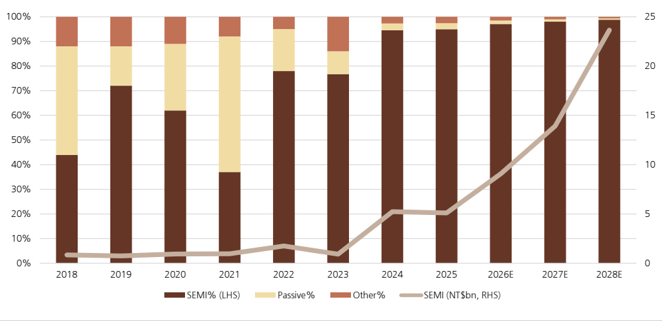
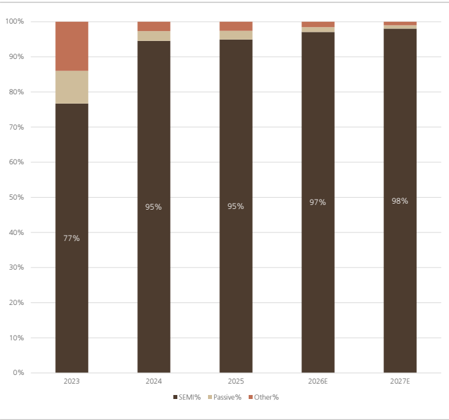
the growth of AI, HPC and advanced packaging, semiconductor equipment has become the majority of All Ring's revenue base, accounting for 95% of total revenue in 2024 and 2025, up from 78-79% in 2022-23. On an absolute NTD basis, its SEMI revenue in 2026E may grow ~10x from the 2023 level.
Figure 10: SEMI is now >95% of sales; on an absolute dollar basis, SEMI sales may grow 10x in 2026E from 2023
Source: Company data, UBS estimates
The company's revenue base is now primarily driven by CoWoS, which represented less than 5% of total revenue before 2023 but grew to 60-70% in 2024 and 90% in 2025. Along with this exponential growth, All Ring's top three customers accounted for 88% of its total revenue in 2024, up from 55% in 2023. We believe the largest customers are likely to be SPIL (mainly for TSMC demand) and ASE.
Key products
Within CoWoS, All Ring supplies tools such as underfill dispensers, AOI, heatsink placement, ball mounters, and flux jetting.
- Dispensers: A dispenser is a machine that applies liquid or paste-like materials with high-precision onto a substrate, wafer or another component. All Ring's product portfolio contains dispensers utilizing a variety of methodologies, including piezo, screw pumps, sprays, and syringes.
Figure 11: All Ring's Piezo dispenser for UV adhesive, underfill and other conductive adhesives
Source: All Ring
- Attachment/heterogeneous integration: In advanced packaging, bondingcritical capability is important to ensure high-quality integration between dissimilar materials.
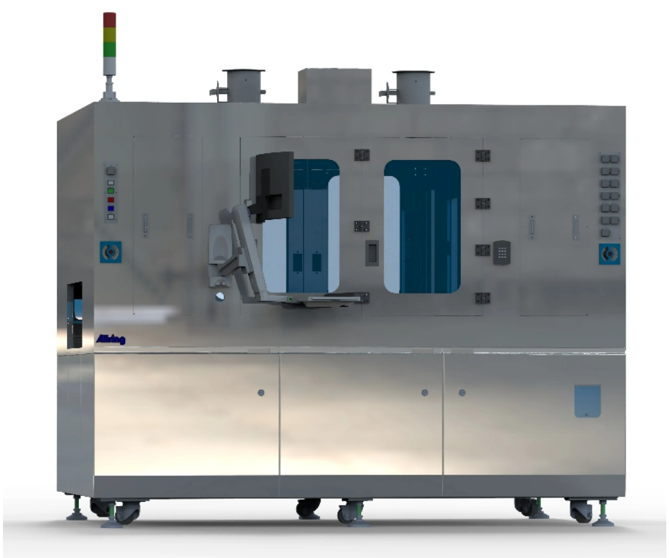
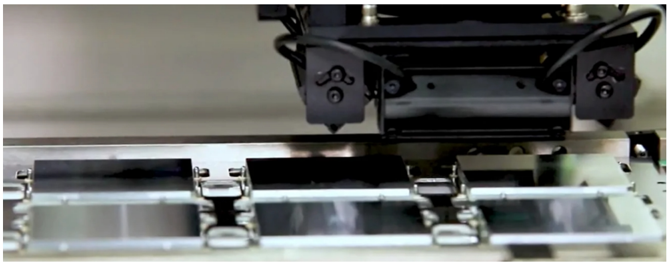
- Heatsinks: A heatsink is a passive component that absorbs heat from semiconductor packaging, which is crucial in advanced packaging as density and power intensity rises heat generation increases. The process includes heat spreader/thermal interface material (TIM) placement. All Ring offers thermal packaging process equipment that helps with process stability and yield enhancement.
- AOI: An AOI inspection machine detects missing dies and die colour markings through image recognition. All Ring focuses on 2D AOI, providing integrated inspection solutions across various packaging process stages, from in-line inspection to final product verification. For CPO, All Ring offers six-sided visual inspection tools.
Figure 12: Heatsink placement tool
Source: All Ring
Figure 13: AOI tools
Source: All Ring
- Automation systems: All Ring provides automation solutions from singlemachine integration to full production line design. These systems and solutions connect the entire workflow - dispensing, bonding, inspection, and material handling - to enable optimization, improved efficiency, performance stability and yield improvement.
Beyond CoWoS, All Ring continues to strengthen its capability in heterogeneous material bonding and high-precision process integration, and has been working on new technologies within CPO and panel-level packaging. We believe All Ring could expand its market share as TSMC commercializes CoPoS, and can play a critical role as the industry shifts to CPO. Leveraging its internal engineering expertise, All Ring has developed CPO optical coupling platforms between an FAU and an OE. According to the company, it will be able to supply key production tools within the optical coupling process, including alignment, dispensing, bonding and UV light curing. All Ring has already shipped some tools for customer testing.
- CPO-related products:
- FAU coupling: Optical coupling technology plays a crucial role in the CPO process by enabling high-precision alignment and stable coupling between optical components. As traditional electrical interconnects face limitations in bandwidth and power consumption, optical coupling is becoming increasingly essential. With All Ring's expertise in a six-axis motion platform, it has developed industry-leading high-precision FAU coupling tools to enable CPO adoption.
Figure 14: Nvidia's CPO packaging layout and notable suppliers
Source: UBS
Competition
All Ring's competitors are mainly foreign automated equipment manufacturers. Within CoWoS, ASYMTEK (a subsidiary of Nordson) is the main supplier of underfill dispensers for CoW, with All Ring supplying for only the oS part of the advanced packaging
TSMC
process. The dynamic could shift with CoPoS, as we believe All Ring engaged with TSMC early regarding CoPoS development and is likely to be the main supplier for CoP underfill and AOI tools, in addition to CoPoS oS tools.
Within CPO, All Ring competes with ADS Tech (subsidiary of Sungho), a Korean supplier, which is currently the major supplier for FAU coupling tools. However, we believe All Ring can gain market share in 2027 and potentially become the main supplier due to its close relationships with local Taiwanese OSATs and superior FAU coupling throughput for optimal efficiency.
Our forecast
Figure 15: UBS vs. consensus earnings estimates
| UBSe | UBSe | UBSe | Consensus | Consensus | Consensus | Difference | Difference | Difference | |
|---|---|---|---|---|---|---|---|---|---|
| (NT$m) | 2026E | 2027E | 2028E | 2026F | 2027F | 2028F | 2026E | 2027E | 2028E |
| Revenue | 9,351 | 14,194 | 23,937 | 8,865 | 14,693 | 19,889 | 5% | -3% | 20% |
| - YoY chg (%) | 74% | 52% | 69% | 65% | 66% | 35% | |||
| Gross profit | 4,899 | 7,523 | 12,926 | 4,709 | 8,046 | 11,351 | 4% | -7% | 14% |
| - Gross margin | 52.4% | 53.0% | 54.0% | 53.1% | 54.8% | 57.1% | |||
| Operating profit | 3,277 | 5,394 | 9,455 | 2,923 | 5,460 | 7,893 | 12% | -1% | 20% |
| - Operating margin | 35.0% | 38.0% | 39.5% | 33.0% | 37.2% | 39.7% | |||
| Pretax profit | 3,355 | 5,424 | 9,486 | 3,063 | 5,568 | 8,001 | 10% | -3% | 19% |
| Net profit | 2,699 | 4,339 | 7,589 | 2,536 | 4,538 | 6,441 | 6% | -4% | 18% |
| - Net margin | 28.9% | 30.6% | 31.7% | 28.6% | 30.9% | 32.4% | |||
| Basic EPS (NT$) | 28.03 | 45.06 | 78.81 | 26.33 | 47.13 | 66.88 | 6% | -4% | 18% |
| - YoY chg (%) | 82% | 61% | 75% | 70% | 79% | 42% |
Source: Visible Alpha, UBS estimates
Figure 16: UBS earnings forecast
| (NT$m) | 2025 | Q126 | Q226E | Q326E | Q426E | 2026E | Q127E | Q227E | Q327E | Q427E | 2027E | 2028E | 2029E | 2030E |
|---|---|---|---|---|---|---|---|---|---|---|---|---|---|---|
| Revenue | 5,366 | 1,411 | 2,355 | 3,039 | 2,546 | 9,351 | 2,497 | 3,237 | 4,185 | 4,275 | 14,194 | 23,937 | 28,031 | 31,166 |
| - YoY chg (%) | -3% | 13% | 55% | 78% | 187% | 74% | 77% | 37% | 38% | 68% | 52% | 69% | 17% | 11% |
| - QoQ chg (%) | 59% | 67% | 29% | -16% | -2% | -65% | 68% | 32% | ||||||
| Gross profit | 2,913 | 731 | 1,236 | 1,596 | 1,337 | 4,899 | 1,323 | 1,715 | 2,218 | 2,266 | 7,523 | 12,926 | 15,417 | 17,141 |
| - Gross margin | 54.3% | 51.8% | 52.5% | 52.5% | 52.5% | 52.4% | 53.0% | 53.0% | 53.0% | 53.0% | 53.0% | 54.0% | 55.0% | 55.0% |
| Operating profit | 1,611 | 328 | 824 | 1,170 | 955 | 3,277 | 949 | 1,230 | 1,590 | 1,625 | 5,394 | 9,455 | 11,493 | 13,402 |
| - Operating margin | 30.0% | 23.2% | 35.0% | 38.5% | 37.5% | 35.0% | 38.0% | 38.0% | 38.0% | 38.0% | 38.0% | 39.5% | 41.0% | 43.0% |
| Pre-tax profit | 1,813 | 387 | 832 | 1,177 | 960 | 3,355 | 956 | 1,239 | 1,599 | 1,630 | 5,424 | 9,486 | 11,523 | 13,488 |
| Net profit | 1,485 | 325 | 665 | 942 | 768 | 2,699 | 765 | 991 | 1,279 | 1,304 | 4,339 | 7,589 | 9,219 | 10,790 |
| - YoY chg (%) | 13% | -5% | 67% | 124% | 138% | 82% | 136% | 49% | 36% | 70% | 61% | 75% | 21% | 17% |
| - QoQ chg (%) | 0% | 105% | 42% | -18% | 0% | -63% | 67% | 32% | ||||||
| Basic EPS (NT$) | 15.42 | 3.37 | 6.91 | 9.78 | 7.97 | 28.03 | 7.94 | 10.29 | 13.28 | 13.54 | 45.06 | 78.81 | 95.73 | 112.05 |
| - YoY chg (%) | 6% | -6% | 66% | 124% | 137% | 82% | 136% | 49% | 36% | 70% | 61% | 75% | 21% | 17% |
| - QoQ chg (%) | 0% | 105% | 42% | -18% | 0% | -63% | 67% | 32% |
Source: Company data, UBS estimates
What´s Priced In?
WHAT´S PRICED IN?
| Product category | Ticker | Company name | Market cap (US$m) | Share price | Stock YTD performance | P/E (x) | P/E (x) | P/E (x) | Major equipment offering(s) |
|---|---|---|---|---|---|---|---|---|---|
| Product category | Ticker | Company name | Market cap (US$m) | Share price | Stock YTD performance | 2026E | 2027E | 2028E | Major equipment offering(s) |
| Die attach | 0522.HK | ASMPT | 8,802 | 166.5 | 115.0% | 31.7 | 22.4 | 18.2 | • Die bonder for on-substrate (mass reflow) • Thermo-compression bonder (Chip-to-substrate/Chip-to-wafer) • Hybrid bonder |
| BESI.AS | BE Semiconductor Industries | 20,156 | 229.9 | 71.9% | 53.1 | 35.1 | 22.7 | • Hybrid bonder • Thermo-compression bonder • Flip chip bonder | |
| 042700.KS | Hanmi Semiconductor | 13,965 | 216,000.0 | 69.5% | 64.1 | 40.7 | 34.1 | • Thermo-compression bonder | |
| KLIC.O | Kulicke and Soffa | 8,144 | 106.1 | 132.8% | 34.4 | 27.6 | 23.5 | • Thermo-compression bonder (Chip-to-substrate/Chip-to-wafer) • Ball bonder in InFO | |
| 6590.T | Shibaura Mechatronics | 2,317 | 5,410.0 | 42.8% | 23.5 | 18.5 | 13.1 | • Die bonder for chip-on-wafer (mass reflow) • Hybrid bonder | |
| Wet process | 3131.TWO | Grand Process Technology | 2,742 | 2,865.00 | 83.7% | 36.5 | 23.2 | 16.2 | • Wet process cleaning tool |
| Wet process | 3583.TW | Scientech | 1,883 | 715.00 | 114.1% | 34.6 | 23.2 | 17.4 | • Wet process cleaning tool • Temporary bonding/debonding system |
| Underfill | 6187.TWO | All Ring | 3,108 | 942.00 | 158.8% | 33.6 | 20.9 | 12.0 | • Underfill dispenser • Automated optical inspection (AOI) tool |
| Underfill | NDSN.O | Nordson Corporation | 16,706 | 292.1 | 21.5% | 25.2 | 23.3 | 21.6 | • Underfill dispenser |
| Metrology | 2360.TW | Chroma ATE | 28,297 | 2,080.00 | 168.4% | 49.4 | 32.7 | 24.6 | • Redistribution layer measurement |
Source: Company data, LSEG, UBS estimates. Notes: Taiwan stocks priced as of 24 July 2026; non-Taiwan stocks priced as of 23 July 2026. Share prices in local currency. EPS estimates for non-covered companies (Kulicke and Soffa, Shibaura Mechatronics, Scientech and Nordson Corporation) are based on LSEG consensus forecasts.
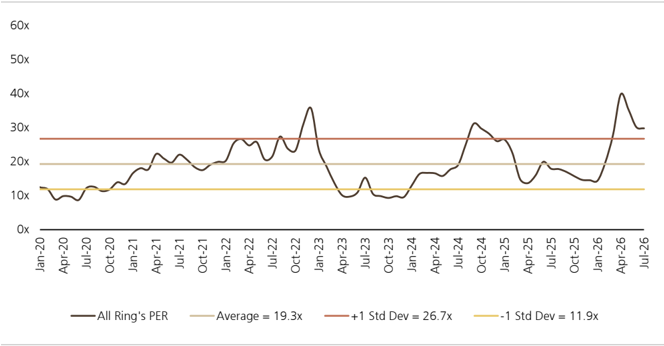
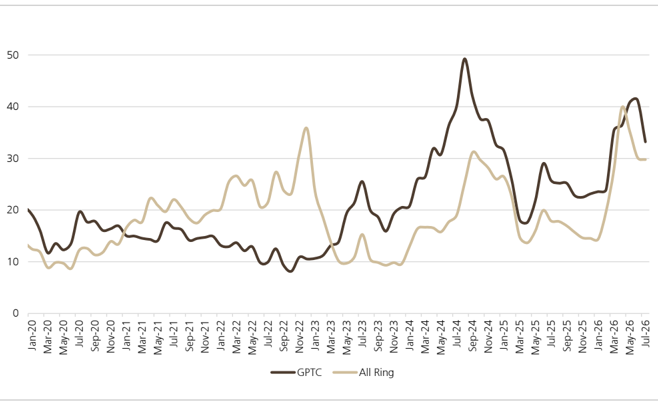
After a strong rally earlier in 2026, advanced packaging-related stocks have corrected for the past 3 months, on broader market de-leveraging, investor concerns regarding cloud capex, and a mixed outlook for CPO development. The rally in early 2026 was driven by optimism in advanced packaging capex with ongoing CoWoS expansion, TSMC's accelerated development of CoPoS, and CPO mass production as of H226. Advanced packaging equipment vendors are now trading at an average of 27x 2027E PE.
Figure 18: All Ring's 12-month-forward PE band (x)
Source: LSEG, UBS estimates
All Ring is trading at NT$942 as of 24 July 2026.
Figure 19: All Ring's vs. Grand Process' (GPTC's) forward PE - we believe there is upside for both
Source: LSEG, UBS estimates
CoPoS and CPO opportunity not fully priced in yet
After a recent pullback, All Ring is trading at 21x 2027E PE, a discount to advanced packaging peers. We believe the market underestimates the potential of new drivers such as CPO, CoPoS and SoIC. Regarding the debate around All Ring's positioning in FAU coupling vs. Sungho, we believe All Ring has several competitive advantages, including superior tool and software integration, long-lasting relationships in the Taiwanese ecosystem leading to CPO development, and R&D intensity to quickly upgrade tool productivity and specifications to customers' requirements.
Upside/Downside Spectrum
Upside/Downside Spectrum
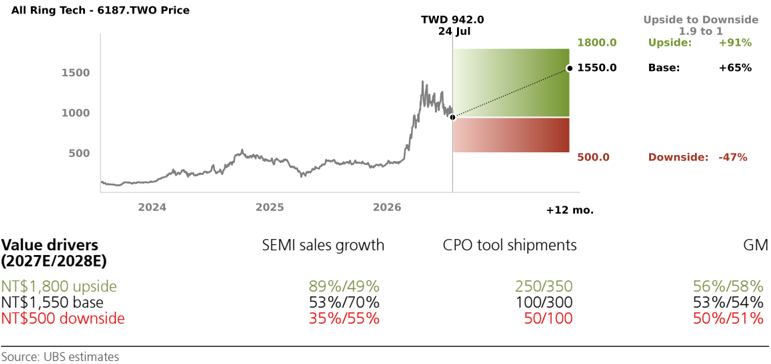
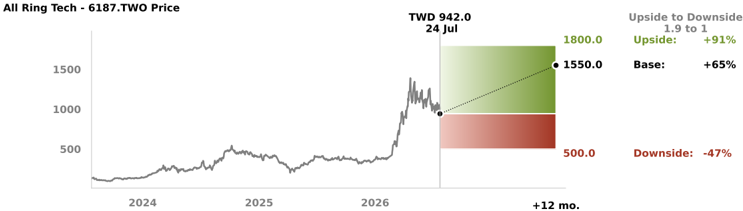
Risk to the current share price is skewed (1.9:1) to the upside.
UPSIDE(NT$1,800): Our upside scenario reflects more favourable overall deployment for CPO and CoPoS in the industry, with All Ring gaining majority shares in FAU coupling from ASD Tech and in CoP. This is likely to be a net positive for All Ring's equipment shipments in 2027-28. We assume CPO tool shipments of 250 in 2027 and 350 in 2028, while CoPoS sales could be positive for SEMI sales growth of 89%/49% YoY, reflecting volume deployment from Nvidia and a successful ramp from the supply chain, such as OSAT and testing partners.
BASE(NT$1,550): Our price target of NT$1,550 is based on 25x average 2027-28E PE. We expect an earnings CAGR of 35% in 2027-30E. While CoWoS remains resilient in 2027E, All Ring could gain shares in CPO and CoPoS, driving total SEMI sales growth of 53%/70% YoY in 2027/2028E, with GM of 53%/54%.
DOWNSIDE (NT$500): Our downside scenario reflects a slower-than-expected CPO ramp and slower-than-expected adoption of CoPoS. Slower scale-out CPO adoption due to supply chain challenges could meaningfully push the timeline outward, with smaller equipment shipments of 50 in 2027E and 100 in 2028E compared with our base case of 100 and 300. CoPoS adoption later than in 2028E may also challenge All Ring's sales growth in 2027-28E, with a lower ASP from premium CoP equipment, resulting in a weaker GM of 50%/51% in 2027/2028E.
All Ring is trading at NT $942 as of 24 July 2026
Company Description
Company Description
Founded in 1996, All Ring is a Taiwan-based supplier of automation equipment for the semiconductor back-end packaging and passive component manufacturing industries. The company's products include underfill dispensers, heatsink placement and automated optical inspection (AOI) tools for advanced packaging equipment, particularly for heterogeneous integration. Revenue is generated primarily from sales of semiconductor and electronic manufacturing equipment and related automation solutions, with more than 90% of revenue derived from Taiwan.
Industry Outlook
We are optimistic about the sustained capex cycle of advanced packaging in the next two to three years, backed by cloud AI demand and the emerging CPO opportunity. Advanced packaging plays a critical role in supporting cloud AI chips for greater compute performance and high-speed interconnect between compute and memory at lower power. We believe TSMC and ASE will accelerate CoWoS expansion in 2027. Industry capex may trend up further in 2028-29E, driven by CoPoS, SoIC and other technologies, with expansion in Taiwan, the US and Southeast Asia. CPO is a new optical interconnect solution with high bandwidth and reasonable power consumption for next-generation AI servers. As of now, CPO is still in the early stage of development, although we anticipate increasing adoption for interconnect between server racks and inside of servers in the next three to five years.
Revenue mix by segment (2023-27E)
Source: Company data, UBS estimates
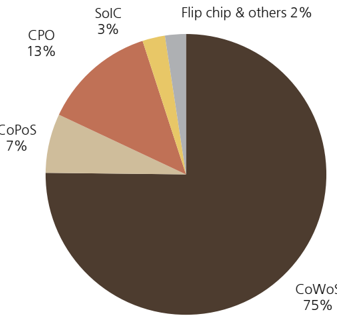
Revenue mix by technology (2027E)
Source: UBS estimates
All Ring Tech (6187.TWO)
| Income Statement (NT$m) | 12/23 | 12/24 | 12/25 | 12/26E | %ch | 12/27E | %ch | 12/28E | 12/29E | 12/30E |
|---|---|---|---|---|---|---|---|---|---|---|
| Revenues | 1,205 | 5,535 | 5,366 | 9,351 | 74.3 | 14,194 | 51.8 | 23,937 | 28,031 | 31,166 |
| Gross profit | 624 | 2,717 | 2,913 | 4,899 | 68.2 | 7,523 | 53.6 | 12,926 | 15,417 | 17,141 |
| EBITDA (UBS) | 137 | 1,483 | 1,679 | 3,383 | 101.5 | 5,591 | 65.3 | 9,841 | 12,112 | 14,291 |
| Depreciation & amortisation | (51) | (56) | (69) | (107) | -55.5 | (198) | -85.5 | (386) | (619) | (889) |
| EBIT (UBS) | 85 | 1,427 | 1,611 | 3,277 | 103.4 | 5,394 | 64.6 | 9,455 | 11,493 | 13,402 |
| Associates & investment income | 0 | 0 | (1) | 0 | - | 0 | - | 0 | 0 | 0 |
| Other non-operating income | 65 | 116 | 166 | 52 | -68.5 | 0 | - | 0 | 0 | 0 |
| Net interest | 10 | 22 | 37 | 26 | -28.6 | 30 | 13.1 | 31 | 31 | 87 |
| Exceptionals (incl goodwill) | 0 | 0 | 0 | 0 | - | 0 | - | 0 | 0 | 0 |
| Pre-tax profit | 161 | 1,566 | 1,813 | 3,355 | 85.1 | 5,424 | 61.6 | 9,486 | 11,523 | 13,488 |
| Tax | (23) | (255) | (316) | (661) | -108.8 | (1,085) | -64.1 | (1,897) | (2,305) | (2,698) |
| Profit after tax | 138 | 1,311 | 1,496 | 2,694 | 80.1 | 4,339 | 61.0 | 7,589 | 9,219 | 10,790 |
| Preference dividends | 0 | 0 | 0 | 0 | - | 0 | - | 0 | 0 | 0 |
| Minorities | 0 | 0 | (11) | 5 | - | 0 | - | 0 | 0 | 0 |
| Extraordinary items | 0 | 0 | 0 | - | 0 | - | 0 | 0 | 0 | |
| Net earnings (local GAAP) | 138 | 1,311 | 0 1,485 | 2,699 | 81.7 | 4,339 | 60.8 | 7,589 | 9,219 | 10,790 |
| Net earnings (UBS) | 138 | 1,311 | 1,485 | 2,699 | 81.7 | 4,339 | 60.8 | |||
| Tax rate (%) | 7,589 | 9,219 | 10,790 | |||||||
| 14.1 | 16.3 | 17.5 | 19.7 | 12.8 | 20.0 | 1.5 | 20.0 | 20.0 | 20.0 | |
| Per Share (NT$) EPS (UBS, diluted) | 12/23 1.59 | 12/24 14.57 | 12/25 15.26 | 12/26E 27.71 | %ch 81.6 | 12/27E 44.54 | %ch 60.8 | 12/28E 77.90 | 12/29E 94.63 | 12/30E 110.77 |
| EPS (local GAAP, diluted) | 1.59 | 14.57 | 15.26 | 27.71 | 81.6 | 44.54 | 60.8 | 77.90 | 94.63 | 110.77 |
| EPS (UBS, basic) | 1.70 | 14.57 | 15.42 | 28.03 | 45.06 | 60.8 | 78.81 | 112.05 | ||
| DPS (net) (NT$) | 1.61 | 10.80 | 19.62 | 81.7 | 31.54 | 55.16 | 95.73 | |||
| Cash EPS (UBS, diluted) 1 | 2.19 | 10.90 15.19 | 15.96 | 28.80 | 81.7 80.4 | 46.57 | 60.8 61.7 | 81.87 | 67.01 100.99 | 78.43 119.90 |
| Book value per share | 29.78 | 67.26 | 75.34 | 84.23 | 11.8 | 109.52 | 30.0 | 156.50 | 196.82 | 241.59 |
| Average shares (diluted) | 87 | 90 | 97 | 97 | 0.1 | 97 | 0.0 | 97 | 97 | |
| Balance Sheet (NT$m) | 12/23 | 12/24 | 12/25 | 12/26E | %ch | 12/27E | %ch | 97 12/28E | 12/29E | 12/30E |
| Cash and equivalents | 1,140 | 3,599 | 4,297 | 5,342 | 24.3 | 6,103 | 14.2 | 5,063 | 18,140 | (9,494) |
| Other current assets | 1,677 | 2,731 | 2,038 | 4,797 | 135.4 | 7,890 | 64.5 | 16,498 | 971 | 52,368 |
| Total current assets Net tangible fixed assets | 2,817 925 | 6,330 1,298 | 6,335 | 10,139 | 60.0 | 13,992 | 38.0 | 21,561 | 19,112 5,666 | 42,874 6,958 |
| 1,879 | 2,238 | 19.1 | 3,033 0 | 35.6 - | 4,323 | |||||
| Net intangible fixed assets | 0 | 0 | 0 | 0 | - | 1,573 | 0 | 0 | 0 | |
| Investments / other assets | 746 | 1,168 | 1,396 | 1,573 | 12.7 | 0.0 | 1,573 | 1,573 | 1,573 | |
| Total assets | 4,488 | 8,796 | 9,609 | 13,949 | 45.2 | 18,599 | 33.3 | 27,457 | 26,350 | 51,405 |
| Trade payables & other ST liabilities | 1,076 | 1,858 | 1,640 | 4,328 | 163.8 | 5,528 | 27.7 | 8,834 | 2,821 | 22,538 |
| Short term debt Total current liabilities | 0 1,076 | 0 1,858 | 0 1,640 | 0 4,328 | - 163.8 | 0 5,528 | - 27.7 | 0 8,834 | 0 2,821 | 0 22,538 |
| Long term debt | 853 | 290 | 350 | 1,144 | 226.7 | 2,144 | 87.4 | 3,144 | 4,144 | 5,144 |
| Other long term liabilities | 78 | 131 | 131 | 133 | 1.4 | 133 | 0.0 | 133 | 133 | 133 |
| Preferred shares | 0 | 0 | 0 | - | 0 | - | 0 | 0 | 0 | |
| Total liabilities (incl pref shares) | 2,007 | 0 2,279 | 2,121 | 5,604 | 164.2 | 7,804 | 39.3 | 12,110 | 7,097 | 27,815 |
| Common s/h equity Minority interests | 0 | 0 | 189 | 185 | -2.4 | 185 | 0.0 | 185 | 185 | 23,405 |
| 2,481 | 6,517 | 7,299 | 8,160 | 11.8 | 10,610 | 30.0 | 15,162 | 19,068 | 185 | |
| Total liabilities & equity | 4,488 | 8,796 | 9,609 | 13,949 | 45.2 | 18,599 | 33.3 | 27,457 | 26,350 | 51,405 |
| Cash Flow (NT$m) | 12/23 | 12/24 | 12/25 | 12/26E | %ch | 12/27E | %ch | 12/28E | 12/29E | 12/30E |
| Net income (before pref divs) | 138 | 1,311 | 1,485 | 2,699 | 81.7 | 4,339 | 60.8 | 7,589 | 9,219 | 10,790 |
| Depreciation & amortisation Net change in working capital | 51 | 56 (301) | 69 255 | 107 | 55.5 | 198 (1,893) | 85.5 -41.6 | 386 (5,302) | 619 9,514 | 889 |
| Other operating | 29 (10) | 14 | 149 | (1,337) 71 | - -52.7 | 0 | - | 0 | 0 | (31,679) 0 |
| Operating cash | 210 | 1,079 | 1,958 | 1,540 | -21.4 | 2,643 | 71.7 | 2,673 | 19,352 | (19,999) |
| flow Tangible capital | (124) | (373) | (512) 0 | 8.6 | (994) | -112.5 | (1,676) | (1,962) | (2,182) | |
| expenditure | (468) 0 | - | 0 | 0 | ||||||
| Intangible capital expenditure | 0 | 0 | - | 0 | 0 | |||||
| Net (acquisitions) & disposals | (288) | 55 | (49) | (37) | 24.2 | 0 0 | - - | 0 0 | 0 0 | 0 |
| Other investing Investing cash flow | 6 | (41) | (106) | (9) | 91.3 22.9 | 0 | ||||
| (406) | (359) | (666) | (514) | (994) | -93.5 | (1,676) | (1,962) | (2,182) | ||
| Equity dividends paid | (250) 0 | (131) 1,394 | (980) 0 | (1,040) | -6.1 | (1,889) | -81.7 - | (3,037) 0 | (5,312) 0 | (6,453) 0 |
| Share issues / (buybacks) | - | - | ||||||||
| Other financing | 26 | (6) | 192 | 0 (2) | - | 0 0 | 0 | 0 | 0 | |
| Change in debt & pref shares | (33) | 593 | 142 | 998 | NM | 1,000 | 0.2 | 1,000 | 1,000 | 1,000 |
| Financing cash flow Cash flow inc/(dec) in cash | (257) | 1,851 | (645) | (43) | 93.3 | (889) 761 | NM -22.6 | (2,037) (1,040) | (4,312) 13,077 | (5,453) |
| (453) | 2,571 | 647 | 983 | 52.0 20.9 | 0 | - | 0 | 0 | (27,634) 0 | |
| FX / non cash items Balance sheet inc/(dec) in cash | 156 | (112) | 51 698 | 62 1,045 | 761 | -27.2 | (1,040) | (27,634) | ||
| (297) | 2,459 | 49.7 | 13,077 |
Source: Company accounts, UBS estimates. (UBS) metrics use reported figures which have been adjusted by UBS analysts. 1 Cash EPS (UBS, diluted) is calculated using UBS net income adding back depreciation and amortization.
All Ring Tech (6187.TWO)
| Valuation (x) | 12/23 | 12/24 | 12/25 | 12/26E | 12/27E | 12/28E | 12/29E | 12/30E |
|---|---|---|---|---|---|---|---|---|
| P/E (local GAAP, diluted) | 61.1 | 21.7 | 23.0 | 34.0 | 21.1 | 12.1 | 10.0 | 8.5 |
| P/E (UBS, diluted) | 61.1 | 21.7 | 23.0 | 34.0 | 21.1 | 12.1 | 10.0 | 8.5 |
| P/CEPS | 41.6 | 20.8 | 21.7 | 32.3 | 20.0 | 11.4 | 9.2 | 7.8 |
| Equity FCF (UBS) yield% | 1.1 | 2.4 | 4.3 | 1.2 | 1.8 | 1.1 | 18.9 | (24.1) |
| Dividend yield (net)% | 1.7 | 3.4 | 3.1 | 2.1 | 3.3 | 5.9 | 7.1 | 8.3 |
| P/BV | 3.3 | 4.7 | 4.7 | 11.2 | 8.6 | 6.0 | 4.8 | 3.9 |
| EV/revenues (core) | 6.0 | 5.1 | 6.1 | 9.7 | 6.4 | 3.8 | 3.2 | 2.9 |
| EV/EBITDA (UBS core) | 53.0 | 19.0 | 19.5 | 26.8 | 16.2 | 9.2 | 7.5 | 6.3 |
| EV/EBIT (core) | 84.9 | 19.7 | 20.4 | 27.6 | 16.8 | 9.6 | 7.9 | 6.8 |
| EV/OpFCF (core) | 84.9 | 19.7 | 20.4 | 27.6 | 16.8 | 9.6 | 7.9 | 6.8 |
| EV/op. invested capital | 4.6 | 14.4 | 13.9 | 34.0 | 21.4 | 10.2 | 11.2 | 4.4 |
| Enterprise value (NT$m) | 12/23 | 12/24 | 12/25 | 12/26E | 12/27E | 12/28E | 12/29E | 12/30E |
| Market cap. | 8,112 | 29,327 | 34,019 | 91,864 | 91,864 | 91,864 | 91,864 | 91,864 |
| Net debt (cash) | (280) | (280) | (280) | (280) | (280) | (280) | (280) | (280) |
| Buy out of minorities | 0 | 0 | 189 | 185 | 185 | 185 | 185 | 185 |
| Pension provisions/other | 0 | 0 | 0 | 0 | 0 | 0 | 0 | 0 |
| Total enterprise value | 7,832 | 29,046 | 33,928 | 91,768 | 91,768 | 91,768 | 91,768 | 91,768 |
| Non core assets | (575) | (917) | (1,106) | (1,262) | (1,262) | (1,262) | (1,262) | (1,262) |
| Core enterprise value | 7,257 | 28,129 | 32,822 | 90,506 | 90,506 | 90,506 | 90,506 | 90,506 |
| Growth (%) | 12/23 | 12/24 | 12/25 | 12/26E | 12/27E | 12/28E | 12/29E | 12/30E |
| Revenue | (46.4) | NM | (3.0) | 74.3 | 51.8 | 68.6 | 17.1 | 11.2 |
| EBITDA (UBS) | (73.4) | NM | 13.2 | 101.5 | 65.3 | 76.0 | 23.1 | 18.0 |
| EBIT (UBS) | (81.6) | NM | 12.9 | 103.4 | 64.6 | 75.3 | 21.6 | 16.6 |
| EPS (UBS, diluted) | (72.3) | NM | 4.7 | 81.6 | 60.8 | 74.9 | 21.5 | 17.1 |
| Net DPS | (47.7) | NM | (0.9) | 81.7 | 60.8 | 74.9 | 21.5 | 17.1 |
| Margins & Profitability (%) | 12/23 | 12/24 | 12/25 | 12/26E | 12/27E | 12/28E | 12/29E | 12/30E |
| Gross profit margin | 51.8 | 49.1 | 54.3 | 52.4 | 53.0 | 54.0 | 55.0 | 55.0 |
| EBITDA margin | 11.4 | 26.8 | 31.3 | 36.2 | 39.4 | 41.1 | 43.2 | 45.9 |
| EBIT (UBS) margin | 7.1 | 25.8 | 30.0 | 35.0 | 38.0 | 39.5 | 41.0 | 43.0 |
| Net earnings (UBS) margin | 11.5 | 23.7 | 27.7 | 28.9 | 30.6 | 31.7 | 32.9 | 34.6 |
| ROIC (EBIT) | 5.4 | 73.0 | 68.2 | NM | NM | NM | NM | 65.4 |
| ROIC post tax | 4.7 | 61.1 | 56.3 | NM | NM | NM | NM | 52.4 |
| ROE (UBS) | 5.6 | 29.1 | 21.5 | 34.9 | 46.2 | 58.9 | 53.9 | 50.8 |
| Capital structure & Coverage (x) | 12/23 | 12/24 | 12/25 | 12/26E | 12/27E | 12/28E | 12/29E | 12/30E |
| Net debt / EBITDA | (2.1) | (2.2) | (2.4) | (1.2) | (0.7) | (0.2) | (1.2) | 1.0 |
| Net debt / total equity% | (11.6) | (50.8) | (52.7) | (50.3) | (36.7) | (12.5) | (72.7) | 62.0 |
| Net debt / (net debt + total equity)% | (13.1) | NM | NM | NM | (57.9) | (14.3) | NM | 38.3 |
| Net debt/EV% | (5.4) | (6.2) | (10.7) | (4.4) | (4.4) | (3.2) | (8.7) | 0.3 |
| Capex / depreciation% | NM | NM | NM | NM | NM | NM | NM | NM |
| Capex / revenue% | 10.3 | 6.7 | 9.5 | 5.0 | 7.0 | 7.0 | 7.0 | 7.0 |
| EBIT / net interest | - | - | - | - | - | - | - | - |
| Dividend cover (UBS) | 1.1 | 1.3 | 1.4 | 1.4 | 1.4 | 1.4 | 1.4 | 1.4 |
| Div. payout ratio (UBS)% | 94.4 | 74.8 | 70.0 | 70.0 | 70.0 | 70.0 | 70.0 | 70.0 |
| Revenues by division (NT$m) | 12/23 | 12/24 | 12/25 | 12/26E | 12/27E | 12/28E | 12/29E | 12/30E |
| Others | 1,205 | 5,535 | 5,366 | 9,351 | 14,194 | 23,937 | 28,031 | 31,166 |
| Total | 1,205 | 5,535 | 5,366 | 9,351 | 14,194 | 23,937 | 28,031 | 31,166 |
| EBIT (UBS) by division (NT$m) | 12/24 | 12/25 | 12/27E | 12/28E | 12/30E | |||
| 12/23 | 1,611 | 12/26E | 12/29E | 13,402 | ||||
| Others | 85 | 1,427 | 3,277 | 5,394 | 9,455 | 11,493 | ||
| Total | 85 | 1,427 | 1,611 | 3,277 | 5,394 | 9,455 | 11,493 | 13,402 |
Source: Company accounts, UBS estimates. (UBS) metrics use reported figures which have been adjusted by UBS analysts.
Forecast returns
| Forecast price appreciation | 64.5% |
|---|---|
| Forecast dividend yield | 2.1% |
| Forecast stock return | 66.6% |
| Market return assumption | 6.3% |
| Forecast excess return | 60.3% |
Company Description
Founded in 1996, All Ring is a Taiwan-based supplier of automation equipment for the semiconductor back-end packaging and passive component manufacturing industries. The company's products include underfill dispensers, heatsink placement and automated optical inspection (AOI) tools for advanced packaging equipment, particularly for heterogeneous integration. Revenue is generated primarily from sales of semiconductor and electronic manufacturing equipment and related automation solutions, with more than 90% of revenue derived from Taiwan.
Valuation Method and Risk Statement
We value All Ring based on PE methodology.
Risks for the semis industry:
- Geopolitical uncertainties: Geopolitical uncertainties including tariffs and more export control could negatively impact semis cycle, and a downturn would lead to slower demand in the overall market and moderating capacity expansion.
- Meaningful deceleration of new technology development: Slower demand and less investment are expected If there is meaningful deceleration of new technology development such as Cloud AI, autonomous driving, etc.
- Rising utility cost: Larger-than-expected utility cost increases would further pressure profitability. Rising utility costs in Taiwan have negatively impacted margins for Taiwan tech companies.
Company risks:
- Faster- or slower-than-expected CoWoS capacity expansion: This could result in All Ring gaining/losing equipment orders from major foundries and OSATs.
- Competitors achieving technological advancement: Potential risk of competition (from either local or foreign companies) achieving technological advancements could result in All Ring losing market share from major foundries and OSATs.
- Better- or worse-than-expected AI growth: Better- or worse-than-expected AI growth could lead to a ramp-up or a slowdown of equipment orders from major foundries and OSATs to All Ring, affecting long-term revenue growth potential.
- Slowdown or delay of new technological advancement: A potential slowdown or delay of the rollout for technological advancements for technologies such as SoIC, CoPoS, and CPO, would limit future equipment orders.
- Increase of raw material costs: Rising raw material costs may directly impact All Ring's margins for equipment shipments.
Grand Process Technology:
We value GPTC based on PE methodology.
Downside risks include: 1) slower-than-expected CoWoS capacity expansion; 2) competitors achieving technological advancement; 3) geopolitical uncertainty; and 4) worse-thanexpected AI growth.
Quantitative Research Review
UBS Global Research publishes a quantitative assessment of its analysts' responses to certain questions about the likelihood of an occurrence of a number of short term factors in a product known as the 'Quantitative Research Review'. The views for this month can be found below. Views contained in this assessment on a particular stock reflect only the views on those short term factors which are a different timeframe to the 12-month timeframe reflected in any equity rating set out in this note. For previous responses please make reference to (i) previous UBS Global Research reports; and (ii) where no applicable research report was published that month, the Quantitative Research Review which can be found at https://neo.ubs.com/quantitative, or contact your UBS sales representative for access to the report or the Quantitative Research Team on ubs-quant-answers@ubs.com. A consolidated report which contains all responses is also available and again you should contact your UBS sales representative for details and pricing or the Quantitative Research Team on the email above.
All Ring Tech
| Question | Response |
|---|---|
| 1. Is the industry structure facing the firm likely to improve or deteriorate over the next six months? Rate on a scale of 1-5 (1 = getting worse, 3 = no change, 5 = getting better, N/A = no view) | 4 |
| 2. Is the regulatory/government environment facing the firm likely to improve or deteriorate over the next six months? Rate on a scale of 1-5 (1 = getting tougher 3 = no change, 5 = getting better, N/A = no view) | 3 |
| 3. Over the last 3-6 months in broad terms have things been improving/no change/getting worse for this stock? Rate on a scale of 1-5 (1 = getting a lot worse, 3 = not much change, 5 = getting a lot better, N/A = no view) | 4 |
| 4. Relative to the current CONSENSUS EPS forecast, is the next company EPS update likely to lead to: (1 = negative surprise vs consensus, 3 = in-line with consensus, 5 = positive surprise vs consensus expectations, N/A = no view) | 3 |
| 5. What's driving the difference? | |
| 6. Relative to YOUR current earnings forecast, is there relatively greater risk at the next earnings result of:(1 = downside skew risk to earnings, 3 = equal upside or downside risk to earnings, 5 = upside skew risk to earnings, N/A = no view) | 3 |
| 7. What's driving the difference? | |
| 8. Is there an upcoming catalyst for the company over the next three months? | |
| 9. Is there an actual or approximate date for the catalyst? | |
| 10. Is the catalyst date an actual or approximate date? | |
| 11. What is the catalyst? |
Required Disclosures
This document has been prepared by UBS Securities Pte. Ltd., Taipei Branch, an affiliate of UBS AG. UBS AG, its subsidiaries, branches and affiliates, including former Credit Suisse AG and its subsidiaries, branches and affiliates are referred to herein as "UBS".
For information on the ways in which UBS manages conflicts and maintains independence of its UBS Global Research product; historical performance information; certain additional disclosures concerning UBS Global Research recommendations; and terms and conditions for certain third party data used in research report, please visit https://www.ubs.com/disclosures. Unless otherwise indicated, information and data in this report are based on company disclosures including but not limited to annual, interim, quarterly reports and other company announcements. The figures contained in performance charts refer to the past; past performance is not a reliable indicator of future results. Additional information will be made available upon request. UBS Securities Co. Limited is licensed to conduct securities investment consultancy businesses by the China Securities Regulatory Commission. UBS acts or may act as principal in the debt securities (or in related derivatives) that may be the subject of this report. This recommendation was finalized on: 24 July 2026 09:34 AM GMT. UBS has designated certain UBS Global Research department members as Derivatives Research Analysts where those department members publish research principally on the analysis of the price or market for a derivative, and provide information reasonably sufficient upon which to base a decision to enter into a derivatives transaction. Where Derivatives Research Analysts coauthor research reports with Equity Research Analysts or Economists, the Derivatives Research Analyst is responsible for the derivatives investment views, forecasts, and/or recommendations. Quantitative Research Review: UBS Global Research publishes a quantitative assessment of its analysts' responses to certain questions about the likelihood of an occurrence of a number of short term factors in a product known as the 'Quantitative Research Review'. Views contained in this assessment on a particular stock reflect only the views on those short term factors which are a different timeframe to the 12-month timeframe reflected in any equity rating set out in this note. For the latest responses, please see the Quantitative Research Review Addendum at the back of this report, where applicable. For previous responses please make reference to (i) previous UBS Global Research reports; and (ii) where no applicable research report was published that month, the Quantitative Research Review which can be found at https://neo.ubs.com/ quantitative, or contact your UBS sales representative for access to the report or the Quantitative Research Team on ubs-quantanswers@ubs.com. A consolidated report which contains all responses is also available and again you should contact your UBS sales representative for details and pricing or the Quantitative Research team on the email above.