PDF 原檔:報告_UBS_南茂8150_20260811_original.pdf
圖片清單(已驗證 2026-08-13)
| 檔名 | size | 分類 | 親眼所見內容 |
|---|---|---|---|
260811_ubs_chipmos_003.png |
97KB | 真資料圖 | ChipMOS 股價(黑線)疊圖目標價(藍線)沿革圖,2023-06 至 2026-08,下方附評等區間色塊(Buy/Sell/No Rating),最新目標價區間躍升至 NT$156 附近、股價亦同步走高至約 NT$100-160 區間 |
260811_ubs_chipmos_001.png |
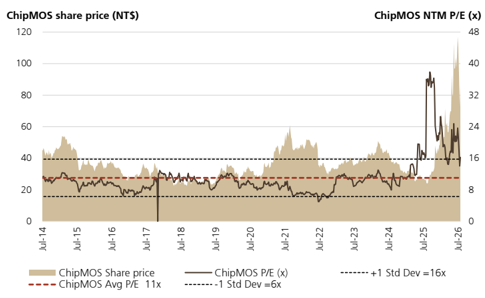
51KB | 真資料圖 | ChipMOS 股價(米色區塊,NT$,左軸)疊圖 NTM P/E(黑線,右軸),2014-07 至 2026 年,標示歷史均值 11x(紅虛線)與 ±1 Std Dev(16x/6x),近期股價與 P/E 同步大幅走高突破區間上緣 |
260811_ubs_chipmos_002.png |
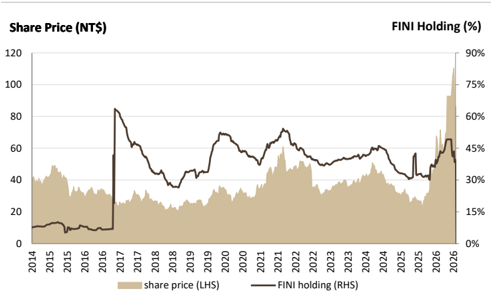
44KB | 真資料圖 | ChipMOS 股價(米色區塊,左軸)疊圖 FINI(外資)持股比例(黑線,右軸),2014-2026,外資持股 2026 年明顯回升,逼近甚至突破 2017 年前波高點 |
分類只有三類:
真資料圖/裝飾·logo·banner/文字卡。<40KB 未 Read 者免列(本報告 3 張皆 ≥40KB 且已逐張 Read)。
原始內容
First Read
ChipMOS Technologies
Raising logic capex supports mid-term growth
Strong margin recovery drives Q226 EPS beat
ChipMOS' Q226 EPS came in ahead at NT$1.27 vs. UBSe/street of NT$1.03/1.14 due to higher margins. Q226 sales was already posted through monthly sales at NT$7.4bn, +6.5% QoQ/+24% YoY, supported by robust demand from memory (51% of sales, +7% QoQ) and automotive (29% of sales, +14% QoQ) applications, while it also raised its ASP for both memory and driver IC backend during the quarter to reflect rising component cost and capacity tightness. Q226 GM improved to 18.0% (+4.2ppt QoQ) on better pricing environment and higher loading, and exceeded our estimate of 17.2% on a more favourable product mix, resulting in better OPM of 12.8%.
Memory to remain the key growth engine in H226
Management remains cautiously optimistic on H226, expecting a better H226 sales vs. H126 led by resilient memory demand. Within memory (51% of Q226 sales), DRAM is expected to outgrow Flash, supported by robust DDR4 demand and continued ramp of DDR5, while Flash should remain stable. In DDIC/bumping (39% of Q226 sales), despite softer end-demand for consumer electronics, seasonal build for OLED iPhone and robust automotive order should stabilize driver IC sales momentum. Management also expects packaging and testing utilization to continue improving as memory customers maintain active inventory replenishment. We forecast ChipMOS's Q326E sales to grow 10% QoQ, with GM expanding by 0.6ppt QoQ to 18.6%, supported by full-quarter benefit of price hikes and ramp of new capacity for higher-margin testing business, despite seasonal higher electricity cost. We believe further price hikes to pass through higher component cost to its customer in H226 is under negotiation.
Raising capex for broadening growth exposure in smartphone/AI ASICs
ChipMOS raised its 2026 capex to 25%+ of sales vs. its historical normalized level of below 20%, primarily to support memory backend expansions (mainly testing), alongside automation and AI-related upgrades. While memory remains the key driver of the higher capex, it is also broadening its logic testing exposure beyond TV SoC into smartphone AP and AI ASICs, accounting for 7-10% of 2026F capex. ChipMOS continues aim to leverage its bumping and backend capabilities to enter optical silicon photonics (SiPh) chain, which we believe should see more meaningful sales contribution from 2027E. Management also indicated 2027F capex/sales likely to remain above 25% levels and we believe its capex for logic testers could see exponential increase in 202728E as it penetrates into AI ASIC testing, supporting its mid-term revenue growth.
Valuation: Raise price target to NT$166; reiterate Buy rating
We raise our 2026-28E EPS by 5-8% on sustained memory strength and stronger growth from logic testing. We raise our price target from NT$156 to NT$166 with the same multiple of 23x 2027-28E average PE. Reiterate Buy rating on improving margin profiles and new AI (SiPh and logic testing) initiatives.
| Highlights (NT$m) | 12/23 | 12/24 | 12/25 | 12/26E | 12/27E | 12/28E | 12/29E | 12/30E |
|---|---|---|---|---|---|---|---|---|
| Revenues | 21,356 | 22,696 | 23,933 | 30,438 | 36,087 | 40,772 | 43,955 | 46,845 |
| EBIT (UBS) | 1,908 | 1,274 | 1,143 | 3,482 | 5,229 | 6,451 | 7,159 | 7,835 |
| Net earnings (UBS) | 1,893 | 1,420 | 495 | 3,147 | 4,550 | 5,563 | 6,177 | 6,816 |
| EPS (UBS, diluted) (NT$) | 2.60 | 1.95 | 0.69 | 4.50 | 6.50 | 7.95 | 8.82 | 9.74 |
| DPS (net) (NT$) | 2.30 | 1.80 | 1.23 | 1.25 | 2.25 | 3.25 | 3.97 | 4.41 |
| Net (debt) / cash | (2,558) | 1,121 | (612) | (4,864) | (8,018) | (8,060) | (5,101) | (1,338) |
| Profitability/valuation | 12/23 | 12/24 | 12/25 | 12/26E | 12/27E | 12/28E | 12/29E | 12/30E |
| EBIT (UBS) margin% | 8.9 | 5.6 | 4.8 | 11.4 | 14.5 | 15.8 | 16.3 | 16.7 |
| ROIC (EBIT)% | 9.8 | 5.0 | 4.8 | 12.6 | 15.3 | 16.6 | 17.6 | 19.2 |
| EV/EBITDA (UBS core) x | 3.6 | 4.9 | 3.5 | 8.5 | 7.2 | 6.3 | 5.8 | 5.3 |
| P/E (UBS, diluted) x | 14.6 | 20.8 | 44.9 | 22.0 | 15.2 | 12.5 | 11.2 | 10.2 |
| Equity FCF (UBS) yield% | 13.1 | 18.1 | 1.8 | (3.5) | (2.3) | 3.2 | 8.2 | 9.9 |
| Dividend yield (net)% | 6.0 | 4.4 | 4.0 | 1.3 | 2.3 | 3.3 | 4.0 | 4.5 |
Source: Company accounts, LSEG Eikon, UBS estimates. Metrics marked as (UBS) have had analyst adjustments applied. Valuations: based on an average share price that year, (E): based on a share price of NT$ 99.00 on 11-Aug-2026
| Equities | Equities | Equities | Equities |
|---|---|---|---|
| Taiwan | Taiwan | Taiwan | Taiwan |
| Semiconductors | Semiconductors | Semiconductors | Semiconductors |
| 12-month rating | 12-month rating | 12-month rating | Buy |
| 12m price target | 12m price target | 12m price target | NT$166.00 Prior : NT$156.00 |
| Price (11 Aug 2026) | Price (11 Aug 2026) | Price (11 Aug 2026) | NT$99.00 |
| RIC: 8150.TW BBG: 8150 TT | RIC: 8150.TW BBG: 8150 TT | RIC: 8150.TW BBG: 8150 TT | RIC: 8150.TW BBG: 8150 TT |
| Trading data and key metrics 52-wk | range | Trading data and key metrics 52-wk | NT$122.50-23.20 |
| Market cap. | Market cap. | Market cap. | NT$69.7b/US$2.16b |
| Shares o/s | Shares o/s | Shares o/s | 705m (ORD) |
| Free float | Free float | Free float | 82% |
| Avg. daily volume ('000) | Avg. daily volume ('000) | Avg. daily volume ('000) | 54,620 |
| Avg. daily value (m) | Avg. daily value (m) | Avg. daily value (m) | NT$5,434.5 |
| Common s/h equity (12/26E) | Common s/h equity (12/26E) | Common s/h equity (12/26E) | NT$26.4b |
| P/BV (12/26E) | P/BV (12/26E) | P/BV (12/26E) | 2.6x |
| Net debt to EBITDA (12/26E) | Net debt to EBITDA (12/26E) | Net debt to EBITDA (12/26E) | 0.6x |
| EPS (UBS, diluted) (NT$) | EPS (UBS, diluted) (NT$) | EPS (UBS, diluted) (NT$) | |
| From | To | %ch Cons. | |
| 12/26E | 4.15 | 4.50 | 8 4.17 |
| 12/27E | 6.19 | 6.50 | 5 5.90 |
| 12/28E | 7.35 | 7.95 | 8 7.36 |
Jerry Su
Analyst jerry.su@ubs.com +886-28-722 7306
Annie Chen
Associate Analyst annie.chen@ubs.com +886-2-8722 7281
Figure 1: UBS vs. consensus estimates
| 1Q26 | 2Q26E | 2Q26E | 2Q26E | 3Q26E | 3Q26E | 3Q26E | 2025 2026E | 2025 2026E | 2025 2026E | 2027E | 2027E | 2027E | |
|---|---|---|---|---|---|---|---|---|---|---|---|---|---|
| (NT$m) | Actual | Actual | UBSe prior | LSEG | UBSe | UBSe prior | LSEG | Actual | UBSe UBSe prior | LSEG | UBSe | UBSe prior | LSEG |
| Revenue | 6,936 | 7,383 | 7,383 | 7,645 | 8,112 | 7,970 | 7,608 | 23,933 | 30,438 30,223 | 29,312 | 36,087 | 35,178 | 33,428 |
| - QoQ / YoY | 6.4% | 6.5% | 6.5% | 10.2% | 9.9% | 7.9% | -0.5% | 5.5% | 27.2% 26.3% | 22.5% | 18.6% | 16.4% | 14.0% |
| Gross profit | 955 | 1,326 | 1,271 | 1,380 | 1,506 | 1,425 | 1,398 | 2,592 | 5,289 5,146 | 5,103 | 7,324 | 7,121 | 6,659 |
| - Gross margin | 13.8% | 18.0% | 17.2% | 18.1% | 18.6% | 17.9% | 18.4% | 10.8% | 17.4% 17.0% | 17.4% | 20.3% | 20.2% | 19.9% |
| Operating profit | 520 | 948 | 792 | 879 | 1,015 | 941 | 907 | 1,143 | 3,482 3,253 | 3,185 | 5,229 | 5,026 | 4,565 |
| - OP margin | 7.5% | 12.8% | 10.7% | 11.5% | 12.5% | 11.8% | 11.9% | 4.8% | 11.4% 10.8% | 10.9% | 14.5% | 14.3% | 13.7% |
| Non-Op | 78 | 79 | 139 | 87 | 120 | 112 | 137 | -555 | 377 431 | 323 | 377 | 431 | 435 |
| Pre-tax profit | 598 | 1,027 | 849 | 965 | 1,055 | 974 | 1,044 | 587 | 3,697 3,440 | 3,509 | 5,384 | 5,131 | 5,000 |
| Tax | 93 | 135 | 132 | 157 | 164 | 151 | 170 | 92 | 550 534 | 565 | 835 | 795 | 815 |
| - Tax rate | -16% | -13% | -16% | -16% | -16% | -16% | -16% | -16% | -15% -16% | -16% | -16% | -16% | -16% |
| Net profit | 505 | 892 | 718 | 808 | 892 | 823 | 874 | 495 | 3,147 2,906 | 2,944 | 4,550 | 4,336 | 4,184 |
| EPS (NT$) | 0.72 | 1.27 | 1.03 | 1.14 | 1.27 | 1.18 | 1.24 | 0.69 | 4.50 4.15 | 4.17 | 6.50 | 6.19 | 5.89 |
Source: Company data, LSEG, UBS estimates
Figure 2: Summary of annual P&L estimates
| Ticker Shares outstanding (mn) | Ticker Shares outstanding (mn) | 8150.TW 710.4 | Current Price (NT$) Mkt cap (NT$ mn) | Current Price (NT$) Mkt cap (NT$ mn) | $99.0 $70,334 | $99.0 $70,334 |
|---|---|---|---|---|---|---|
| Year | 2025 | 2026E | 2027E | 2028E | 2029E | 2030E |
| Revenues (NT$ mn) | $23,933 | $30,438 | $36,087 | $40,772 | $43,955 | $46,845 |
| YoY Growth (%) | 27.2% | 18.6% | 13.0% | 7.8% | 6.6% | |
| Gross profit (NT$mn) | $2,592 | $5,289 | $7,324 | $8,703 | $9,548 | $10,339 |
| GM (%) | 10.8% | 17.4% | 20.3% | 21.3% | 21.7% | 22.1% |
| Operating profit (NT$mn) | $1,143 | $3,482 | $5,229 | $6,451 | $7,159 | $7,835 |
| OPM (%) | 4.8% | 11.4% | 14.5% | 15.8% | 16.3% | 16.7% |
| Net profit (NT$ mn) | $495 | $3,147 | $4,550 | $5,563 | $6,177 | $6,779 |
| EPS (NT$) | $0.69 | $4.50 | $6.50 | $7.95 | $8.82 | $9.69 |
| EPS growth (%) | 548.1% | 44.6% | 22.3% | 11.0% | 9.8% | |
| P/E (x) | 142.7 | 22.0 | 15.2 | 12.5 | 11.2 | 10.2 |
| Dividend yield (%) | 1.2% | 1.3% | 2.3% | 3.3% | 4.0% | 4.5% |
| P/B (x) | 2.9 | 2.6 | 2.4 | 2.1 | 1.9 | 1.7 |
| ROE (%) | 2.1% | 11.9% | 15.5% | 17.0% | 17.1% | 17.1% |
Source: Company data, UBS estimates
Figure 3: Summary of ChipMOS's annual and quarterly estimates
| Quarters | 1Q25 | 2Q25 | 3Q25 | 4Q25 | 1Q26 | 2Q26 | 3Q26E | 4Q26E |
|---|---|---|---|---|---|---|---|---|
| Revenues (NT$ mn) | $5,532 | $5,736 | $6,144 | $6,521 | $6,936 | $7,383 | $8,112 | $8,007 |
| -- QoQ Growth (%) | 2.5% | 3.7% | 7.1% | 6.1% | 6.4% | 6.5% | 9.9% | -1.3% |
| -- YoY Growth (%) | 2.1% | -1.3% | 1.2% | 20.8% | 25.4% | 28.7% | 32.0% | 22.8% |
| Gross profit | $518 | $379 | $760 | $935 | $955 | $1,326 | $1,506 | $1,502 |
| -- Gross Margin (%) | 9.4% | 6.6% | 12.4% | 14.3% | 13.8% | 18.0% | 18.6% | 18.8% |
| EBITDA | $1,425 | $1,302 | $1,636 | $1,880 | $1,766 | $2,166 | $2,257 | $2,267 |
| -- EBITDA Margin (%) | 25.8% | 22.7% | 26.6% | 28.8% | 25.5% | 29.3% | 27.8% | 28.3% |
| Non-op | $82 | ($682) | $69 | ($24) | $78 | $79 | $120 | $99 |
| Pre-tax profit (NT$ mn) | $198 | ($661) | $438 | $612 | $598 | $1,027 | $1,055 | $1,016 |
| Tax | $22 | ($128) | $86 | $112 | $93 | $135 | $164 | $158 |
| -- tax rate (%) | 11.0% | 19.4% | 19.7% | 18.3% | 15.6% | 13.2% | 15.5% | 15.5% |
| Net profit (NT$ mn) | $176 | ($533) | $352 | $500 | $505 | $892 | $892 | $859 |
| -- QoQ Growth (%) | -24.1% | -402.4% | -166.1% | 41.9% | 1.0% | 76.6% | 0.0% | -3.7% |
| -- YoY Growth (%) | -59.7% | -218.3% | 17.6% | 115.2% | 186.4% | -267.3% | 153.2% | 71.9% |
| EPS (NT$) | $0.24 | -$0.75 | $0.50 | $0.70 | $0.72 | $1.27 | $1.27 | $1.23 |
Source: Company data, UBS estimates
Figure 4: ChipMOS's historical PE range
Source: LSEG
| 2025 | 2026E | 2027E | 2028E | 2029E |
|---|---|---|---|---|
| $23,933 | $30,438 | $36,087 | $40,772 | $43,955 |
| 5.5% $2,592 | 27.2% $5,289 17.4% $8,456 | 18.6% $377 | 13.0% $397 $6,583 | 7.8% $9,548 |
| $7,324 | $8,703 | |||
| 10.8% | 20.3% | 21.3% | 21.7% | |
| $6,243 | $10,557 | $12,218 | $13,098 | |
| 26.1% | 27.8% | 29.3% | 30.0% | 29.8% |
| ($555) | $377 | $464 | ||
| $587 | $3,697 | $5,384 | $7,310 | |
| $92 | $550 | $835 | $1,020 | $1,133 |
| 15.7% | 14.9% | 15.5% | 15.5% | 15.5% |
| $495 | $3,147 | $4,550 | $5,563 | $6,177 |
| -65.1% | 535.6% | 44.6% | 22.3% | 11.0% |
| $0.69 | $4.50 | $6.50 | $7.95 | $8.82 |
Figure 5: ChipMOS's FINI ownership
Source: TEJ
Forecast returns
| Forecast price appreciation | 67.7% |
|---|---|
| Forecast dividend yield | 1.3% |
| Forecast stock return | 68.9% |
| Market return assumption | 6.3% |
| Forecast excess return | 62.7% |
Company Description
ChipMOS is a semiconductor back-end supplier with 45-50% of its sales from display driver IC (~40% from TV and 40% from smartphone and IT and 20% from automotive), 35-40% from memory (~40% DRAM, ~40% from specialty flash and ~20% from mainstream NAND) and 10-15% from logic (TV SoC) and mixed signal IC (MEMS, PMIC).
Valuation Method and Risk Statement
We have a Buy rating and NT$55 price target based on 11x 2025 PE (vs. its 5-15x PE range). Our target multiple is in line with its ~10x long term average as we believe the memory and display driver IC cycle should improve similar to 2017 and late 2019. Downside risks: weaker than expected tech end market demand recovery and growing China competition.
Quantitative Research Review
UBS Global Research publishes a quantitative assessment of its analysts' responses to certain questions about the likelihood of an occurrence of a number of short term factors in a product known as the 'Quantitative Research Review'. The views for this month can be found below. Views contained in this assessment on a particular stock reflect only the views on those short term factors which are a different timeframe to the 12-month timeframe reflected in any equity rating set out in this note. For previous responses please make reference to (i) previous UBS Global Research reports; and (ii) where no applicable research report was published that month, the Quantitative Research Review which can be found at https://neo.ubs.com/quantitative, or contact your UBS sales representative for access to the report or the Quantitative Research Team on ubs-quant-answers@ubs.com. A consolidated report which contains all responses is also available and again you should contact your UBS sales representative for details and pricing or the Quantitative Research Team on the email above.
ChipMOS Technologies
| Question | Response |
|---|---|
| 1. Is the industry structure facing the firm likely to improve or deteriorate over the next six months? Rate on a scale of 1-5 (1 = getting worse, 3 = no change, 5 = getting better, N/A = no view) | 4 |
| 2. Is the regulatory/government environment facing the firm likely to improve or deteriorate over the next six months? Rate on a scale of 1-5 (1 = getting tougher 3 = no change, 5 = getting better, N/A = no view) | 3 |
| 3. Over the last 3-6 months in broad terms have things been improving/no change/getting worse for this stock? Rate on a scale of 1-5 (1 = getting a lot worse, 3 = not much change, 5 = getting a lot better, N/A = no view) | 4 |
| 4. Relative to the current CONSENSUS EPS forecast, is the next company EPS update likely to lead to: (1 = negative surprise vs consensus, 3 = in-line with consensus, 5 = positive surprise vs consensus expectations, N/A = no view) | 4 |
| 5. What's driving the difference? | |
| 6. Relative to YOUR current earnings forecast, is there relatively greater risk at the next earnings result of:(1 = downside skew risk to earnings, 3 = equal upside or downside risk to earnings, 5 = upside skew risk to earnings, N/A = no view) | 3 |
| 7. What's driving the difference? | |
| 8. Is there an upcoming catalyst for the company over the next three months? | No Catalyst |
| 9. Is there an actual or approximate date for the catalyst? | |
| 10. Is the catalyst date an actual or approximate date? | |
| 11. What is the catalyst? |
Required Disclosures
This document has been prepared by UBS Securities Pte. Ltd., Taipei Branch, an affiliate of UBS AG. UBS AG, its subsidiaries, branches and affiliates, including former Credit Suisse AG and its subsidiaries, branches and affiliates are referred to herein as "UBS".
For information on the ways in which UBS manages conflicts and maintains independence of its UBS Global Research product; historical performance information; certain additional disclosures concerning UBS Global Research recommendations; and terms and conditions for certain third party data used in research report, please visit https://www.ubs.com/disclosures. Unless otherwise indicated, information and data in this report are based on company disclosures including but not limited to annual, interim, quarterly reports and other company announcements. The figures contained in performance charts refer to the past; past performance is not a reliable indicator of future results. Additional information will be made available upon request. UBS Securities Co. Limited is licensed to conduct securities investment consultancy businesses by the China Securities Regulatory Commission. UBS acts or may act as principal in the debt securities (or in related derivatives) that may be the subject of this report. This recommendation was finalized on: 11 August 2026 11:27 AM GMT. UBS has designated certain UBS Global Research department members as Derivatives Research Analysts where those department members publish research principally on the analysis of the price or market for a derivative, and provide information reasonably sufficient upon which to base a decision to enter into a derivatives transaction. Where Derivatives Research Analysts coauthor research reports with Equity Research Analysts or Economists, the Derivatives Research Analyst is responsible for the derivatives investment views, forecasts, and/or recommendations. Quantitative Research Review: UBS Global Research publishes a quantitative assessment of its analysts' responses to certain questions about the likelihood of an occurrence of a number of short term factors in a product known as the 'Quantitative Research Review'. Views contained in this assessment on a particular stock reflect only the views on those short term factors which are a different timeframe to the 12-month timeframe reflected in any equity rating set out in this note. For the latest responses, please see the Quantitative Research Review Addendum at the back of this report, where applicable. For previous responses please make reference to (i) previous UBS Global Research reports; and (ii) where no applicable research report was published that month, the Quantitative Research Review which can be found at https://neo.ubs.com/ quantitative, or contact your UBS sales representative for access to the report or the Quantitative Research Team on ubs-quantanswers@ubs.com. A consolidated report which contains all responses is also available and again you should contact your UBS sales representative for details and pricing or the Quantitative Research team on the email above.