PDF 原檔:報告_Macquarie_聯電2303Initiation_20260715_original.pdf
圖片清單(已驗證 2026-07-15)
| 檔名 | size | 分類 | 親眼所見內容 |
|---|---|---|---|
報告_Macquarie_聯電2303Initiation_20260715_002.png |
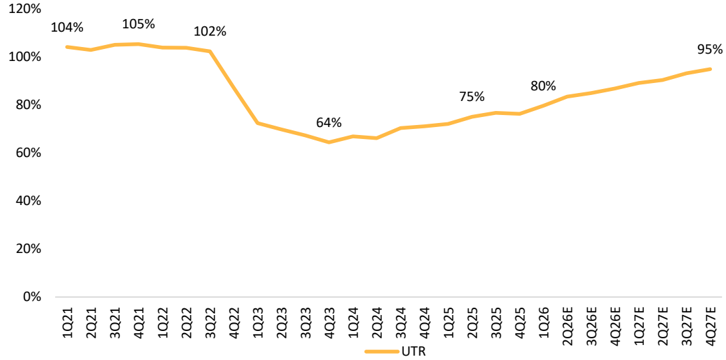
44.5KB | 真資料圖 | Figure 1:UMC 各季稼動率(UTR)折線圖,1Q21 104%→4Q23 谷底 64%→4Q27E 回升至 95% |
報告_Macquarie_聯電2303Initiation_20260715_003.png |
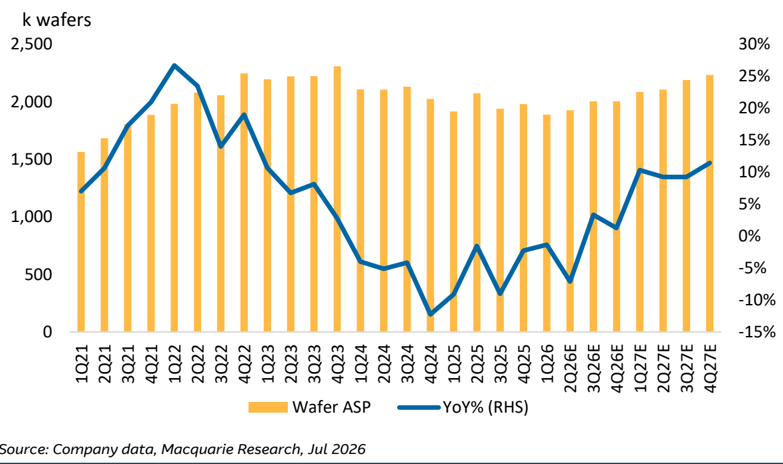
86.9KB | 真資料圖 | Figure 2:UMC 各季晶圓 ASP(12吋約當)長條圖+YoY%折線,2024 谷底後回升至 2027E 高點 |
報告_Macquarie_聯電2303Initiation_20260715_004.png |
52.0KB | 真資料圖 | Figure 3:季度晶圓代工市占率堆疊長條圖(TSMC/Samsung/SMIC/UMC/GlobalFoundries/Others),1Q24-1Q26,UMC 占比 4-6% |
報告_Macquarie_聯電2303Initiation_20260715_006.png |
80.7KB | 真資料圖 | Figure 7:全球晶圓代工廠 Capex 趨勢折線圖(UMC/SMIC/VIS/GlobalFoundries/HH Grace/TSMC),2020-2026E |
報告_Macquarie_聯電2303Initiation_20260715_010.png |
40.3KB | 真資料圖 | Figure 11:UMC 營收(長條)、毛利率/營益率(折線)趨勢圖,2018-2028E |
報告_Macquarie_聯電2303Initiation_20260715_011.png |
42.0KB | 真資料圖 | Figure 12:UMC 營收成長趨勢圖(長條=營收、折線=YoY%),2018-2028E |
報告_Macquarie_聯電2303Initiation_20260715_024.png |
44.8KB | 真資料圖 | Figure 24:UMC 各季晶圓 ASP(12吋約當)長條+YoY%折線圖,與 Figure 2 同系列數據不同呈現角度 |
報告_Macquarie_聯電2303Initiation_20260715_030.png |
48.8KB | 真資料圖 | Figure 34:12個月 forward P/E 河流圖(8x/13x/18x/23x/28x 帶狀)+實際股價紅線,Jan-17~Jul-26 |
報告_Macquarie_聯電2303Initiation_20260715_031.png |
48.9KB | 真資料圖 | Figure 35:12個月 forward P/B 河流圖(1x/2x/3x/4x/5x 帶狀)+實際股價紅線,Jan-17~Jul-26 |
報告_Macquarie_聯電2303Initiation_20260715_035.png |
80.1KB | 真資料圖 | Macquarie 風格因子月度多空報酬熱力表(Alpha/Value/Analyst/Momentum/Growth/Profitability/Quality/Capital/Liquidity/Low Risk),Jul-25~Jun-26 |
報告_Macquarie_聯電2303Initiation_20260715_036.png |
46.1KB | 真資料圖 | 2303 TT 相對 TAIEX 股價走勢圖+歷次目標價標記(綠點),Feb-24~Jul-26,股價由約50漲至150附近 |
以上為所有 ≥40KB 候選圖片(共 11 張),全數逐張 Read 驗證,皆為真資料圖;<40KB 未列者預設版面裝飾圖。
原始內容
rec history
300.00
— 2303 [LHS]
250.00
Outperform
100.00
•
50.00 -•
0.00
N
Feb-24 Sep-24 May-25 Dec-25 Jul-26
Source• FactSet. Macauarie Research. Jul 2026 (all fiaures in
UMC
Initiation: Trailing edge to take the lead
Key Points
- Sustainable demand recovery, higher utilisation rates, & price hikes for trailing edge foundry should lead to strong GPM/EPS momentum.
- Other drivers include: fab-lite partnership with Intel at 12nm (and beyond), TFLN photonics, memory, and advanced packaging.
- We initiate coverage with an Outperform rating and NT$258 TP. We see upside risk to 2H26-2028 consensus estimates.
Utilisation, ASP, sales growth, margins on the rise : UMC is a
semiconductor foundry focused on mature nodes (through 28/22nm). We believe we are still in the early stages of an up-cycle and that 2026 is an inflection point for mature node foundries driven by: 1) an inventory correction in 2025, 2) increasing demand (e.g., growing power content for AI-related capex), 3) bifurcation of China and ex-China semiconductor markets, and 4) major foundries phasing out 8-inch and legacy nodes. UMC is set to benefit with accelerating revenue, higher utilisation rates, and higher ASPs, which should all lead to higher margins/EPS growth.
New businesses provide additional upside potential : UMC is embarking on new leading-edge/new technology partnerships.
- Intel partnership on 12nm: UMC will contribute foundry services and 12nm process technology expertise to provide customers with US-based manufacturing. We expect this will move beyond 12nm.
- Hyperlight: In 1Q26, UMC signed an agreement for high-volume foundry production of Hyperlight's TFLN chiplet (both 6" and 8").
- UMC may also partner with memory IP suppliers to mass produce/sell NAND-like products.
- UMC notes it will also continue to develop advanced packaging, including 3D, with clients.
Upside to consensus forecasts : We believe the combination of higher utilisation rates, price hikes, and new business will likely spur a round of consensus upgrades on margins. We initiate with an Outperform rating.
Valuation: Our target price of NT$258 is based on 22x 2028E P/E, a premium to its 13x historical one-year forward average, given our expectation of a longer, sustainable up-cycle (higher growth).
Catalysts: A continuation of increasing utilisation rates in 2H26 and 2027, ASP hikes from 2H26, and high-margin revenue from new businesses.
Investment Thesis and Recommendation
We believe 2026 is a key inflection point for trailing-edge technology at foundries, which will lead to expanding utilisation rates. Some supply is being phased out and new capacity is expensive and non-competitive (benefitting established players). Initiate at Outperform.
- Rel TAlEX [RHS) • Price Target
140.00
60.00
40.00
Semicons & Semicon Equip
Taiwan
Jeffrey Ohlweiler
Leo Tsai
| 2303 TT | Outperform |
|---|---|
| Price (at 14 Jul 2026) | TWD151.00 |
| 12-month target | TWD258.00 |
| 12-month TSR (%) | 72.7 |
| Volatility Index | High |
| Market Cap (Local) (m) | 1,899,125 |
| Market Cap (USD) (m) | 59,029 |
| Free Float (%) | 93 |
| 30-day avg turnover (USD) (m) | 1,001.8 |
Investment Fundamentals
| Year end 31 Dec Revenue (m) | 2025A | 2026E | 2027E | 2028E |
|---|---|---|---|---|
| 237.6 | 271.5 | 342.4 | 428.5 | |
| Revenue growth (%) | 2.3 | 14.3 | 26.1 | 25.1 |
| EBIT (m) | 43.9 | 62.8 | 108.6 | 171.3 |
| EBIT growth (%) | (14.8) | 42.8 | 73.0 | 57.8 |
| Reported profit (m) | 41.7 | 61.4 | 92.3 | 146.5 |
| Adjusted profit (m) | 41.7 | 61.4 | 92.3 | 146.5 |
| EPS rep [TWD] | 3.3 | 4.9 | 7.4 | 11.7 |
| EPS rep growth (%) | (12.1) | 47.2 | 50.2 | 58.7 |
| EPS adj [TWD] | 3.3 | 4.9 | 7.4 | 11.7 |
| EPS adj growth (%) | (12.1) | 47.2 | 50.2 | 58.7 |
| Net debt/equity (%) | (9.9) | (23.2) | (30.2) | (37.7) |
| ROA (%) | 7.6 | 10.2 | 15.7 | 21.5 |
| ROE (%) | 11.0 | 15.4 | 20.6 | 28.1 |
| PER rep (x) | 45.2 | 30.7 | 20.4 | 12.9 |
| PER adj (x) | 45.2 | 30.7 | 20.4 | 12.9 |
| EV/EBITDA (x) | 17.5 | 14.2 | 10.4 | 7.6 |
| P/BV (x) | 5.0 | 4.5 | 4.0 | 3.3 |
| Total div yield (%) | 1.9 | 1.7 | 1.9 | 2.9 |
Quant (rank vs. global sector)
285 / 668
2303 TT rel TAIEX performance, & rec history
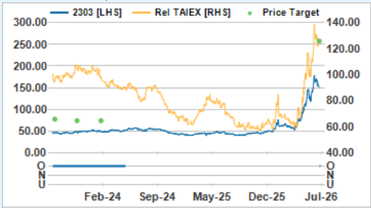
Source: FactSet, Macquarie Research, Jul 2026 (all figures in TWD unless noted, TP in TWD)
Key Risks to Investment Thesis
- A quick trailing-edge foundry upcycle, where utilisation rates peak in 2H26 or early 2027.
- Failure to achieve meaningful revenue in any of its joint venture projects.
- Higher-than-expected costs/inflation that can't be offset by ASP hikes.
UMC (2303 TT) TWD/(m) unless otherwise noted
Company Description
United Microelectronics Corporation (UMC) is a semiconductor foundry that provides wafer manufacturing services in 8" and 12" Fabs, down to 12nm / FinFET. The firms has the majority of its production in Taiwan, but also fabs in China, Japan, Singapore. The firm focuses on mature nodes and is not engaged in the leading edge EUV manufacturing. The firm has a large number of specialty processes such as high voltage, image sensors, automotive.
| Income Statement Dec FY | 2025A | 2026E | 2027E | 2028E | Q1/26A | Q2/26E | Balance Sheet | 2025A | 2026E | 2027E | 2028E |
|---|---|---|---|---|---|---|---|---|---|---|---|
| Revenue | 237.6 | 271.5 | 342.4 | 428.5 | 61.0 | 66.3 | Cash | 110.7 | 168.0 | 216.5 | 291.3 |
| Cost of Goods Sold | 168.6 | 181.5 | 202.6 | 221.8 | 43.2 | 45.2 | Receivables | 33.7 | 48.1 | 61.5 | 74.8 |
| Gross Profit | 68.9 | 90.1 | 139.9 | 206.8 | 17.8 | 21.1 | Inventories | 37.2 | 40.1 | 51.2 | 62.4 |
| EBITDA | 103.2 | 127.4 | 177.3 | 243.6 | 27.3 | 30.7 | Investments | 75.9 | 87.3 | 87.3 | 87.3 |
| Depreciation | 59.3 | 64.6 | 68.7 | 72.3 | 16.0 | 16.2 | Fixed Assets | 271.4 | 254.2 | 258.3 | 274.6 |
| EBIT | 43.9 | 62.8 | 108.6 | 171.3 | 11.3 | 14.5 | Intangibles | 9.5 | 8.9 | 8.9 | 8.9 |
| Net Interest Income | 0.7 | 0.5 | 1.3 | 2.2 | 0.1 | 0.0 | Other Assets | 40.6 | 43.9 | 50.6 | 57.3 |
| Associates | 2.4 | 2.8 | 0.0 | 0.0 | 2.8 | 0.0 | Total Assets | 579.0 | 650.5 | 734.4 | 856.6 |
| Forex Gains / Losses | (0.6) | 0.3 | 0.0 | 0.0 | 0.3 | 0.0 | Payables | 47.9 | 80.2 | 102.5 | 124.7 |
| Other Pre-Tax Income | 3.2 | 4.2 | 0.0 | 0.9 | 2.2 | 2.0 | Short Term Debt | 27.6 | 32.2 | 33.1 | 35.2 |
| Pre-Tax Profit | 49.6 | 70.5 | 109.9 | 174.4 | 16.6 | 16.5 | Long Term Debt | 45.4 | 38.6 | 39.7 | 42.3 |
| Tax Expense | (8.1) | (9.1) | (17.6) | (27.9) | (0.5) | (2.6) | Other Liabilities | 78.2 | 80.0 | 83.8 | 87.6 |
| Net Profit | 41.5 | 61.4 | 92.3 | 146.5 | 16.1 | 13.9 | Total Liabilities | 199.1 | 231.0 | 259.2 | 289.9 |
| Minority Interests | 0.2 | 0.1 | 0.0 | 0.0 | 0.1 | 0.0 | Shareholders' Funds | 358.8 | 387.6 | 443.3 | 534.9 |
| Reported Earnings | 41.7 | 61.4 | 92.3 | 146.5 | 16.2 | 13.9 | Minority Interests | 0.1 | 0.0 | 0.0 | 0.0 |
| Adjusted Earnings | 41.7 | 61.4 | 92.3 | 146.5 | 16.2 | 13.9 | Other | 21.0 | 31.8 | 31.8 | 31.8 |
| Basic Shares Outstanding | 12.5 | 12.5 | 12.5 | 12.5 | 12.5 | 12.5 | Total S/H Equity | 379.9 | 419.5 | 475.2 | 566.8 |
| Diluted Shares Outstanding | 12.5 | 12.5 | 12.5 | 12.5 | 12.5 | 12.5 | Total Liab & S/H Funds | 579.0 | 650.5 | 734.4 | 856.6 |
| EPS (rep) [TWD] | 3.3 | 4.9 | 7.4 | 11.7 | 1.3 | 1.1 | Net Debt / Equity (%) | (9.9) | (23.2) | (30.2) | (37.7) |
| EPS (adj) [TWD] | 3.3 | 4.9 | 7.4 | 11.7 | 1.3 | 1.1 | Interest Cover (x) | NM | NM | NM | NM |
| Total DPS [TWD] | 2.9 | 2.6 | 2.9 | 4.4 | 0.0 | 0.0 | ROE (%) | 11.0 | 15.4 | 20.6 | 28.1 |
| ROA (%) | 7.6 | 10.2 | 15.7 | 21.5 | |||||||
| ROIC (%) | 10.6 | 16.0 | 28.3 | 43.4 | |||||||
| Ratio | 2025A | 2026E | 2027E | 2028E | Cash Flow Analysis | 2025A | 2026E | 2027E | 2028E | ||
| Revenue Growth (%) | 2.3 | 14.3 | 26.1 | 25.1 | - | - | |||||
| EBITDA Growth (%) | 3.4 | 23.4 | 39.2 | 37.4 | - | - | |||||
| EBIT Growth (%) | (14.8) | 42.8 | 73.0 | 57.8 | - | - | |||||
| EPS Growth (adj) (%) | (12.1) | 47.2 | 50.2 | 58.7 | - | - | |||||
| Gross Profit Margin (%) | 29.0 | 33.2 | 40.8 | 48.2 | - | - | |||||
| EBITDA Margin (%) | 43.4 | 46.9 | 51.8 | 56.8 | - | - | |||||
| EBIT Margin (%) | 18.5 | 23.1 | 31.7 | 40.0 | - | - | |||||
| Net Profit Margin (%) | 17.6 | 22.6 | 27.0 | 34.2 | - | - | |||||
| Payout Ratio (%) | 85.8 | 52.9 | 39.6 | 37.5 | - | - | |||||
| PE (rep) (x) | 45.2 | 30.7 | 20.4 | 12.9 | - | - | |||||
| PE (adj) (x) | 45.2 | 30.7 | 20.4 | 12.9 | - | - | |||||
| EV/EBITDA (x) | 17.5 | 14.2 | 10.4 | 7.6 | - | - | |||||
| EV/EBIT (x) | 39.8 | 28.2 | 17.0 | 10.8 | - | - | |||||
| Price/Book (x) | 5.0 | 4.5 | 4.0 | 3.3 | - | - | |||||
| Total Div Yield (%) | 1.9 | 1.7 | 1.9 | 2.9 | - | - |
Source: Company data, Macquarie Research Jul 2026
Established trailing-edge foundries in a solid position
Investment Thesis
We believe 2026 is a key inflection point for trailing-edge technology at foundries which will lead to at least a few years of utilisation rate growth, before stabilising at a high rate. Both supply and demand dynamics are driving up utilisation rates (and therefore profitability).
- Demand driven by: 1) an inventory correction in 2025, 2) increasing demand (including growing power content for AI-related capex), 3) the bifurcation of China and ex-China semiconductor markets, and 4) content and unit growth for AI edge devices (shift to higherend PC/smartphone and emerging growth in robotics and AR).
- Supply driven by: 1) Major players TSMC and Samsung are phasing out 8-inch and trailingedge to clear more room for leading-edge and advanced packaging, and 2) new capacity is expensive and non-competitive (benefitting established players).
Figure 1 - UMC quarterly UTR
Source: Company data, Macquarie Research, Jul 2026
Utilisation rates bottomed at high-60% in 2023/24, improved to 75% in 2025, and we believe are already at mid-80%. We expect utilisation rates to rise to near full over the next quarters. And, as in prior cycles, as utilisation rates reach high levels (and customers get concerned about acquiring capacity), ASP hikes should come from 2H26 (we expect a low-singledigit hike in 2026, and ~10% in 2027). All of this should help drive revenue growth/margin expansion. We believe this will likely lead to consensus earnings upgrades for 2027/28.
Figure 2 - UMC quarterly wafer ASP (12" equivalent)
We believe UMC will continue to focus on ROI (consistent with its major strategic shift from 2017), and rely on partnerships to grow into new areas (and more leading-edge nodes).
- Intel partnership on 12nm. UMC will contribute foundry services and 12nm process technology expertise to provide customers with US-based manufacturing. We expect this will move beyond 12nm.
- Hyperlight: In 1Q26, UMC signed an agreement for high-volume foundry production of Hyperlight's TFLN chiplet (both 6" and 8").
- UMC may also partner with memory IP suppliers to mass produce/sell NAND-like products.
We initiate coverage of UMC with an Outperform rating. Our target price of NT$258 is based on 22x 2028E P/E. We believe the high growth outlook over the next three years justifies our target multiple premium. Key risks are the semiconductor cycle, and UMC's ability to execute on its new projects.
Foundry Industry
Trailing-edge foundries should slow down market share bleed. Although we continue to expect leading-edge foundries' (specifically TSMC) growth to outpace trailing-edge over the next few years, we believe the steady increase in utilisation rates and ASP hikes at trailingedge foundries will slow that widening gap and benefit all key players during 2026-28. UMC's key advantages for trailing edge: 1) a lot of its capacity is already fully depreciated, 2) it has good geographic diversity within Asia (Taiwan/China/Japan/Singapore), and 3) it has the ability to migrate customers beyond 22nm (via Intel partnership).
Figure 3 - Quarterly foundry market share
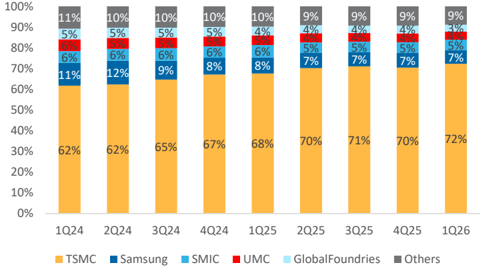
Source: Trendforce, Macquarie Research, Jul 2026
Figure 5 - GPM peers comparison
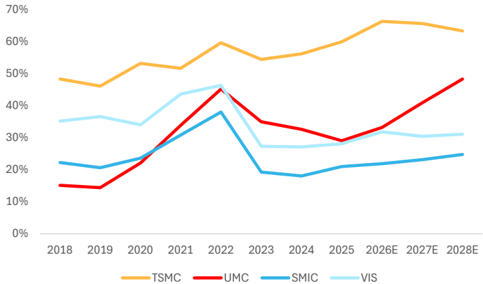
Source: Company data, Bloomberg, Macquarie Research, Jul 2026
Figure 7 - Global foundry players capex trend
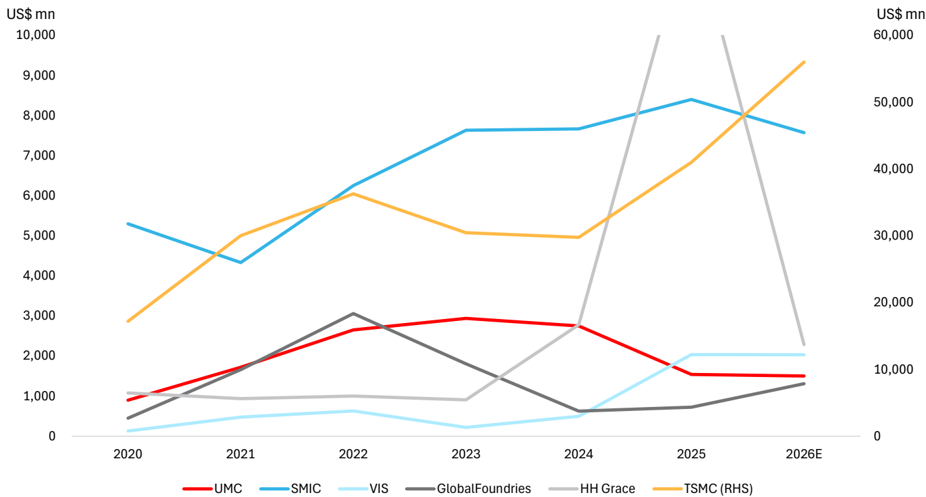
Source: Company data, Bloomberg, Macquarie Research, Jul 2026
Figure 4 - 2025 Foundry market share
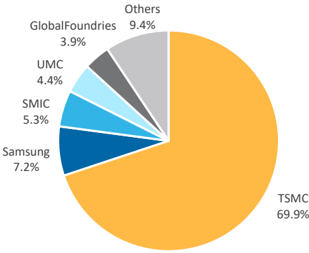
Source: Trendforce, Macquarie Research, Jul 2026
Figure 6 - OPM peers comparison
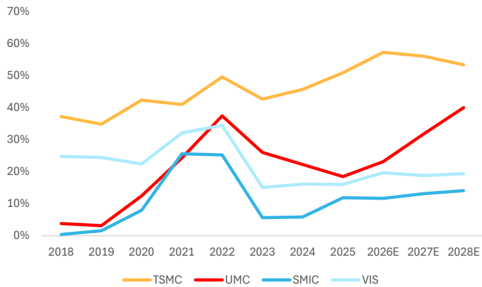
Source: Company data, Bloomberg, Macquarie Research, Jul 2026
UMC growth driven by ASP, utilisation rates and new business... not capacity expansion
Operations
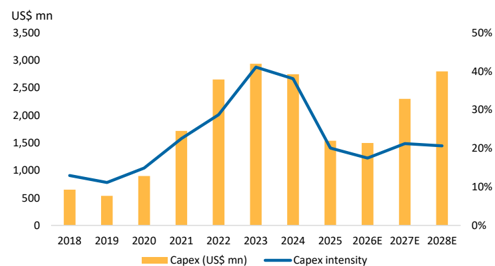
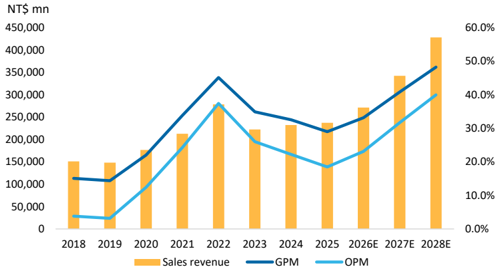
Up-cycle in trailing-edge foundry : UMC will continue its strategy to focus on ROI and not aggressive capacity expansion. We expect UMC to rely on partnerships to enter new areas (and more advanced nodes). Product mix should continue to improve (customers migrate to 22nm), and new ventures should start to contribute materially from 2027. GPM should be continued to expand through 2028E on: 1) higher utilisation rate, 2) ASP hikes, 3) product mix, and 4) new project contributions.
New businesses provide additional upside potential : In lieu of aggressive capex, UMC is entering partnerships to pursue other leading-edge/new technology avenues.
- Partnership with Intel on 12nm (announced in 1Q24): UMC will contribute its foundry services and 12nm process technology expertise to provide customers with US-based manufacturing. It enables UMC's existing customers the ability to migrate to 12nm as well as geographically diversify production to the US. For Intel, it enhances their ability to attract new foundry customers. We believe this partnership will move beyond 12nm. The company says it is still on track to deliver PDK and related IP in 2026, with revenue contribution in 2027 (initial application includes DTV, WiFi connectivity and high-speed interface ICs).
- Hyperlight: In 1Q26, UMC signed an agreement with Hyperlight for high-volume foundry production of their TFLN (Thin-Film Niobate) chiplet (both 6" and 8"). The TFLN optical products will have extremely high modulation bandwidth with low optical loss, enabling networking speeds of 1.6T and beyond while significantly reducing power consumption and laser requirements compared to traditional silicon photonics.
- UMC may also partner with memory IP suppliers to mass produce and sell NAND-like products to boost utilisation rates faster (UMC has not yet commented on this possibility).
- Advanced packaging : including 3D integration of RF SOI wafers for front-end modules UMC notes it will continue to develop with clients.
Figure 8 - UMC year-end quarterly capacity by fab (12" eq.)
| Fab | Wafer size | 2020 | 2021 | 2022 | 2023 | 2024 | 2025 | 2026E | 2027E | 2028E |
|---|---|---|---|---|---|---|---|---|---|---|
| WTK | 6" | 93 | 81 | 85 | 83 | 83 | 80 | 83 | 83 | 83 |
| 8A | 8" | 201 | 190 | 192 | 207 | 207 | 215 | 215 | 215 | 215 |
| 8C & D | 8" | 206 | 210 | 218 | 237 | 237 | 243 | 243 | 243 | 243 |
| 8E | 8" | 113 | 115 | 118 | 131 | 131 | 131 | 131 | 131 | 131 |
| 8F | 8" | 122 | 137 | 138 | 145 | 145 | 146 | 146 | 146 | 146 |
| 8N | 8" | 230 | 232 | 245 | 254 | 254 | 250 | 250 | 250 | 250 |
| 8S | 8" | 93 | 102 | 111 | 114 | 114 | 117 | 117 | 117 | 117 |
| 12A | 12" | 261 | 271 | 301 | 346 | 409 | 409 | 409 | 409 | 409 |
| 12A-1 | 12" | 261 | 271 | 301 | 305 | 305 | 305 | 305 | 305 | 305 |
| 12A-2 | 12" | 0 | 0 | 0 | 41 | 104 | 104 | 104 | 104 | 104 |
| 12i | 12" | 160 | 164 | 164 | 164 | 172 | 172 | 197 | 262 | 292 |
| 12i-1 | 12" | 160 | 164 | 164 | 164 | 172 | 172 | 172 | 172 | 172 |
| 12i-2 | 12" | 0 | 0 | 0 | 0 | 0 | 0 | 25 | 90 | 120 |
| 12X | 12" | 57 | 78 | 80 | 80 | 80 | 95 | 95 | 95 | 95 |
| 12M | 12" | 98 | 104 | 110 | 110 | 115 | 119 | 119 | 119 | 119 |
| Total | (12" eq.) | 1,028 | 1,075 | 1,130 | 1,204 | 1,280 | 1,305 | 1,331 | 1,396 | 1,426 |
Source: Company data, Macquarie research, Jul 2026
Figure 9 - Capex and Capex intensity
Source: Company data, Macquarie Research, Jul 2026
Expecting GPM expansion 2026-28
Financials
During the early stages of the semiconductor up cycle, UMC's revenues (2024/25) grew lowto mid-single-digits YoY, as most of the growth was AI-driven and on leading-edge nodes. However, we believe 2026 is a key inflection point for trailing-edge technology at foundries which will lead to at least a few years of fast-growing (and then stable higher) utilisation rates. Both supply and demand side dynamics are driving up utilisation rates (and therefore profitability).
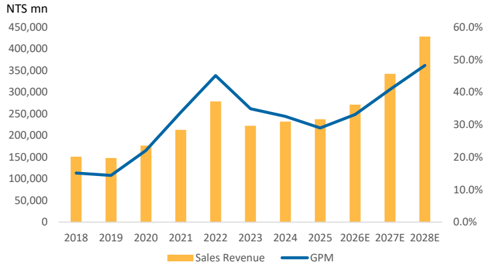
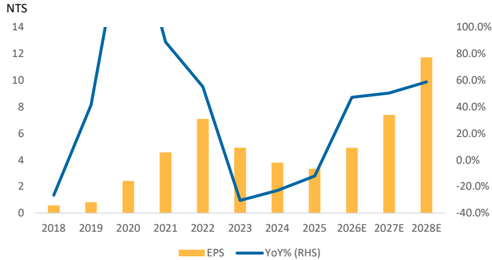
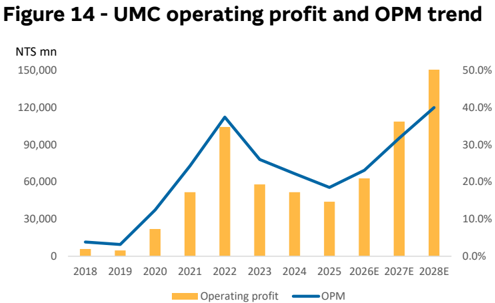
We forecast revenue to grow 14%/26%25% in 2026E/27E/28E and for GPM to jump 420/770/740bps on higher utilisation rates, higher ASPs, and better product mix. New businesses should also start to contribute materially from 2027.
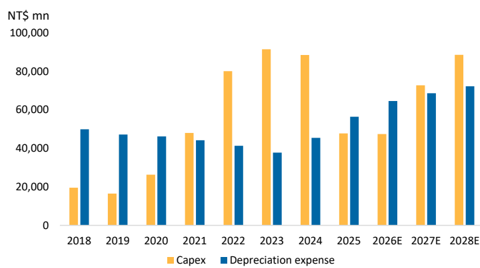
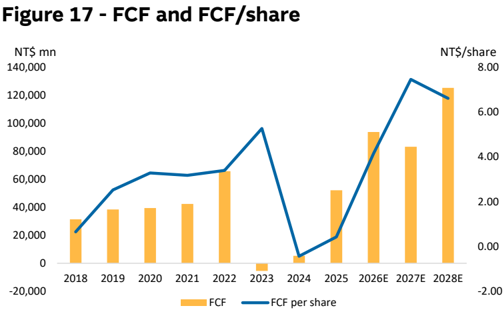
With moderate capex, increasing profitability, we expect cash to grow, and its dividend payout to remain at a 50%+ payout ratio. Non-op gains have also contributed positively especially into strong Taiwan tech markets (which continue in 2Q26, but also a risk in case of a semiconductor down cycle).
1Q26 earnings and 2Q26/2H26 guidance recap
- Revenue +5.5% YoY mainly from shipment increase (shipments up 3% QoQ with utilisation increasing slightly to 79% from 78%). Blended ASP was down slightly QoQ due to betterthan-expected 8-inch wafer shipment.
- EPS was up ~60% QoQ due to non-op investment gains (strong stock market performance).
- Expect strong wafer shipment growth across 8/12-inch in 2Q (wafer shipments up highsingle digits with utilisation up to low-80%).
- ASP up by low single digits QoQ from product mix improvement (more 22/28nm). GPM expected ~30%.
- 2H revenue to increase high-double digits HoH (higher utilisation rates and ASP hikes from 2H).
Figure 11 - UMC revenue, GM and OPM trend
Source: Company data, Macquarie Research, Jul 2026
Source: Company data, Macquarie Research, Jul 2026
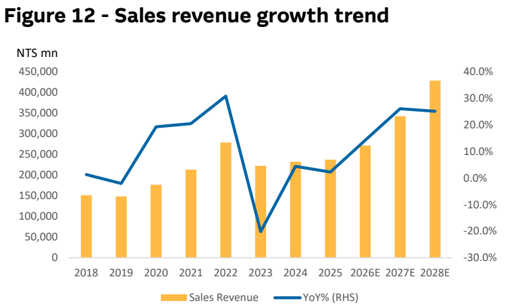
Figure 10 - Capex and dep. expense trend
Source: Company data, Macquarie Research, Jul 2026
Figure 13 - UMC sales revenue and GM trend
Source: Company data, Macquarie Research, Jul 2026
Figure 15 - UMC EPS growth trend
Source: Company data, Macquarie Research, Jul 2026
Source: Company data, Macquarie Research, Jul 2026
Source: Company data, Macquarie Research, Jul 2026
Figure 16 - R&D expense % in opex
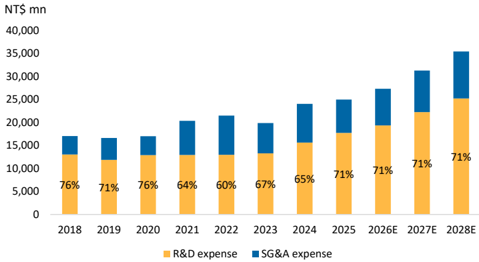
Source: Company data, Macquarie Research, Jul 2026
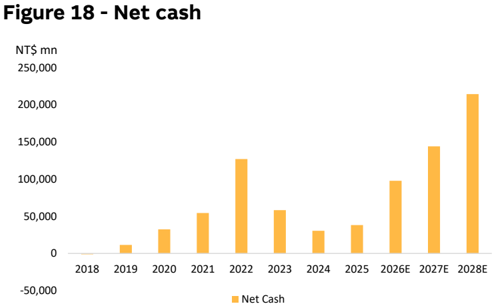
Source: Company data, Macquarie Research, Jul 2026
Figure 19 - Cash dividend and payout ratio
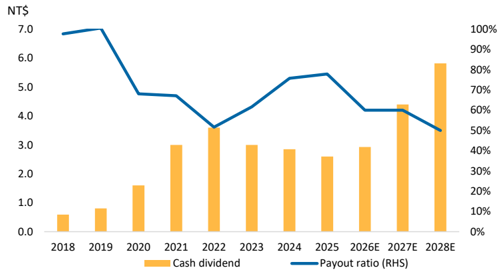
Source: Company data, Macquarie Research, Jul 2026
Figure 21 - UMC year-end capacity (12" equivalent)
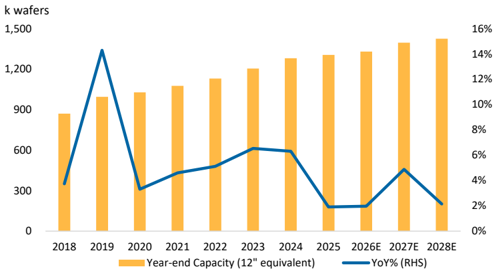
Source: Company data, Macquarie Research, Jul 2026
Figure 23 - UMC quarterly shipment (12" equivalent)
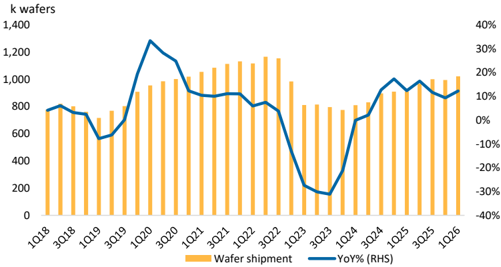
Source: Company data, Macquarie Research, Jul 2026
Figure 20 - Dividend peers comparison
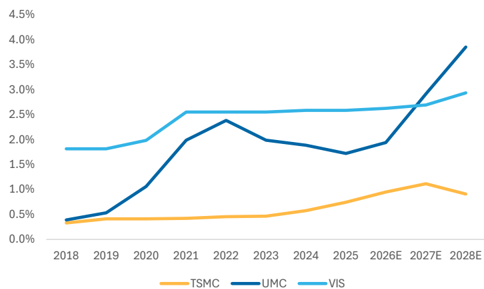
Source: Company data, Bloomberg, Macquarie Research, Jul 2026
Figure 22 - UMC annual shipment (12" equivalent)
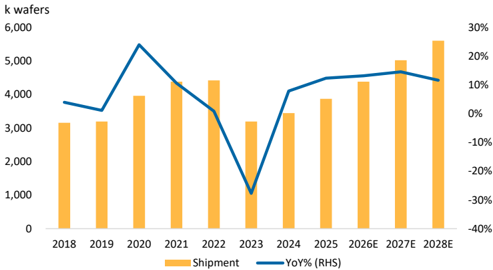
Source: Company data, Macquarie Research, Jul 2026
Figure 24 - UMC quarterly wafer ASP (12" equivalent)
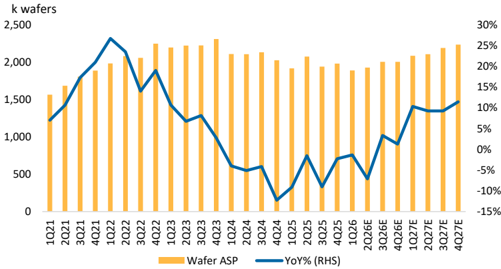
Source: Company data, Macquarie Research, Jul 2026
Figure 25 - UMC annual UTR
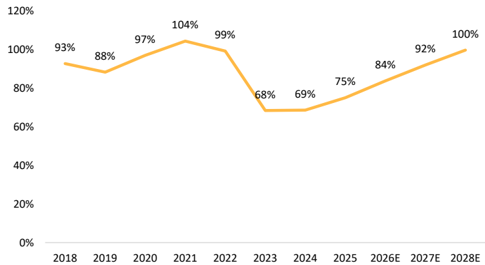
Source: Company data, Macquarie Research, Jul 2026
Figure 27 - UMC revenue by customer types
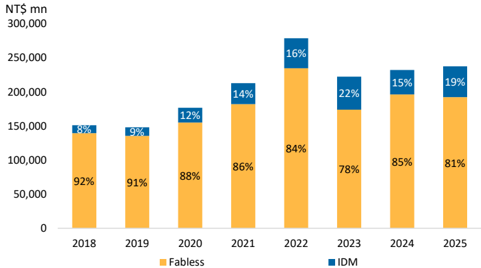
Source: Company data, Macquarie Research, Jul 2026
Figure 29 - UMC revenue by applications
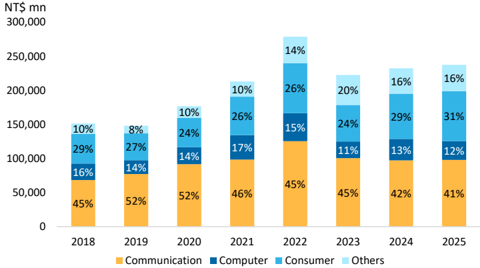
Source: Company data, Macquarie Research, Jul 2026
Figure 26 - UMC revenue by nodes
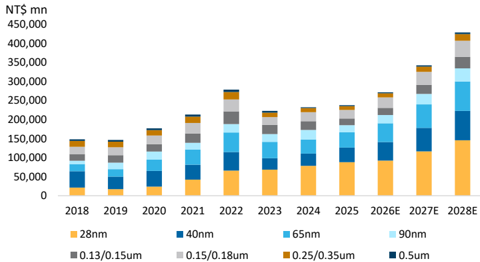
Source: Company data, Macquarie Research, Jul 2026
Figure 28 - UMC revenue by region
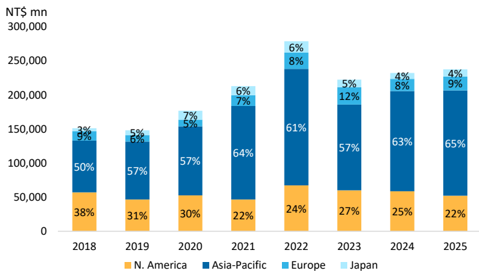
Source: Company data, Macquarie Research, Jul 2026
Figure 30 - UMC P&L
| (NT$m) | 1Q25 | 2Q25 | 3Q25 | 4Q25 | 1Q26 | 2Q26E | 3Q26E | 4Q26E | 2024 | 2025 | 2026E | 2027E | 2028E |
|---|---|---|---|---|---|---|---|---|---|---|---|---|---|
| Net Sales | 57,859 | 58,758 | 59,127 | 61,810 | 61,038 | 66,305 | 71,026 | 73,157 | 232,303 | 237,553 | 271,527 | 342,444 | 428,533 |
| Gross profit | 15,447 | 16,878 | 17,623 | 18,958 | 17,818 | 21,110 | 25,029 | 26,103 | 75,654 | 68,906 | 90,060 | 139,871 | 206,755 |
| Op income | 9,786 | 10,820 | 11,118 | 12,225 | 11,276 | 14,479 | 17,997 | 19,007 | 51,613 | 43,949 | 62,760 | 108,602 | 171,327 |
| Pretax income | 9,347 | 10,154 | 14,644 | 15,503 | 16,644 | 16,497 | 18,218 | 19,173 | 56,220 | 49,648 | 70,532 | 109,878 | 174,403 |
| Net income | 7,777 | 8,903 | 14,982 | 10,055 | 16,171 | 13,858 | 15,303 | 16,106 | 47,211 | 41,716 | 61,438 | 92,298 | 146,499 |
| EPS (NT$) | 0.62 | 0.71 | 1.20 | 0.81 | 1.29 | 1.11 | 1.23 | 1.29 | 3.80 | 3.34 | 4.91 | 7.39 | 11.73 |
| Profitability | |||||||||||||
| Gross Margin | 26.7% | 28.7% | 29.8% | 30.7% | 29.2% | 31.8% | 35.2% | 35.7% | 32.6% | 29.0% | 33.2% | 40.8% | 48.2% |
| Operating Margin | 16.9% | 18.4% | 18.8% | 19.8% | 18.5% | 21.8% | 25.3% | 26.0% | 22.2% | 18.5% | 23.1% | 31.7% | 40.0% |
| Pretax Margin | 16.2% | 17.3% | 24.8% | 25.1% | 27.3% | 24.9% | 25.6% | 26.2% | 24.2% | 20.9% | 26.0% | 32.1% | 40.7% |
| Net Margin | 13.4% | 15.2% | 25.3% | 16.3% | 26.5% | 20.9% | 21.5% | 22.0% | 20.3% | 17.6% | 22.6% | 27.0% | 34.2% |
| Sequential Growth | |||||||||||||
| Net Sales | -4.2% | 1.6% | 0.6% | 4.5% | -1.2% | 8.6% | 7.1% | 3.0% | |||||
| Gross profit | -15.8% | 9.3% | 4.4% | 7.6% | -6.0% | 18.5% | 18.6% | 4.3% | |||||
| Op income | -18.2% | 10.6% | 2.8% | 10.0% | -7.8% | 28.4% | 24.3% | 5.6% | |||||
| Pretax income | -11.1% | 8.6% | 44.2% | 5.9% | 7.4% | -0.9% | 10.4% | 5.2% | |||||
| Net income | -8.5% | 14.5% | 68.3% | -32.9% | 60.8% | -14.3% | 10.4% | 5.2% | |||||
| EPS | -8.8% | 14.5% | 69.0% | -32.5% | 59.3% | -14.0% | 10.4% | 5.2% | |||||
| YoY Growth | |||||||||||||
| Net Sales | 5.9% | 3.4% | -2.2% | 2.4% | 5.5% | 12.8% | 20.1% | 18.4% | 4.4% | 2.3% | 14.3% | 26.1% | 25.1% |
| Gross profit | -8.6% | -15.5% | -13.7% | 3.4% | 15.4% | 25.1% | 42.0% | 37.7% | -2.7% | -8.9% | 30.7% | 55.3% | 47.8% |
| Op income | -16.1% | -22.1% | -21.1% | 2.2% | 15.2% | 33.8% | 61.9% | 55.5% | -10.8% | -14.8% | 42.8% | 73.0% | 57.8% |
| Pretax income | -26.5% | -38.2% | -11.6% | 47.4% | 78.1% | 62.5% | 24.4% | 23.7% | -20.7% | -11.7% | 42.1% | 55.8% | 58.7% |
| Net income | -25.6% | -35.4% | 3.5% | 18.3% | 107.9% | 55.7% | 2.1% | 60.2% | -22.6% | -11.6% | 47.3% | 50.2% | 58.7% |
| EPS | -26.2% | -36.0% | 3.4% | 19.1% | 108.1% | 56.3% | 2.1% | 59.2% | -22.9% | -12.1% | 47.1% | 50.4% | 58.7% |
| Source: Company data, Macquarie Research, Jul 2026 | Source: Company data, Macquarie Research, Jul 2026 | Source: Company data, Macquarie Research, Jul 2026 | Source: Company data, Macquarie Research, Jul 2026 | Source: Company data, Macquarie Research, Jul 2026 |
Figure 31 - UMC annual balance sheet
| NT$ mn | 2021A | 2022A | 2023A | 2024A | 2025A | 2026E | 2027E | 2028E |
|---|---|---|---|---|---|---|---|---|
| Cash & cash equivalents | 132,622 | 173,819 | 132,554 | 105,000 | 110,660 | 167,972 | 216,483 | 291,325 |
| Receivables | 36,048 | 38,783 | 32,293 | 34,995 | 33,731 | 48,103 | 61,499 | 74,824 |
| Inventories | 23,011 | 31,070 | 35,713 | 35,782 | 37,228 | 40,086 | 51,249 | 62,353 |
| Other current assets | 41,592 | 8,699 | 16,238 | 13,900 | 23,163 | 24,580 | 31,277 | 37,940 |
| Current asset | 233,273 | 252,371 | 216,797 | 189,678 | 204,783 | 280,741 | 360,507 | 466,442 |
| Net fixed assets | 107,086 | 115,618 | 156,765 | 234,291 | 244,429 | 228,001 | 232,090 | 248,372 |
| LT investment | 72,547 | 64,847 | 74,032 | 72,487 | 75,373 | 86,812 | 86,812 | 86,812 |
| Other non-current assets | 51,521 | 100,215 | 111,593 | 73,744 | 54,411 | 54,994 | 54,994 | 54,994 |
| Non-current assets | 231,153 | 280,681 | 342,390 | 380,523 | 374,213 | 369,807 | 373,896 | 390,178 |
| Total assets | 464,427 | 533,052 | 559,187 | 570,201 | 578,996 | 650,548 | 734,403 | 856,620 |
| ST borrowings | 39,256 | 7,587 | 29,537 | 19,510 | 27,597 | 32,183 | 33,105 | 35,244 |
| Payables | 43,480 | 62,879 | 56,663 | 45,361 | 47,936 | 80,172 | 102,498 | 124,706 |
| Other current liabilities | 22,718 | 38,099 | 12,814 | 10,389 | 12,066 | 13,629 | 17,425 | 21,200 |
| Current liabilities | 105,454 | 108,565 | 99,015 | 75,260 | 87,598 | 125,984 | 153,027 | 181,151 |
| LT borrowings | 39,830 | 39,877 | 45,236 | 55,533 | 45,372 | 38,619 | 39,726 | 42,293 |
| Other non-current liabilities | 37,941 | 49,159 | 55,358 | 61,222 | 66,170 | 66,419 | 66,419 | 66,419 |
| Non-current liabilities | 77,770 | 89,036 | 100,594 | 116,755 | 111,542 | 105,039 | 106,145 | 108,712 |
| Total liabilities | 183,224 | 197,601 | 199,608 | 192,016 | 199,141 | 231,023 | 259,173 | 289,863 |
| Share capital | 124,832 | 125,047 | 125,298 | 125,607 | 125,882 | 125,785 | 125,785 | 125,785 |
| Reserves & retained earnings | 115,376 | 202,247 | 217,053 | 226,849 | 232,883 | 261,844 | 317,549 | 409,075 |
| Minority | 223 | 344 | 341 | 257 | 87 | 36 | 36 | 36 |
| Other equity | 40,771 | 7,813 | 16,886 | 25,473 | 21,004 | 31,861 | 31,861 | 31,861 |
| Total shareholder's equity | 281,203 | 335,451 | 359,579 | 378,185 | 379,855 | 419,525 | 475,231 | 566,757 |
| Total liabilities & shareholder's equity | 464,427 | 533,052 | 559,187 | 570,201 | 578,996 | 650,548 | 734,403 | 856,620 |
Source: Company data, Macquarie research, Jul 2026
Figure 32 - UMC annual cash flow statement
| NT$ mn | 2021A | 2022A | 2023A | 2024A | 2025A | 2026E | 2027E | 2028E |
|---|---|---|---|---|---|---|---|---|
| Operating cash flow | 90,352 | 145,861 | 86,000 | 93,872 | 99,864 | 141,142 | 155,823 | 213,673 |
| Capital expenditure | (48,035) | (80,128) | (91,474) | (88,544) | (47,745) | (47,445) | (72,749) | (88,564) |
| Other investing cash flow | (14,129) | 25,700 | (6,313) | 2,602 | (5,410) | 26,024 | 0 | 0 |
| Investing cashflow | (62,163) | (54,427) | (97,787) | (85,941) | (53,154) | (21,421) | (72,749) | (88,564) |
| Dividends paid | (19,871) | (37,445) | (45,015) | (37,586) | (35,784) | (32,477) | (36,592) | (54,973) |
| Other financing cashflow | 32,361 | (19,809) | 15,929 | (1,614) | (3,419) | (29,932) | 2,029 | 4,706 |
| Financing cashflow | 12,490 | (57,255) | (29,086) | (39,200) | (39,204) | (62,409) | (34,563) | (50,267) |
| FX exchange | (2,105) | 7,018 | (392) | 3,715 | (1,846) | 0 | 0 | 0 |
| Net change in cash | 38,574 | 41,197 | (41,265) | (27,553) | 5,660 | 57,311 | 48,511 | 74,842 |
Source: Company data, Macquarie research, Jul 2026
Valuation
Our target price of NT$258 is based on 22x 2028E P/E. Its historical average P/E is 15x (trailing) and 13x (forward). We use a higher-than-historical-average multiple due to expectation of a longer, sustainable up-cycle (higher growth), with new projects also likely to expand margins.
Price to book is also trading above its historical levels. We believe this is reasonable given the value of its capacity (taking into account a lot of its capacity has already been depreciated, and the much higher replacement costs for equipment now).
We also expect the current semiconductor cycle could be abnormally long (started ~mid-2023 and we expect it to last until at least 2029), but also starting from 2026, expect trailing-edge capacity (including 8") to see strong utilisation momentum (2026-27) and the ability to maintain a high utilisation rate (throughout 2028). We have also seen, during times of foundry shortages, that foundry companies can maintain over 100% utilisation rates for several quarters.
Figure 33 - Macquarie estimates vs. BBG consensus table
| 2026E | 2026E | 2026E | 2027E | 2027E | 2027E | 2028E | 2028E | 2028E | |
|---|---|---|---|---|---|---|---|---|---|
| NT$mn | MQe | BBGe | Diff % | MQe | BBGe | Diff % | MQe | BBGe | Diff % |
| Revenue | 271,527 | 275,627 | -1.5% | 342,444 | 348,509 | -1.7% | 428,533 | 419,735 | 2.1% |
| Gross profit | 90,060 | 83,609 | 7.7% | 139,871 | 120,187 | 16.4% | 206,755 | 170,123 | 21.5% |
| GM% | 33.2% | 30.3% | 40.8% | 34.5% | 48.2% | 40.5% | |||
| Operating profit | 62,760 | 57,615 | 8.9% | 108,602 | 98,014 | 10.8% | 171,327 | 132,900 | 28.9% |
| OPM % | 23.1% | 20.9% | 31.7% | 28.1% | 40.0% | 31.7% | |||
| Pretax income | 70,532 | 66,763 | 5.6% | 109,878 | 102,388 | 7.3% | 174,403 | 138,302 | 26.1% |
| Net income | 61,438 | 57,556 | 6.7% | 92,298 | 81,769 | 12.9% | 146,499 | 108,461 | 35.1% |
| EPS (NT$) | 4.91 | 4.63 | 6.2% | 7.39 | 6.32 | 16.9% | 11.73 | 9.01 | 30.2% |
Source: Company, Bloomberg, Macquarie Research, Jul 2026
Figure 34 - 12-month forward PE bands
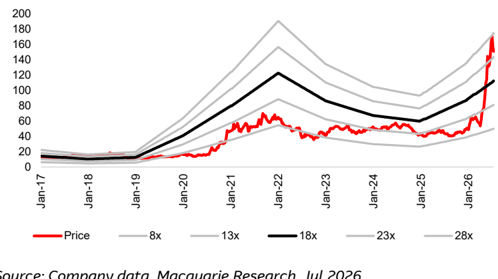
Source: Company data, Macquarie Research, Jul 2026
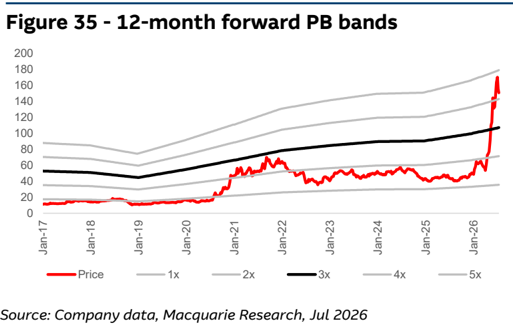
Key Risks
- We expect the semiconductor cycle (driven by AI capex) to continue at least through 2028. A earlier peak and down-cycle would negatively impact our forecasts.
- A quick trailing-edge foundry up-cycle, where utilisation rates peak in 2H26 or early 2027 could also impact UMC's ability to maintain high utilisation rates.
- Failure to achieve meaningful revenue in any of its joint venture projects.
- Higher-than-expected costs/inflation that can't be offset by ASP hikes.
- Non-operating income could be at risk in a falling market (has benefitted from the strong markets over the last several quarters).
Key Quant Findings
The quant model currently holds a marginally positive view on United Microelectronics Corp.. The strongest style exposure is Price Momentum, indicating this stock has had strong medium to long term returns which often persist into the future. The weakest style exposure is Profitability, indicating this stock is not efficiently converting investments to earnings; proxied by ratios like ROE or ROA.
Macquarie Alpha Model: Key rankings
The Macquarie Quant's flagship Alpha model is a dynamic multi-factor model based on a staple of quant factors such as value, momentum, revisions, quality, and risk.
| Global | Market (Country) | Sector | |
|---|---|---|---|
| Whole Universe | Taiwan | Semiconductors & Semiconductor Equip. | |
| Macquarie Alpha Model | 7570/17995 | 421/978 | 285/668 |
| Fundamental (Consensus) * | 8395/17995 | 274/978 | 331/668 |
- based on Total Shareholder Return = Consensus Price target / Current Price
Current and Historical Alpha Model Rank
The chart shows the Macquarie Alpha model market ranking against the company's peers and over recent history.
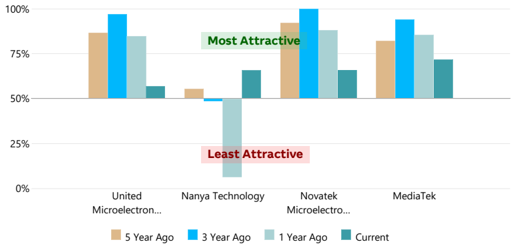
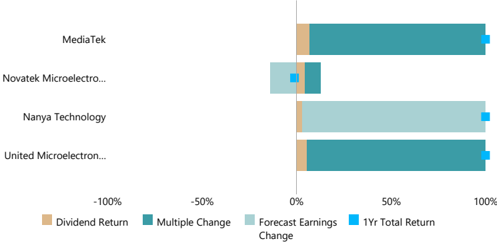
Drivers of Stock Return
Breakdown of 1-year total return (local currency) into returns from dividends, changes in forward earnings estimates and the resulting change in earnings multiple.
Alpha Model Decomposition
The Macquarie Alpha is decomposed into its sector and market relative factor & styles exposures (a higher/better percentile is coded in green, whilst lower in red).
| Percentile relative to | Percentile relative to | ||
|---|---|---|---|
| Factors / Styles | sectors (/668) | market (/978) | Core factors in definition |
| ALPHA | 57% | 57% | Built from the styles below |
| VALUE | 50% | 8% | Book, CF, Yield, Earnings Multiples |
| ANALYST | 52% | 75% | Revisions (Earnings, Recommendations) |
| MOMENTUM | 84% | 95% | Price Momentum |
| GROWTH | 24% | 31% | EPS, Sales (Forecast, Historic) |
| PROFITABILITY | 38% | 70% | ROE, Margin, Asset Turnover |
| QUALITY | 76% | 85% | Accruals, Earn Stability, Cash Conversion |
| CAPITAL | 86% | 52% | Investment/Capex, Net share issuance |
| LIQUIDITY | 33% | 44% | Size, Turnover, Analyst Coverage |
| LOW RISK | 37% | 20% | Beta, Volatility, Earn.Cert, Leverage |
| TECHNICAL | 92% | 96% | MACD, RSI, Bollinger, Williams R, etc |
Factors driving the Alpha Model vs peers
For the comparable firms this chart shows the key underlying styles and their contribution to the current overall raw Alpha score.
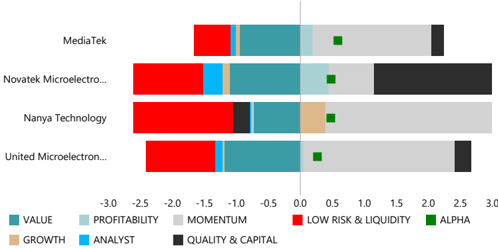
Macquarie Style Returns over last year
Recent performance to Macquarie style factors
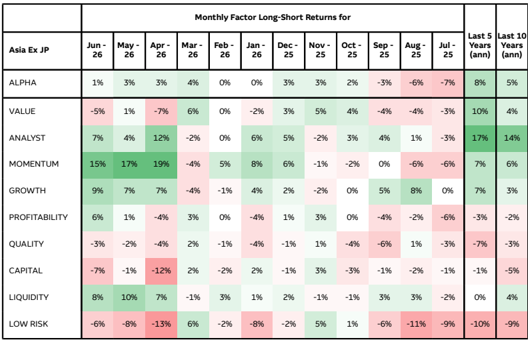
| Monthly Factor Long-Short Returns for | Monthly Factor Long-Short Returns for | Monthly Factor Long-Short Returns for | Monthly Factor Long-Short Returns for | Monthly Factor Long-Short Returns for | Monthly Factor Long-Short Returns for | Monthly Factor Long-Short Returns for | Monthly Factor Long-Short Returns for | Monthly Factor Long-Short Returns for | Monthly Factor Long-Short Returns for | Monthly Factor Long-Short Returns for | Monthly Factor Long-Short Returns for | |||
|---|---|---|---|---|---|---|---|---|---|---|---|---|---|---|
| Asia Ex JP | Jun - 26 | May - 26 | Apr - 26 | Mar - 26 | Feb - 26 | Jan - 26 | Dec - 25 | Nov - 25 | Oct - 25 | Sep - 25 | Aug - 25 | Jul - 25 | Last 5 Years (ann) | Last 10 Years (ann) |
| ALPHA | 1% | 3% | 3% | 4% | 0% | 0% | 3% | 3% | 2% | -3% | -6% | -7% | 8% | 5% |
| VALUE | -5% | 1% | -7% | 6% | 0% | -2% | 3% | 5% | 4% | -4% | -4% | -3% | 10% | 4% |
| ANALYST | 7% | 4% | 12% | -2% | 0% | 6% | 5% | -2% | 3% | 4% | 1% | -3% | 17% | 14% |
| MOMENTUM | 15% | 17% | 19% | -4% | 5% | 8% | 6% | -1% | -2% | 0% | -6% | -6% | 7% | 6% |
| GROWTH | 9% | 7% | 7% | -4% | -1% | 4% | 2% | -2% | 0% | 5% | 8% | 0% | 7% | 3% |
| PROFITABILITY | 6% | 1% | -4% | 3% | 0% | -4% | 1% | 3% | 0% | -4% | -2% | -6% | -3% | -2% |
| QUALITY | -3% | -2% | -4% | 2% | -1% | -4% | -1% | 1% | -4% | -6% | 1% | -3% | -7% | -3% |
| CAPITAL | -7% | -1% | -12% | 2% | -2% | 2% | -1% | 3% | -3% | -1% | -2% | -1% | -1% | -5% |
| LIQUIDITY | 8% | 10% | 7% | -1% | 3% | 1% | 2% | -1% | -1% | 3% | 3% | -2% | 0% | 4% |
| LOW RISK | -6% | -8% | -13% | 6% | -2% | -8% | -2% | 5% | 1% | -6% | -11% | -9% | -10% | -9% |
Source (all charts): FactSet, Refinitiv, and Macquarie Quant. For more details on the Macquarie Alpha model or for more customised analysis and screens, please contact the Macquarie Global Quantitative Team: maccapequitiesresearchquantglobal@macquarie.com. Explanation for items on this page can be found at https://www.macquarieinsights.com/rp/d/r/p/OTUyMzg1
Analysts
Jeffrey Ohlweiler
+8862 2734 7512
jeffrey.ohlweiler@macquarie.com
Macquarie Capital Limited, Taiwan Securities Branch