PDF 原檔:報告_MS_金居8358_3Q26前瞻_20261104_original.pdf
圖片清單(已驗證 2026-11-07)
驗證日 2026-11-07。無 ≥40KB 候選;以下為全部抽出圖(皆 <40KB,逐張檢視)。
| 檔名 | 分類 | 親眼所見內容 |
|---|---|---|
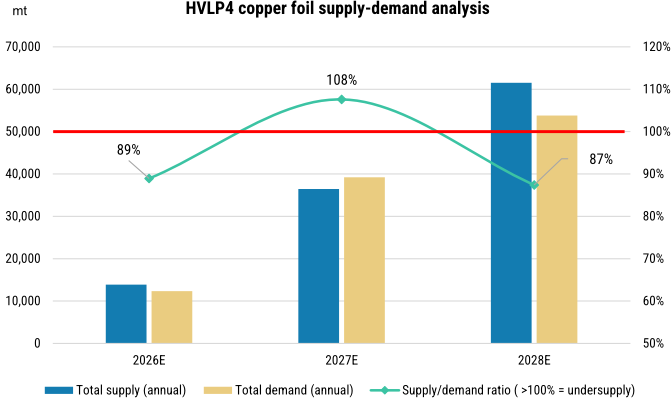
| 報告_MS_金居8358_3Q26前瞻_20261104_001.png | 真資料圖 | 「HVLP4 copper foil supply-demand analysis」:2026E/27E/28E 三組年度總供給(藍)與總需求(黃)長條,約 14k/12.5k、36.5k/39k、61k/54k mt,折線為比值 89%/108%/87%,紅線 100%,圖例標註「>100% = undersupply」(比值實為需求÷供給) |
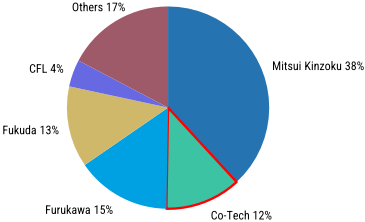
| 報告_MS_金居8358_3Q26前瞻_20261104_002.png | 真資料圖 | 2026E 全球 HVLP4 銅箔供應商產能占比圓餅:三井金屬 38%、古河 15%、福田 13%、金居 12%(紅框)、CFL 4%、其他 17% |
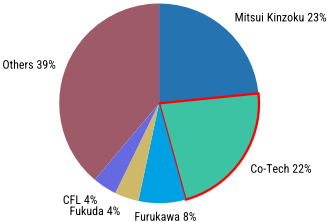
| 報告_MS_金居8358_3Q26前瞻_20261104_003.png | 真資料圖 | 2028E 同型圓餅:三井金屬 23%、金居 22%(紅框)、古河 8%、福田 4%、CFL 4%、其他 39% |
| 報告_MS_金居8358_3Q26前瞻_20261104_004.png | 真資料圖(估值,不嵌 lib) | 金居 PE Band:2023/01~2026 本益比走勢,平均 20.1x、+1SD 27.8x、−1SD 12.4x,最新約 21x |
| 報告_MS_金居8358_3Q26前瞻_20261104_005.png | 真資料圖(股價,不嵌 lib) | Risk Reward Chart:現價 NT$376,目標價 745(+98.14%)、Bull 1,225、Bear 305 |
| 報告_MS_金居8358_3Q26前瞻_20261104_006.png | 文字卡 | 共識評等分布:Overweight 75%、Equal-weight 25%、Underweight 0% |
| 報告_MS_金居8358_3Q26前瞻_20261104_007.png | 真資料圖(估值,不嵌 lib) | FY2027e MS 預估 vs 共識區間:營收 16,830(區間 15,849–22,259)、EBIT 5,971、淨利 4,814、EPS 19.01(區間 18.59–26.51,共識均值 23.39) |
| 報告_MS_金居8358_3Q26前瞻_20261104_008.png | 真資料圖(股價,不嵌 lib) | 股價走勢圖,右上標 O/I 與目標價階梯 730,股價約 380 |
原始內容
| Morgan Stanley Taiwan Limited+ Irene Yen Equity Analyst I ene.Yen@mo ganstanley.com | +886 2 2730-2869 |
|---|---|
| Howard Kao Equity Analyst Howa d.Kao@mo ganstanley.com | +886 2 2730-2989 |
| Morgan Stanley Asia Limited+ Andy Meng, CFA Equity Analyst Andy.Meng@mo ganstanley.com | +852 2239-7689 |
| Rachel L Zhang Equity Analyst Rachel.Zhang@mo ganstanley.com | +852 2239-1520 |
Morgan Stanley appreciates your support in the 2027 Extel Asia Research Survey. Voting opens 10 Novem er 2026.
Co-Tech Development Corp. (8358.TW , 8358 TT)
Greater China Technology Hardware | Taiwan
| Stock Rating | Overweight |
|---|---|
| ndustry View | n-Line |
| Price target | NT$745.00 |
| Up/downside to price target (%) | 9 |
| Shr price, close (Nov 3, 2026) | NT$376.00 |
| 52-Week Range | NT$75 .00-211.00 |
| Sh out, dil, curr (mn) | 252 |
| Mkt cap, curr (mn) | NT$94,593 |
| EV, curr (mn) | NT$94,259 |
| Avg daily trading value (mn) | NT$5,6 |
| Fiscal Year Endin | 12/25 | 12/26e | 12/27e | 12/28e |
|---|---|---|---|---|
| EPS (NT$)** | 4.20 | 9.62 | 19.01 | 35.43 |
| Prior EPS (NT$)** | - | 9.34 | 1 .59 | 31.63 |
| EPS (NT$)§ | - | 10.13 | 23.39 | 37.10 |
| Revenue, net (NT$ mn) | 7, 0 | 11,579 | 16, 30 | 26,651 |
| EBITDA (NT$ mn) | 1,53 | 3,115 | 6,069 | 11,274 |
| ModelWare net inc (NT | 1,063 | 2,436 | 4, 14 | ,972 |
| $ mn) | ||||
| P/E | 66.0 | 39.1 | 19. | 10.6 |
| P/BV | 9.3 | 10.1 | 7.3 | 4. |
| RNOA (%) | 19.4 | 33.7 | 54.6 | 2.9 |
| ROE (%) | 16.3 | 32.4 | 50.9 | 6 .4 |
| EV/EBITDA | 45.4 | 30.1 | 15.2 | 7.9 |
| Div yld (%) | 0.5 | 0.5 | 1.2 | 2.4 |
Unless otherwise noted, all metrics are based on Morgan Stanley ModelWare framework
- ** = Based on consensus methodology
- § = Consensus data is provided by Refinitiv Estimates
- e = Morgan Stanley Research estimates
Morgan Stanley does and seeks to do business with companies covered in Morgan Stanley Research. As a result, investors should be aware that the firm may have a conflict of interest that could affect the objectivity of Morgan Stanley Research. Investors should consider Morgan Stanley Research as only a single factor in making their investment decision.
For analyst certification and other important disclosures, refer to the Disclosure Section, located at the end of this report.
= Analysts employed by non-U.S. affiliates are not registered with FINRA, may not be associated persons of the member and may not be subject to FINRA restrictions on communications with a subject company, public appearances and trading securities held by a research analyst account.
M Idea November 4, 2026 07:00 AM GMT
Co-Tech Development Corp. | Asia Pacific
3Q26 Results Preview
| What's Changed Co-Tech Development Corp. (8358.TWO) | From | To |
|---|---|---|
| Price Target | NT$730.00 | NT$745.00 |
3Q preliminary revenue came in above our estimate, but we lower our 3Q GM forecast to factor in the higher production costs and copper pricing 4Q GM should improve meaningfully sequentially We raise our price target and stay OW
3Q preview: Co-Tech is scheduled to report its 3Q results on November 6. We estimate 3Q revenue at NT$3,169mn +13% q/q, +60% y/y), primarily driven by higher copper prices and product-mix shifts. We lower our 3Q GM estimate from 28.2% to 27.0% -30bps q/q, +650bps y/y), reflecting the impact of higher production costs and copper prices during the quarter. Co-Tech has already reported preliminary monthly profits for August and September at the request of the TWSE report link); combined August and September net profit now accounts for approximately 67% of our 3Q estimate. We estimate 3Q net profit at NT$610mn +12% q/q, +141% y/y), implying EPS of NT$2.41.
4Q GM should improve sequentially: We expect 4Q revenue to decline slightly q/q to NT$3,074mn -3% q/q, +42% y/y), primarily due to the end of production for lowend HTE copper foil and the lack of new capacity coming online. However, we expect Co-Tech's GM to expand 700bps q/q to 34%, driven by an improved product mix, a ~10% processing-fee increase effective from 4Q onward, and lower electricity rates compared with 2Q-3Q, when summer electricity rates were in effect. We forecast 4Q EPS of NT$3.02 +25% q/q, +102% y/y). For CY26, we estimate revenue will increase approximately 47% y/y to NT$11.6bn, with GM expanding 760bps y/y to 29.3%, implying EPS of NT$9.62 +129% y/y).
Potential processin -fee hike: Our supply-chain checks suggest that a key competitor may announce processing-fee increases as early as December. If so, we expect Co-Tech to follow with a price increase as well.
Upward revisions to our capacity assumptions (Exhibit 3): Co-Tech has announced plans to expand its greenfield capacity in Malaysia report link). The Malaysian expansion will be implemented in two phases, adding approximately 20k tons of annual HVLP3/4 capacity from late 2028 onward. RG-series capacity is also expected to increase modestly through the conversion of older HTE production lines.
Raised PT to NT$745; stay OW: The increase in our price target is driven by our earnings estimate changes for CY26-28. Our new price target implies 21x CY28 P/E and the stock currently trades at only 12x CY28 P/E. We also find the valuation attractive compared to its past 3Y P/E average of ~20x.
M Idea
AlphaSignals Earnings Preview
Focus KPI
Focus KPI Surprise Likely impact to consensus EPS*
Co-Tech Development Corp. 8358.TWO
3Q gross margin Likely downside surprise Largely unchanged
- ·We expect Co-Tech to report 3Q GM at ~27%, down 30bps q/q.
- ·The sequentially lower gross margin should be owing to higher production costs and copper prices during the quarter.
*Likely impact to consensus EPS is for the next 12 months
Source: Company data, Morgan Stanley Research M Idea
3Q26 Results Preview
Exhibit 1: 3Q26 esults p eview
| NT$mn | 3Q26E Results Preview - MSe | 3Q26E Results Preview - QoQ | 3Q26E Results Preview - YoY | Cons | Variance |
|---|---|---|---|---|---|
| Net sales | 3,169 | 13% | 60% | 3,155 | 0% |
| COGS | -2,312 | 14% | 47% | -2,266 | 2% |
| Gross profit | 857 | 12% | 110% | 889 | -4% |
| Operating expenses | -107 | 28% | 51% | -91 | 18% |
| Operating income | 750 | 10% | 123% | 798 | -6% |
| Non-operating income | 12 | 239% | NM | -9 | NM |
| Pre-tax income | 762 | 11% | 142% | 789 | -3% |
| Income tax | -152 | 6% | 146% | -156 | -2% |
| Net income | 610 | 12% | 141% | 633 | -4% |
| EPS (NT$) | 2.41 | 12% | 141% | 2.51 | -4% |
| Margins (%) | ppt | ppt | ppt | ||
| Gross margin | 27.0% | -0.3 | 6.5 | 28.2% | -1.1 |
| Operating margin | 23.7% | -0.7 | 6.7 | 25.3% | -1.6 |
| Pre-tax margin | 24.1% | -0.5 | 8.2 | 25.0% | -1.0 |
| Net margin | 19.2% | -0.2 | 6.5 | 20.1% | -0.8 |
Sou ce: Company data, Mo gan Stanley Resea ch estimates.
We update our HVLP4 copper foil supply-demand model to factor in the changes in our capacity assumptions for Co-Tech, as well as the latest expansion plans announced by Chinese and Korean suppliers, which leads to a ~8% undersupply in 2027 followed by a ~13% supply surplus in 2028.
Exhibit 2: HVLP4 coppe foil supply-demand model
Sou ce: Mo gan Stanley Taiwan Resea ch estimates.
M Idea
Exhibit 3: Changes to ou capacity assumptions fo Co-Tech
| Capacity at (t/m) - assumptions year-end | 2026 - New | 2026 - Old | 2026 - Diff. | 2027 - New | 2027 - Old | 2027 - Diff. | 2028 - New | 2028 - Old | 2028 - Diff. |
|---|---|---|---|---|---|---|---|---|---|
| HVLP3/HVLP4 | 400 | 330 | 21% | 830 | 850 | -2% | 1,670 | 950 | 76% |
| RG | 1,000 | 1,000 | 0% | 1,270 | 1,200 | 6% | 1,270 | 1,200 | 6% |
Sou ce: Mo gan Stanley Resea ch estimates.
Exhibit 4: We estimate Co-Tech holds ~12% supply sha e fo HVLP4 coppe foil in 2026E
Global HVLP4 copper foil suppliers' market share by capacity (2026E)
Sou ce: Mo gan Stanley Taiwan Resea ch estimates.
Exhibit 5: We estimate Co-Tech's sha e will expand to ~22% in 2028E
Global HVLP4 copper foil suppliers' market share by capacity (2028E)
Sou ce: Mo gan Stanley Taiwan Resea ch estimates.
M Idea
Earnings Estimates Changes
Our EPS estimates for CY26-28 increase 3%, 2% and 12% respectively, reflecting higher capacity assumptions but slightly lowered margin assumptions.
Exhibit 6: Ea nings estimates changes
| NT$ mn | 2026e - New | 2026e - Old | 2026e - Variance | 2027e - New | 2027e - Old | 2027e - Variance | 2028e - New | 2028e - Old | 2028e - Variance |
|---|---|---|---|---|---|---|---|---|---|
| Net sales | 11,579 | 11,115 | 4% | 16,830 | 15,849 | 6% | 26,651 | 22,496 | 18% |
| COGS | -8,182 | -7,822 | 5% | -10,345 | -9,528 | 9% | -14,712 | -11,882 | 24% |
| Gross profit | 3,397 | 3,293 | 3% | 6,486 | 6,321 | 3% | 11,939 | 10,614 | 12% |
| Operating expenses | -372 | -356 | 4% | -515 | -485 | 6% | -772 | -650 | 19% |
| Operating income | 3,025 | 2,936 | 3% | 5,971 | 5,835 | 2% | 11,167 | 9,964 | 12% |
| Non-operating income | 27 | 27 | 0% | 47 | 47 | 0% | 47 | 47 | 0% |
| Pre-tax income | 3,052 | 2,964 | 3% | 6,018 | 5,883 | 2% | 11,215 | 10,011 | 12% |
| Income tax | -616 | -598 | 3% | -1,204 | -1,177 | 2% | -2,243 | -2,002 | 12% |
| Net income | 2,436 | 2,366 | 3% | 4,814 | 4,706 | 2% | 8,972 | 8,009 | 12% |
| EPS (NT$) | 9.62 | 9.34 | 3% | 19.01 | 18.59 | 2% | 35.43 | 31.63 | 12% |
| Margins (%) | ppt | ppt | ppt | ||||||
| Gross margin | 29.3% | 29.6% | -0.3 | 38.5% | 39.9% | -1.3 | 44.8% | 47.2% | -2.4 |
| Operating margin | 26.1% | 26.4% | -0.3 | 35.5% | 36.8% | -1.3 | 41.9% | 44.3% | -2.4 |
| Pre-tax margin | 26.4% | 26.7% | -0.3 | 35.8% | 37.1% | -1.4 | 42.1% | 44.5% | -2.4 |
| Net margin | 21.0% | 21.3% | -0.2 | 28.6% | 29.7% | -1.1 | 33.7% | 35.6% | -1.9 |
Sou ce: Mo gan Stanley Resea ch estimates.
Price target and valuation methodology
Our price tar et for Co-Tech increases ~2% to NT$745: This implies 39x CY27 or 21x CY28 P/E. Our price target is also our base case scenario value. It is derived from our residual income RI) model similar to the rest of our tech hardware universe).
To calculate the fair value of the stock, we use the company's beginning equity plus the present value of all expected residual income of earnings in excess of cost of capital. The RI is positive when ROAE is above the cost of capital and negative when it is below the cost of capital. Our key assumptions include:
- A cost of equity of 9.3% beta of 1.0, equity risk premium of 8.7%, and risk-free rate of 1.0%),
- a medium-term growth rate of 11.5% lowered from 13% previously, as we enter a higher base in CY27),
- a terminal growth rate of 3%.
The 21x CY28 P/E implied by our price target is above its past 3Y average of 20x. We deem this valuation as fair, because Co-Tech is benefitting from an earnings growth cycle fueled by stronger AI server/networking CCL demand, Co-Tech's continued mix improvement from HTE + RTF RG) copper foils to advanced RTF RG) + HVLP3/4 copper foils) and continued processing fee adjustments, which supports margin expansion. The stock is trading at just 12x CY28 P/E, below Co-Tech's past 3Y average of 20x. Thus, we view the risk reward as attractive.
Our bull- and bear-case values also increase ~2% to NT$1,225 and NT$305, respectively.
M Idea
Exhibit 7: Residual income (RI) model
| 2027E | 2028E | 2029E | 2030E | 2031E | 2032E | 2033E | 2034E | 2035E | 2036E | 2037E | ||
|---|---|---|---|---|---|---|---|---|---|---|---|---|
| Total Equity | 13,119 | 19,796 | 22,441 | 25,390 | 28,678 | 32,344 | 36,432 | 40,991 | 46,073 | 51,740 | 56,236 | |
| Net Profit | 4,814 | 8,972 | 10,004 | 11,154 | 12,437 | 13,867 | 15,462 | 17,240 | 19,222 | 21,433 | 22,076 | |
| Return on Equity | 42.6% | 54.5% | 47.4% | 46.6% | 46.0% | 45.4% | 45.0% | 44.5% | 44.2% | 43.8% | 40.9% | |
| Beta | 1.0 | 1.0 | 1.0 | 1.0 | 1.0 | 1.0 | 1.0 | 1.0 | 1.0 | 1.0 | 1.0 | 1.0 |
| Equity Risk Premium (Rm-Rf) | 8.7% | 8.7% | 8.7% | 8.7% | 8.7% | 8.7% | 8.7% | 8.7% | 8.7% | 8.7% | 8.7% | 8.7% |
| Risk Free Rate (Rf) | 1.0% | 1.0% | 1.0% | 1.0% | 1.0% | 1.0% | 1.0% | 1.0% | 1.0% | 1.0% | 1.0% | 1.0% |
| Cost of Equity | 9.3% | 9.3% | 9.3% | 9.3% | 9.3% | 9.3% | 9.3% | 9.3% | 9.3% | 9.3% | 9.3% | 9.3% |
| Residual Income | 3,155 | 5,931 | 7,535 | 8,378 | 9,318 | 10,366 | 11,533 | 12,835 | 14,287 | 15,905 | 16,343 | |
| Spread | 33.3% | 45.2% | 38.1% | 37.3% | 36.7% | 36.1% | 35.7% | 35.2% | 34.9% | 34.5% | 31.6% | |
| Beginning Equity Capital | 13,119 | |||||||||||
| PV of Forecast Period | 65,837 | |||||||||||
| PV of Continuing Value | 109,695 | |||||||||||
| Equity Value | 188,651 | |||||||||||
| No. of Shares | 253 | |||||||||||
| Projected Price | 745.0 | |||||||||||
| Implied CY27 PE | 39x | |||||||||||
| Implied CY28 PE | 21x |
Sou ce: Mo gan Stanley Resea ch estimates.
Exhibit 8: Co-Tech P/E cha t
Sou ce: Company data, Mo gan Stanley Resea ch estimates.
M Idea
Financials
Exhibit 9: Co-Tech: Qua te ly ea nings estimates
| 1Q25 | 2Q25 | 3Q25 | 4Q25 | 1Q26 | 2Q26 | 3Q26E | 4Q26E | 2025 | 2026E | 2027E | 2028E | |
|---|---|---|---|---|---|---|---|---|---|---|---|---|
| Net sales | 1,728 | 2,002 | 1,986 | 2,164 | 2,532 | 2,805 | 3,169 | 3,074 | 7,880 | 11,579 | 16,830 | 26,651 |
| COGS | (1,365) | (1,624) | (1,578) | (1,598) | (1,805) | (2,037) | (2,312) | (2,029) | (6,165) | (8,182) | (10,345) | (14,712) |
| Gross profit | 363 | 378 | 408 | 567 | 727 | 768 | 857 | 1,045 | 1,715 | 3,397 | 6,486 | 11,939 |
| Operating expenses | (57) | (60) | (71) | (79) | (78) | (83) | (107) | (104) | (268) | (372) | (515) | (772) |
| SG&A | (47) | (48) | (53) | (58) | (55) | (55) | (75) | (74) | (205) | (259) | (360) | (544) |
| R&D | (11) | (12) | (18) | (21) | (23) | (28) | (32) | (30) | (62) | (113) | (156) | (227) |
| Operating income | 306 | 317 | 337 | 487 | 649 | 685 | 750 | 941 | 1,447 | 3,025 | 5,971 | 11,167 |
| Non-operating income | 25 | (110) | (22) | 1 | 0 | 4 | 12 | 12 | (107) | 27 | 47 | 47 |
| Interest income | 0 | 0 | (4) | (5) | (6) | (3) | (3) | (3) | (8) | (15) | (13) | (13) |
| Investment income | 0 | 0 | 0 | 0 | 0 | 0 | 0 | 0 | 0 | 0 | 0 | 0 |
| Disposal of investment | 0 | 0 | 0 | 0 | 0 | 0 | 0 | 0 | 0 | 0 | 0 | 0 |
| Exchange gain | 15 | (116) | 41 | (14) | (10) | (9) | 0 | 0 | (74) | (18) | 0 | 0 |
| Other | 9 | 6 | (59) | 20 | 16 | 15 | 15 | 15 | (25) | 61 | 60 | 60 |
| Pre-tax income | 330 | 208 | 315 | 488 | 649 | 688 | 762 | 953 | 1,341 | 3,052 | 6,018 | 11,215 |
| Income tax | (65) | (41) | (62) | (111) | (129) | (143) | (152) | (191) | (278) | (616) | (1,204) | (2,243) |
| Minority interest | 0 | 0 | 0 | 0 | 0 | 0 | 0 | 0 | 0 | 0 | 0 | 0 |
| Net income | 265 | 167 | 253 | 377 | 520 | 545 | 610 | 762 | 1,063 | 2,436 | 4,814 | 8,972 |
| Adj.wtd.avg.shrs (mn) | 253 | 253 | 252 | 253 | 252 | 252 | 252 | 252 | 253 | 253 | 253 | 253 |
| EPS | 1.05 | 0.66 | 1.00 | 1.49 | 2.06 | 2.16 | 2.41 | 3.02 | 4.20 | 9.62 | 19.01 | 35.43 |
| Fully Diluted shares (mn) | 253 | 253 | 252 | 253 | 252 | 252 | 252 | 252 | 253 | 253 | 253 | 253 |
| Diluted EPS (NT$) | 1.05 | 0.66 | 1.00 | 1.49 | 2.06 | 2.16 | 2.41 | 3.02 | 4.20 | 9.62 | 19.01 | 35.43 |
| Margins (%) | ||||||||||||
| Gross Margin | 21.0 | 18.9 | 20.5 | 26.2 | 28.7 | 27.4 | 27.0 | 34.0 | 21.8 | 29.3 | 38.5 | 44.8 |
| Operating Margin | 17.7 | 15.9 | 17.0 | 22.5 | 25.6 | 24.4 | 23.7 | 30.6 | 18.4 | 26.1 | 35.5 | 41.9 |
| Pretax Margin | 19.1 | 10.4 | 15.9 | 22.5 | 25.6 | 24.5 | 24.1 | 31.0 | 17.0 | 26.4 | 35.8 | 42.1 |
| Net Margin | 15.3 | 8.3 | 12.8 | 17.4 | 20.5 | 19.4 | 19.2 | 24.8 | 13.5 | 21.0 | 28.6 | 33.7 |
| QoQ Growth (%) | ||||||||||||
| Sales | 1 | 16 | -1 | 9 | 17 | 11 | 13 | -3 | ||||
| Gross Profit | 21 | 4 | 8 | 39 | 28 | 6 | 12 | 22 | ||||
| Operating Profit | 26 | 4 | 6 | 44 | 33 | 6 | 10 | 25 | ||||
| Pretax Profit | 36 | -37 | 52 | 55 | 33 | 6 | 11 | 25 | ||||
| Net Profit | 36 | -37 | 52 | 49 | 38 | 5 | 12 | 25 | ||||
| YoY Growth (%) | ||||||||||||
| Sales | 15 | 10 | 11 | 27 | 47 | 40 | 60 | 42 | 16 | 47 | 45 | 58 |
| Gross Profit | 17 | -9 | 24 | 90 | 100 | 103 | 110 | 84 | 27 | 98 | 91 | 84 |
| Operating Profit | 19 | -13 | 20 | 101 | 112 | 116 | 123 | 93 | 27 | 109 | 97 | 87 |
| Pretax Profit | 25 | -43 | 14 | 101 | 97 | 232 | 142 | 95 | 17 | 128 | 97 | 86 |
| Net Profit | 25 | -43 | 14 | 93 | 96 | 226 | 141 | 102 | 15 | 129 | 98 | 86 |
Sou ce: Company Data, Mo gan Stanley Resea ch estimates.
M Idea
Exhibit 10: Co-Tech: Consolidated financial summa y
Consolidated Income Statement
| NT$mn (Year End Dec 31) | 2025 | 2026E | 2027E | 2028E |
|---|---|---|---|---|
| Net sales | 7,880 | 11,579 | 16,830 | 26,651 |
| COGS | (6,165) | (8,182) | (10,345) | (14,712) |
| Gross profit | 1,715 | 3,397 | 6,486 | 11,939 |
| Operating expenses | (268) | (372) | (515) | (772) |
| Operating income | 1,447 | 3,025 | 5,971 | 11,167 |
| Non-operating income | (107) | 27 | 47 | 47 |
| Interest income | (8) | (15) | (13) | (13) |
| Investment income | - | - | - | - |
| Disposal of investment | - | - | - | - |
| Exchange gain | (74) | (18) | - | - |
| Other | (25) | 61 | 60 | 60 |
| Pre-tax income | 1,341 | 3,052 | 6,018 | 11,215 |
| Income tax | (278) | (616) | (1,204) | (2,243) |
| Minority interests | - | - | - | - |
| Net income | 1,063 | 2,436 | 4,814 | 8,972 |
| Adj. wtd. Avg. shrs (m) | 253 | 253 | 253 | 253 |
| Reported EPS (NT$) | 4.20 | 9.62 | 19.01 | 35.43 |
| Diluted shrs (m) | 253 | 253 | 253 | 253 |
| Diluted EPS (NT$) | 4.20 | 9.62 | 19.01 | 35.43 |
Consolidated Balance Sheet
| Consolidated Cash Flow Statement | Consolidated Cash Flow Statement | Consolidated Cash Flow Statement | Consolidated Cash Flow Statement | Consolidated Cash Flow Statement |
| NT$mn (Year End Dec 31) | 2025 | 2026E | 2027E | 2028E |
| Operating Cashflow | 362 | 1,364 | 3,264 | 5,993 |
| Net Profits | 1,063 | 2,436 | 4,814 | 8,972 |
| Depreciation & Amort. | 90 | 90 | 98 | 106 |
| Investment losses/(income) | 0 | 0 | 0 | 0 |
| Working capital change | 2,757 | (1,126) | (1,596) | (2,986) |
| Other adjustments | (3,584) | (37) | (53) | (99) |
| Investing Cashflow | (792) | (497) | (496) | (493) |
| Capex | (500) | (500) | (500) | (500) |
| Change of L/T investment | 0 | 0 | 0 | 0 |
| Change of S/T investment | (290) | 0 | 0 | 0 |
| Other adjustments | (5) | 0 | 0 | 0 |
| Financing Cashflow | (816) | (193) | (852) | (1,977) |
| Increase in L/T debt | 0 | 0 | 0 | 0 |
| Increase in S/T debt | (429) | 300 | 300 | 300 |
| Issuance of stock | 0 | 6 | 0 | 0 |
| Cash dividends | (379) | (506) | (1,161) | (2,295) |
| Other adjustments | (8) | 7 | 10 | 18 |
| FX adjustment | (0) | 18 | 0 | 0 |
| Net change in cash | (1,246) | 692 | 1,916 | 3,523 |
2026E 2027E 2028E NT$mn (Year End Dec 31)
26,651 Operating Cashflow
(14,712) Net Profits
11,167 Working capital change
47 Other adjustments
60 Other adjustments
35.43 Other adjustments
| NT$mn (Year End Dec 31) | 2025 | 2026E | 2027E | 2028E |
|---|---|---|---|---|
| Cash | 745 | 1,437 | 3,353 | 6,877 |
| Mkt securities | 0 | 0 | 0 | 0 |
| AR/NR | 2,388 | 3,509 | 5,100 | 8,076 |
| Inventory | 941 | 1,249 | 1,579 | 2,246 |
| Others | 79 | 117 | 170 | 268 |
| Current Assets | 4,153 | 6,311 | 10,202 | 17,467 |
| Long-term investments | 583 | 583 | 583 | 583 |
| Fixed assets | 4,598 | 5,004 | 5,402 | 5,789 |
| Other assets | 113 | 113 | 113 | 113 |
| Total Assets | 9,446 | 12,011 | 16,299 | 23,951 |
| S/T borrowings | 993 | 1,293 | 1,593 | 1,893 |
| AP/NP | 281 | 372 | 471 | 669 |
| Other ST liabilities | 647 | 859 | 1,085 | 1,544 |
| Total Current Liabilities | 1,921 | 2,524 | 3,149 | 4,106 |
| L/T debt | - | - | - | - |
| Other LT libilities | 14 | 21 | 31 | 49 |
| Total Liabilities | 1,935 | 2,545 | 3,180 | 4,155 |
| Common shares | 2,526 | 2,532 | 2,532 | 2,532 |
| Retained Earnings | 2,683 | 4,631 | 8,284 | 14,962 |
| Other SH' Equity | 2,302 | 2,302 | 2,302 | 2,302 |
| Total Shareholders' Equity | 7,511 | 9,466 | 13,119 | 19,796 |
| Total Liab./SH's Equity | 9,446 | 12,011 | 16,299 | 23,951 |
| 2025 | 2026E | 2027E | 2028E | |
|---|---|---|---|---|
| Margins (%) | ||||
| Gross margin | 21.8 | 29.3 | 38.5 | 44.8 |
| Operating margin | 18.4 | 26.1 | 35.5 | 41.9 |
| Pretax margin | 17.0 | 26.4 | 35.8 | 42.1 |
| Net margin | 13.5 | 21.0 | 28.6 | 33.7 |
| YoY growth (%) | ||||
| Sales | 15.5 | 46.9 | 45.3 | 58.4 |
| Operating profits | 26.6 | 109.0 | 97.4 | 87.0 |
| Pretax profits | 16.7 | 127.7 | 97.2 | 86.4 |
| Net profits | 15.3 | 129.3 | 97.6 | 86.4 |
| Others | ||||
| Cash dividend payout (%) | 48% | 48% | 48% | 48% |
| Cash div (NT$) | 2.00 | 4.59 | 9.06 | 16.89 |
| Yield (%) | 0% | 1% | 2% | 4% |
| Net Debt/Equity (%) | 3% | -2% | -13% | -25% |
| Liabilities/Equity (%) | 26% | 27% | 24% | 21% |
| Liabilities/Assets (%) | 20% | 21% | 20% | 17% |
| ROAE (%) | 15% | 29% | 43% | 55% |
| ROAA (%) | 12% | 23% | 34% | 45% |
| AR/NR Turnover (days) | 96 | 93 | 93 | 90 |
| Inventory Turnover (days) | 49 | 49 | 50 | 47 |
| AP/NP Turnover (days) | 17 | 15 | 15 | 14 |
| Cash conversion cycle | 129 | 127 | 128 | 124 |
Consolidated Financial Ratios
Sou ce: Company Data, Mo gan Stanley Resea ch estimates.
6,877 Margins (%)
0 Gross margin
8,076 Operating margin
5,789 Operating profits
1,893 Others M Idea
Risk Reward - Co-Tech Development Corp (8358 TWO) Risk Reward - Co-Tech Development Corp. (8358.TWO)
Exiting Cheap Copper, Entering Premium Returns
NT$745.00 PRICE TARGET
Base case, derived from a residual income (RI) model. Key assumptions include a cost of equity of 9.3% (beta of 1.0, equity premium of 8.7% and risk-free rate of 1%), medium-term growth rate of 11.5%, and terminal growth rate of 3%.
NT$752.50
MS PT
Mean
Consensus Price Target Distribution
NT$570.00
NT$940.00
Source: Refinitiv, Morgan Stanley Research Morgan Stanley Estimates
Source: Refinitiv, Morgan Stanley Research
BULL CASE
BASE CASE
OVERWEIGHT THESIS
- ▪Co-Tech has exited the low-margin HTE copper foil business, which should support profitability improvement.
- ▪Co-Tech has a dominant share in the server R-PCB copper foil market with its RG copper foils (equivalent to HVLP1/2), making it a key beneficiary of global data center infrastructure build-outs.
- ▪Co-Tech is proactively expanding its HVLP4 capacity to support key AI customers' high-end copper foil demand. It should have a 22% supply share by 2028, on our estimates.
- ▪Risk-reward is attractive with the stock trading at 12x CY28 P/E vs the 3Y historical average of 20x.
Source: Refinitiv, Morgan Stanley Research
Risk Reward Themes
New Data Era:
Positive
Pricing Power:
Positive
View descriptions of Risk Rewards Themes here
BEAR CASE
35x 2028e P/E
We assume high-end servers and switches see significantly stronger growth in 2027-28, driven by faster-than-expected new data center build-outs and smooth ramp of new generations of AI/networking chips; we also assume copper foil demand from key satellite customer will be stronger than expected. We assume Co-Tech's copper foil demand from the mentioned applications remains robust while its product mix sees continued improvement from the adoption of HVLP4+ copper foil in more applications.
21x 2028e P/E
Co-Tech continues to grow materially driven by AI server demand growth, material grade upgrades and better pricing power due to scarce high-end capacity and continued shift toward higher-end applications.
9x 2028e P/E
We assume high-end servers and switches see significantly weaker demand in 2027-28, driven by slowdown in new data center build-outs and delayed ramp of new generations of AI/networking chips; we also assume copper foil demand from key satellite customer will be stagnant. As a result, we assume Co-Tech's copper foil demand from the aforementioned applications becomes sluggish and its customers' migration to the HVLP4+ platform to be put on hold.
NT$305.00
NT$1,225.00
NT$745.00
M Idea
Risk Reward - Co-Tech Development Corp. (8358.TWO)
KEY EARNINGS INPUTS
| Drivers | Dec 2025 | Dec | 2026eDec 2027eDec | 2028e |
|---|---|---|---|---|
| HVLP Copper Foil Revenue Contribution (%) | 3.3 | 15.7 | 34.5 | 54.7 |
INVESTMENT DRIVERS
- Monthly sales
- Project and supply share allocation
- Copper foil content per server/switch/satellite
- Processing fee adjustment
GLOBAL REVENUE EXPOSURE
Source: Morgan Stanley Research Estimate View explanation of regional hierarchies here
RISKS TO PT/RATING
RISKS TO UPSIDE
- Stronger AI demand
- Slower-than-expected capacity expansion by competitors
- Faster-than-expected material upgrades
- Slower-than-expected CPO adoption
RISKS TO DOWNSIDE
- Weaker AI demand
- Faster-than-expected capacity expansion by competitors
- Slower-than-expected material upgrades
- Faster-than-expected CPO adoption
OWNERSHIP POSITIONING
Inst. Owners, % Active
83.3%
Source: Refinitiv, Morgan Stanley Research
MS ESTIMATES VS. CONSENSUS
Source: Refinitiv, Morgan Stanley Research M Idea
Risk Reward Reference links
- View explanation of Options Probabilities methodology -
Options_Probabilities_Exhibit_Link.pdf
- View descriptions of Risk Rewards Themes - RR_Themes_Exhibit_Link.pdf
-
View explanation of regional hierarchies - GEG_Exhibit_Link.pdf
-
View explanation of Theme/Exposure methodology -
ESG_Sustainable_Solutions_External_Link.pdf
- View explanation of HERS methodology - ESG_HERS_External_Link.pdf
M Idea