PDF 原檔:報告_MS_致茂2360_20261026_original.pdf
圖片清單(已驗證 2026-10-27)
| 檔名 | size | 分類 | 親眼所見內容 |
|---|---|---|---|
報告_MS_致茂2360_20261026_001.png |
25KB | 真資料圖 | 長條+折線:Test instruments & ATS 營收(NT$mn)2024–2028E 與 YoY(右軸),2026E 約 24,500、YoY 約 +130%,2028E 約 49,000(財務圖) |
報告_MS_致茂2360_20261026_002.png |
14KB | 真資料圖 | 長條:Test instruments & ATS 營收占比 2024–2028E,約 32%→37%→40%→41%→46%(財務圖) |
報告_MS_致茂2360_20261026_003.png |
133KB | 真資料圖 | 致茂 3D Metrology Measurement System(BLiS 技術)兩款機台:Model 7980(XY/Z 解析 30nm/0.05nm,多光源,應用 Probe Mark Indentation Depth、2D/3D CD 與表面形貌)與標示 NEW 的 Model 7981(RDL ≥2µm AR3、TSV/VIA ≥2µm AR15、OVL ≤0.2µm) |
報告_MS_致茂2360_20261026_004.png |
78KB | 真資料圖 | 光干涉概念示意:S1、S2 兩束波疊加,相位同則亮、相反則暗(A 處明暗曲線) |
報告_MS_致茂2360_20261026_005.png |
63KB | 真資料圖 | 干涉儀架構示意:白光光源經透鏡與分光鏡,一路至參考 Mirror、一路至 Sample(圖中為硬幣),反射光匯合後進 Camera |
報告_MS_致茂2360_20261026_006.png |
176KB | 真資料圖 | 致茂 CPO Test Solutions:PIC 晶圓→EPIC Wafer/Die→Light Engine→CPO Switch 流程;PIC Wafer Test 用 586XX 系列(光學/電性/可靠度與 WAT 測試);Light Engine & CPO Automation Test 用 587XX 系列(Light Engine O/E、CPO Switch、雷射可靠度測試)、5860X 系列與 Laser Source(標示 NEW) |
報告_MS_致茂2360_20261026_007.png |
27KB | 真資料圖 | 長條+折線:Semi & Photonics 營收 2024–2028E 與 YoY,2026E 約 22,000、2028E 約 40,000(財務圖) |
報告_MS_致茂2360_20261026_008.png |
14KB | 真資料圖 | 長條:Semi & Photonics 營收占比 2024–2028E,約 32%→35%→36%→40%→38%(財務圖) |
報告_MS_致茂2360_20261026_009.png |
50KB | 真資料圖 | 致茂 NTM 預期本益比 2020/1–2026/10 與平均、±1/±2 標準差線;2026 高點約 58x,近期約 32–38x(股價評價圖) |
報告_MS_致茂2360_20261026_010.png |
50KB | 真資料圖 | MS Risk Reward 圖:現價 NT$1,980,Bull NT$3,900(+96.97%)、Base NT$2,800(+41.41%)、Bear NT$1,100(−44.44%);共識目標價區間 NT$430–4,000(股價評價圖) |
報告_MS_致茂2360_20261026_011.png |
39KB | 真資料圖 | FY2027E MS 預估 vs 共識區間:營收 89,238(共識均值 79,101)、EBIT 36,124(35,022)、淨利 30,097(27,860)、EPS 70.77(68.09)、ROE 66.0%(57.6%)(財務圖) |
報告_MS_致茂2360_20261026_012.png |
50KB | 真資料圖(重複) | MS 目標價階梯圖(2023/10–2026/10,紅虛線),最新 TP 2800(前 2710、1530、1350…)疊股價線;與 _010 並非同圖,同 20261006 報告之階梯圖(股價評價圖) |
原始內容
| Morgan Stanley Taiwan Limited+ Derrick Yang Equity Analyst D rrick.Yang@morganstanl y.com | +886 2 2730-2862 |
|---|---|
| Vivi Huang R s arch Associat Vivi.Huang@morganstanl y.com | |
| Morgan Stanley Asia Limited+ Andy Meng, CFA Equity Analyst | +886 2 2730-2860 |
| Andy.M ng@morganstanl y.com | +852 2239-7689 |
Morgan Stanley appreciates your support in the 2027 Extel Asia Research Survey. Voting opens 10 Novem er 2026.
Chroma Ate Inc.(2360.TW, 2360 TT)
Greater China Technology Hardware | Taiwan
| Stock Rating | Overweight |
|---|---|
| Industry View | In-Line |
| Price target | NT$2,800.00 |
| Up/downside to price target (%) | 41 |
| hr price, close (Oct 22, 2026) | NT$1,980.00 |
| 52-Week Range | NT$2,795.00-717.00 |
| h out, dil, curr (mn) | 425 |
| Mkt cap, curr (mn) | U $25,851 |
| EV, curr (mn) | U $25,517 |
| Avg daily trading value (mn) | U $181 |
| Fiscal Year Ending | 12/25 | 12/26e | 12/27e | 12/28e |
|---|---|---|---|---|
| EP (NT$)** | 27.49 | 48.57 | 70.77 | 85.57 |
| Prior EP (NT$)** | - | 43.97 | 62.77 | 74.77 |
| EP (NT$)§ | 26.88 | 45.46 | 68.09 | 88.26 |
| Revenue, net (NT$ mn) | 28,311 | 61,591 | 89,238106,126 | |
| EBITDA (NT$ mn) | 10,038 | 25,071 | 36,903 | 44,562 |
| ModelWare net inc (NT | 11,692 | 20,656 | 30,097 | 36,387 |
| $ mn) | ||||
| P/E | 28.2 | 40.8 | 28.0 | 23.1 |
| P/BV | 10.1 | 18.5 | 13.6 | 10.8 |
| RNOA (%) | 49.4 | 89.2 | 102.7 | 103.2 |
| ROE (%) | 45.9 | 63.4 | 66.0 | 58.6 |
| EV/EBITDA | 31.8 | 32.9 | 22.1 | 18.0 |
| Div yld (%) | 1.2 | 1.0 | 1.7 | 2.5 |
| FCF yld ratio (%)** | 2.4 | 1.7 | 3.0 | 4.0 |
| Leverage (EOP) (%) | (33.4) | (37.2) | (44.3) | (51.1) |
Unless otherwise noted, all metrics are based on Morgan tanley ModelWare framework
- § = Consensus data is provided by Refinitiv Estimates
** = Based on consensus methodology
- e = Morgan tanley Research estimates
Morgan Stanley does and seeks to do business with companies covered in Morgan Stanley Research. As a result, investors should be aware that the firm may have a conflict of interest that could affect the objectivity of Morgan Stanley Research. Investors should consider Morgan Stanley Research as only a single factor in making their investment decision.
For analyst certification and other important disclosures, refer to the Disclosure Section, located at the end of this report.
= Analysts employed by non-U.S. affiliates are not registered with FINRA, may not be associated persons of the member and may not be subject to FINRA restrictions on communications with a subject company, public appearances and trading securities held by a research analyst account.
M Idea October 26, 2026 10:57 PM GMT
Chroma Ate Inc. | Asia Pacific
2H26 Driven by Semis and Photonics; 2027 Seen as Another Strong Year
A unique combination of ower, electrical and o tical testing tool ca abilities osition the com any well in AI de loyment. Stay OW.
We see 3Q26 EPS of NT$13.71: Chroma's 3Q26 revenue came in at NT$17,926mn, up 32% QoQ and 18 % YoY. We believe the strength was driven mainly by the semiconductor and photonics businesses, while the power testing business likely remained at an elevated level. Within the semiconductor and photonics businesses, SLT should benefit from AI HPC customers' ramping; meanwhile, optical testing tools for transceivers and, to a lesser extent, CPO, are also seen as growth drivers during the quarter. We estimate GM of 6 .5% (flat QoQ) as scale tailwinds should be largely offset by a less favorable product mix, while OPM should expand by .5ppt QoQ to 39.3% on some operating leverage. Overall, we expect EPS of NT $13.71 (+13% QoQ/+15% YoY).
Growth moment m seen s stained into 2027: Looking ahead, we expect Chroma to see another year of strong growth, supported by the power testing (51% growth for 42% mix) and semi & photonics businesses (58% growth for 4 % mix).
- Power testing: The ever-increasing power consumption of AI clusters should continue to drive demand for higher spec testing tools. Along with our forecast of a 75% CAGR for global power supply unit demand in the next three years (see report), we think this should stay a major driver for Chroma.
- SLT: We are seeing more HPC chip designers adopting the system level testing process to make sure defects won't be incorporated into the AI systems. As the first mover in this market. Chroma should benefit from increasing chip volume as well as higher TDP, in our view.
- Photonics: Transceivers should continue to be the mainstream solution; architectures such as CPO and NPO also need testing tools.
- Emerging b siness: We expect Chroma, by leveraging its existing customer relationship and technology expertise, to gain more traction in FT handlers and burn-in ovens for AI HPCs in 2 27. These are the markets that Chroma previously focused less on, so they represent new opportunities.
Stay OW: We remain constructive on Chroma for its testing equipment's unique combination of power, electrical and optical capabilities, allowing it to capture growth opportunities in various aspects of AI deployment. Our PT remains NT $2,8 as our estimate increases are offset by a lower target multiple of 4 x 2 27e P/E (previously 45x) to factor in generally more conservative sentiment toward the AI space now. This implies a PEG of .6 (vs. 1. over the past decade).
M Idea
lphaSignals Earnings Preview
| Focus KPI | Focus KPI urprise | Likely impact to consensus EP * |
|---|---|---|
| Chroma te Inc. 2360.TW | ||
| 3Q26 business update and outlook | Likely upside surprise | Modest revision higher |
- ·We estimate the GM to be 60.5% (flat QoQ), as the scale tailwinds could be largely offset by a less favorable product mix.
- ·OPM should expand by 0.5ppt QoQ to 39.3% on some operating leverage.
- ·Overall, we expect the EP to be NT$13.71 (+13% QoQ/+15% YoY).
- *Likely impact to consensus EP is for the next 12 months
ource: Company data, Morgan tanley Research M Idea
A Closer Look
Test instrument and ATS segment set to reach another record high in 2026
Revenue for the segment increased 55% YoY to NT$1 ,546mn (37% of the mix) in 2 25. We estimate it will rise 118% YoY to NT$24,564mn (4 % of the mix) in 2 26. The everincreasing power consumption of AI clusters should continue to drive demand for higher spec testing tools. Along with our forecast of a 75% CAGR for global power supply unit demand in the coming three years (see our report), this should remain a major driver for Chroma, in our view.
Exhibit 1: T st Instrum nt and ATS R v nu (Annual)
Exhibit 2: T st Instrum nt and ATS R v nu Mix
Sourc : Company data, Morgan Stanl y R s arch (E) stimat s Sourc : Company data, Morgan Stanl y R s arch (E) stimat s
Multiple drivers in the semiconductor usiness
System-level testing (SLT) usiness
SLT should benefit from the capex cycle of NVIDIA's Rubin generation GPU, AMD's MI45 GPU and more ASIC accelerators. Management pointed out that discrete testing tools are still preferred by major customers. We are also seeing more HPC chip designers adopting the system level testing process to make sure defects won't be incorporated into the AI systems. We believe Chroma, as the first mover in this market, should benefit from increasing chip volume, as well as higher TDP.
Metrology usiness
The metrology business should continue to benefit from current advanced packaging architectures from its foundry and OSAT customers. It is confident that the performance of its tools can win future architecture projects, which our industry checks suggest should have higher metrology density.
M Idea
Exhibit 3: Chroma - Off rings for M trology in Advanc d Packaging
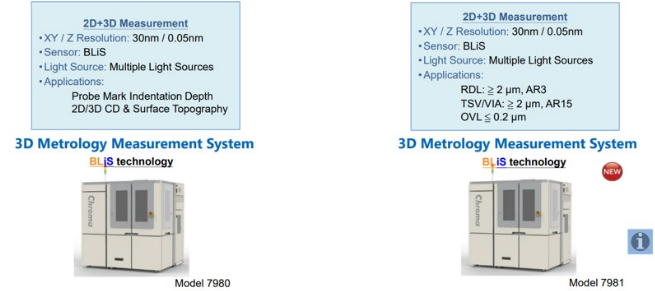
Sourc : Chroma
Chroma's metrology equipment employs white light interferometry technology. The basic working principle is that white light is emitted on the reference mirror and the sample, which are placed at the same distance from the light source. The reflected beams from the reference mirror and sample surface are then received by a light sensor.
Interference occurs when two light beams collide, which could cause them to either strengthen or weaken, depending on the phase of the two light beams. Thus, by measuring the intensity of the combined light beams, the distance between light sensor and multiple points on the target surface can be calculated through an algorithm. This can then be used to measure the dimensions of the structure or the alignment of layers.
Exhibit 4: Conc pt of Light Int rf r nc
Sourc : K y nc
Exhibit 5: S tup of Int rf rom t r
Sourc : Wikip dia
CPO contri ution to start from 2026
Chroma has been qualified for optical engine testing in Insertion 3 and system-level testing in Insertion 4, and there might be incremental opportunities if supply chain players' progress falls behind for testing equipment in Insertion 2. Over the longer term, Chroma also aspires to participate in the PIC optical/electrical/reliability testing in Insertion 1.
M Idea
Exhibit 6: Chroma's Off rings in CPO
CPO Test Solutions
Sourc : Chroma
FT handlers to add another revenue stream
In HPC testing, Chroma used to focus mostly on the SLT side, although it did unveil its first HPC FT handler earlier this year and is now going through the qualification process. We believe this is a natural extension of its expertise and customer relationships accumulated in SLTs. We expect Chroma to gain more traction in FT handlers for AI HPCs in 2 27.
Exhibit 7: Chroma's FT Handl r Off ring
Advanced Package FT Test Hander 3160-H
- Dual-site
- 3000W cooling
- Small footprint
- Optical Auto-Alignment
Sourc : Chroma
129% YoY growth seen for the semiconductor and photonics usiness in 2026
Overall, we forecast semiconductor and photonics revenue will grow 129% YoY in 2 26, accounting for 36% of Chroma's mix.
M Idea
Exhibit 8: S mi and Photonics R v nu (Annual)
Sourc : Company data, Morgan Stanl y R s arch (E) stimat s Sourc : Company data, Morgan Stanl y R s arch R s arch (E) stimat s M Idea
Exhibit 9: S mi and Photonics R v nu Mix
Chroma: Quarterly Financial Summary
Exhibit 10: Chroma: Quart rly Financial Summary
| NT$ mn | 1Q25 | 2Q25 | 3Q25 | 4Q25 | 1Q26 | 2Q26 | 3Q26E | 4Q26E | 2025 | 2026E | 2027E |
|---|---|---|---|---|---|---|---|---|---|---|---|
| Net sales | 6,865 | 6,455 | 6,410 | 8,580 | 11,860 | 13,529 | 17,926 | 18,276 | 28,311 | 61,591 | 89,238 |
| COGS | -2,717 | -2,231 | -2,575 | -3,363 | -4,436 | -5,344 | -7,089 | -7,256 | (10,886) | (24,125) | (34,504) |
| Gross profit | 4,148 | 4,224 | 3,835 | 5,217 | 7,424 | 8,185 | 10,837 | 11,020 | 17,425 | 37,467 | 54,735 |
| Operating expenses | -1,984 | -2,027 | -1,987 | -2,229 | -2,627 | -2,944 | -3,797 | -3,869 | (8,227) | (13,236) | (18,611) |
| SG&A, R&D exp. | -1,984 | -2,027 | -1,987 | -2,229 | -2,627 | -2,944 | -3,797 | -3,869 | (8,227) | (13,236) | (18,611) |
| Operating income | 2,164 | 2,197 | 1,848 | 2,988 | 4,797 | 5,241 | 7,040 | 7,151 | 9,198 | 24,230 | 36,124 |
| Non-operating income | 433 | 241 | 3,626 | 420 | 297 | 1,272 | 258 | 258 | 4,720 | 2,085 | 1,032 |
| Interest income | 9 | 21 | 7 | 20 | 10 | 14 | 23 | 23 | 56 | 71 | 92 |
| Investment income | 18 | 507 | 0 | 0 | 0 | 0 | 0 | 0 | 525 | 0 | 0 |
| Disposal of investment | 3 | 115 | 3,169 | 29 | 2 | 443 | 0 | 0 | 3,316 | 444 | 0 |
| Exchange gain | 152 | -676 | 241 | 284 | 200 | 38 | 0 | 0 | 1 | 238 | 0 |
| Others | 251 | 274 | 209 | 87 | 84 | 778 | 235 | 235 | 821 | 1,332 | 940 |
| Pre-tax income | 2,597 | 2,438 | 5,475 | 3,408 | 5,094 | 6,514 | 7,298 | 7,409 | 13,918 | 26,315 | 37,156 |
| Income tax | -441 | -431 | -361 | -759 | -1,146 | -1,284 | -1,423 | -1,445 | (1,992) | (5,298) | (6,919) |
| Minority interest | -33 | -54 | -48 | -99 | -84 | -107 | -85 | -85 | (234) | (361) | (140) |
| Net income | 2,122 | 1,953 | 5,066 | 2,550 | 3,864 | 5,123 | 5,790 | 5,879 | 11,692 | 20,656 | 30,097 |
| Adj.wtd.avg.shrs (mn) | 425 | 425 | 425 | 425 | 424 | 422 | 422 | 422 | 425 | 425 | 425 |
| EPS (NT$) | 4.99 | 4.59 | 11.91 | 5.99 | 9.12 | 12.13 | 13.71 | 13.92 | 27.49 | 48.57 | 70.77 |
| Margins (%) | |||||||||||
| Gross Margin | 60 | 65 | 60 | 61 | 63 | 60 | 60 | 60 | 62 | 61 | 61 |
| Operating Margin | 32 | 34 | 29 | 35 | 40 | 39 | 39 | 39 | 32 | 39 | 40 |
| Pretax Margin | 38 | 38 | 85 | 40 | 43 | 48 | 41 | 41 | 49 | 43 | 42 |
| Net Margin | 31 | 30 | 79 | 30 | 33 | 38 | 32 | 32 | 41 | 34 | 34 |
| QoQ Growth (%) | |||||||||||
| Sales | 14 | -6 | -1 | 34 | 38 | 14 | 32 | 2 | |||
| Gross Profit | 15 | 2 | -9 | 36 | 42 | 10 | 32 | 2 | |||
| Operating Profit | 39 | 2 | -16 | 62 | 61 | 9 | 34 | 2 | |||
| Pretax Profit | 34 | -6 | 125 | -38 | 49 | 28 | 12 | 2 | |||
| Net Profit | 44 | -8 | 159 | -50 | 52 | 33 | 13 | 2 | |||
| YoY Growth (%) | |||||||||||
| Sales | 55 | 17 | 14 | 42 | 73 | 110 | 180 | 113 | 31 | 118 | 45 |
| Gross Profit | 62 | 29 | 16 | 45 | 79 | 94 | 183 | 111 | 37 | 115 | 46 |
| Operating Profit | 140 | 45 | 23 | 92 | 122 | 139 | 281 | 139 | 68 | 163 | 49 |
| Pretax Profit | 113 | 35 | 214 | 76 | 96 | 167 | 33 | 117 | 107 | 89 | 41 |
| Net Profit | 122 | 39 | 255 | 73 | 82 | 162 | 14 | 131 | 122 | 77 | 46 |
Sourc : Company data, Morgan Stanl y R s arch (E) stimat s M Idea
Chroma: Financial Summary
Exhibit 11: Chroma: Financial Summary
Consolidated Income Statement
21,604 28,311 61,591 89,238 106,126 Operating Cashflow
-8,858 -10,886 -24,125 -34,504 -40,595 Net Profits
12,746 17,425 37,467 54,735 65,531 Depreciation & Amort.
9,198 24,230 36,124 43,821 Working capital change
1,032 Other adjustments
0 Capex
0 Change of L/T investment
940 Other adjustments
425 Cash dividends
85.57 Other adjustments
| NT$ mn (Year End Dec 31) | 2024 | 2025 | 2026E | 2027E | 2028E |
|---|---|---|---|---|---|
| Net sales | 21,604 | 28,311 | 61,591 | 89,238 | 106,126 |
| COGS | -8,858 | -10,886 | -24,125 | -34,504 | -40,595 |
| Gross profit | 12,746 | 17,425 | 37,467 | 54,735 | 65,531 |
| Operating expenses | -7,264 | -8,227 | -13,236 | -18,611 | -21,709 |
| Operating income | 5,482 | 9,198 | 24,230 | 36,124 | 43,821 |
| Non-operating income | 1,226 | 4,720 | 2,085 | 1,032 | 1,032 |
| Interest income | 48 | 56 | 71 | 92 | 92 |
| Investment income | 47 | 525 | 0 | 0 | 0 |
| Disposal of investment | 9 | 3,316 | 444 | 0 | 0 |
| Exchange gain | 250 | 1 | 238 | 0 | 0 |
| Others | 873 | 821 | 1,332 | 940 | 940 |
| Pre-tax income | 6,709 | 13,918 | 26,315 | 37,156 | 44,853 |
| Income tax | -1,308 | -1,992 | -5,298 | -6,919 | -8,327 |
| Minority interests | -136 | -234 | -361 | -140 | -140 |
| Net income | 5,264 | 11,692 | 20,656 | 30,097 | 36,387 |
| Adj. wtd. Avg. shrs (m) | 425 | 425 | 425 | 425 | 425 |
| Reported EPS (NT$) | 12.38 | 27.49 | 48.57 | 70.77 | 85.57 |
Consolidated Balance Sheet
| Consolidated Cash Flow Statement | Consolidated Cash Flow Statement | Consolidated Cash Flow Statement | Consolidated Cash Flow Statement | Consolidated Cash Flow Statement | Consolidated Cash Flow Statement |
| NT$ mn (Year End Dec 31) | 2024 | 2025 | 2026E | 2027E | 2028E |
| Operating Cashflow | 4,784 | 5,258 | 11,089 | 22,528 | 32,000 |
| Net Profits | 5,264 | 11,692 | 20,656 | 30,097 | 36,387 |
| Depreciation & Amort. | 775 | 841 | 841 | 779 | 740 |
| Investment losses/(income) | -715 | -1,259 | 0 | 0 | 0 |
| Working capital change | -1,020 | -4,306 | -8,996 | -7,543 | -4,635 |
| Other adjustments | 480 | -1,710 | -1,413 | -805 | -491 |
| Investing Cashflow | -1,891 | 1,428 | -308 | -446 | -531 |
| Capex | -2,005 | -2,301 | -2,156 | -3,123 | -3,714 |
| Change of L/T investment | 0 | -150 | 0 | 0 | 0 |
| Change of S/T investment | -187 | -289 | 0 | 0 | 0 |
| Other adjustments | 247 | 210 | 0 | 0 | 0 |
| Financing Cashflow | -2,997 | -4,548 | -4,420 | -11,560 | -19,028 |
| Increase in L/T debt | 1,111 | 1,203 | 0 | 0 | 0 |
| Increase in S/T debt | -718 | -1,402 | 0 | 0 | 0 |
| Issuance of stock | 0 | 0 | 0 | 0 | 0 |
| Cash dividends | -2,897 | -3,905 | -8,250 | -14,574 | -21,235 |
| Other adjustments | -493 | -444 | 3,829 | 3,015 | 2,207 |
| FX adjustment | 71 | -15 | -238 | 0 | 0 |
| Net change in cash | -33 | 2,123 | 6,122 | 10,522 | 12,442 |
Consolidated Financial Ratios
6,222 12,344 22,866 35,308 Margins (%)
2,236 Gross margin
8,925 19,417 28,133 33,456 Operating margin
3,089 Net margin
6,158 Operating profits
37,308 47,150 73,830 101,090 123,568 Net profits
10 Others
9,121 13,044 15,347 Cash dividend payout (%)
5,034 11,155 15,954 18,771 Cash div (NT$)
3,304 Net Debt/Equity (%)
4,252 ROAE (%)
11,021 18,170 29,894 45,416 60,568 ROAA (%)
| NT$ mn (Year End Dec 31) | 2024 | 2025 | 2026E | 2027E | 2028E |
|---|---|---|---|---|---|
| Cash | 4,099 | 6,222 | 12,344 | 22,866 | 35,308 |
| Mkt securities | 1,213 | 2,236 | 2,236 | 2,236 | 2,236 |
| AR/NR | 6,070 | 8,925 | 19,417 | 28,133 | 33,456 |
| Inventory | 5,458 | 7,919 | 17,549 | 25,099 | 29,530 |
| Others | 584 | 824 | 1,793 | 2,597 | 3,089 |
| Current Assets | 17,425 | 26,126 | 53,339 | 80,931 | 103,619 |
| Long-term investments | 8,918 | 7,953 | 7,953 | 7,953 | 7,953 |
| Fixed assets | 6,956 | 7,232 | 6,700 | 6,367 | 6,158 |
| Other assets | 4,009 | 5,839 | 5,839 | 5,839 | 5,839 |
| Total Assets | 37,308 | 47,150 | 73,830 | 101,090 | 123,568 |
| S/T borrowings | 1,414 | 10 | 10 | 10 | 10 |
| AP/NP | 3,106 | 4,116 | 9,121 | 13,044 | 15,347 |
| Other ST liabilities | 3,715 | 5,034 | 11,155 | 15,954 | 18,771 |
| Total Current Liabilities | 8,235 | 9,159 | 20,286 | 29,009 | 34,128 |
| L/T debt | 2,108 | 3,304 | 3,304 | 3,304 | 3,304 |
| Other LT liabilities | 1,515 | 2,125 | 4,622 | 6,697 | 7,964 |
| Total Liabilities | 11,858 | 14,587 | 28,212 | 39,009 | 45,396 |
| Common shares | 4,253 | 4,252 | 4,252 | 4,252 | 4,252 |
| Retained Earnings | 11,021 | 18,170 | 29,894 | 45,416 | 60,568 |
| Other SH' Equity | 10,175 | 10,140 | 11,472 | 12,412 | 13,352 |
| Total Shareholders' Equity | 25,450 | 32,563 | 45,619 | 62,081 | 78,173 |
| Total Liab./SH's Equity | 37,308 | 47,150 | 73,830 | 101,090 | 123,568 |
| 2024 | 2025 | 2026E | 2027E | 2028E | |
|---|---|---|---|---|---|
| Margins (%) | |||||
| Gross margin | 59.0 | 61.5 | 60.8 | 61.3 | 61.7 |
| Operating margin | 25.4 | 32.5 | 39.3 | 40.5 | 41.3 |
| Pretax margin | 31.1 | 49.2 | 42.7 | 41.6 | 42.3 |
| Net margin | 24.4 | 41.3 | 33.5 | 33.7 | 34.3 |
| YoY growth (%) | |||||
| Sales | 15.7 | 31.0 | 117.6 | 44.9 | 18.9 |
| Operating profits | 17.3 | 67.8 | 163.4 | 49.1 | 21.3 |
| Pretax profits | 29.9 | 107.5 | 89.1 | 41.2 | 20.7 |
| Net profits | 32.3 | 122.1 | 76.7 | 45.7 | 20.9 |
| Others | |||||
| Cash dividend payout (%) | 71 | 71 | 71 | 71 | 71 |
| Cash div (NT$) | 8.7 | 19.4 | 34.3 | 49.9 | 60.4 |
| Yield (%) | 3 | 3 | 8 | 14 | 20 |
| Net Debt/Equity (%) | -7 | -16 | -25 | -35 | -44 |
| Liabilities/Equity (%) | 47 | 45 | 62 | 63 | 58 |
| Liabilities/Assets (%) | 32 | 31 | 38 | 39 | 37 |
| ROAE (%) | 22 | 40 | 53 | 56 | 52 |
| ROAA (%) | 15 | 28 | 34 | 34 | 32 |
| AR/NR Turnover (days) | 96 | 97 | 84 | 97 | 106 |
| Inventory Turnover (days) | 209 | 224 | 193 | 226 | 246 |
| AP/NP Turnover (days) | 118 | 121 | 100 | 117 | 128 |
| Cash conversion cycle | 187 | 200 | 177 | 206 | 224 |
Sourc : Company data, Morgan Stanl y R s arch (E) stimat s M Idea
Estimate Revisions
We lift our earnings estimates by 1 -14% for 2 26-28, factoring in strong 3Q26 actual revenue along with more operating leverage on the bottom line.
Exhibit 12: Chroma: Estimat R visions
| NT$mn | 2026e Earnings Estimates - New | 2026e Earnings Estimates - Old | 2026e Earnings Estimates - Variance | 2027e Earnings Estimates - New | 2027e Earnings Estimates | 2027e Earnings Estimates - OldVariance | 2028e Earnings Estimates - New | 2028e Earnings Estimates - Old | 2028e Earnings Estimates - Variance |
|---|---|---|---|---|---|---|---|---|---|
| Net sales | 61,591 | 55,154 | 12% | 89,238 | 76,117 | 17% | 106,126 | 89,224 | 19% |
| COGS | (24,125) | (21,435) | 13% | (34,504) | (28,281) | 22% | (40,595) | (32,791) | 24% |
| Gross profit | 37,467 | 33,719 | 11% | 54,735 | 47,836 | 14% | 65,531 | 56,433 | 16% |
| Operating expenses | (13,236) | (11,875) | 11% | (18,611) | (15,869) | 17% | (21,709) | (18,233) | 19% |
| Operating income | 24,230 | 21,844 | 11% | 36,124 | 31,967 | 13% | 43,821 | 38,201 | 15% |
| Non-operating income | 2,085 | 2,075 | 0% | 1,032 | 1,012 | 2% | 1,032 | 1,012 | 2% |
| Pre-tax income | 26,315 | 23,919 | 10% | 37,156 | 32,979 | 13% | 44,853 | 39,213 | 14% |
| Income tax | (5,298) | (4,831) | 10% | (6,919) | (6,148) | 13% | (8,327) | (7,276) | 14% |
| Net income | 20,656 | 18,697 | 10% | 30,097 | 26,691 | 13% | 36,387 | 31,797 | 14% |
| EPS (NT$) | 48.57 | 43.97 | 10% | 70.77 | 62.77 | 13% | 85.57 | 74.77 | 14% |
| Margins (%) | ppt | ppt | ppt | ||||||
| Gross margin | 60.8% | 61.1% | -0.3 | 61.3% | 62.8% | -1.5 | 61.7% | 63.2% | -1.5 |
| Operating margin | 39.3% | 39.6% | -0.3 | 40.5% | 42.0% | -1.5 | 41.3% | 42.8% | -1.5 |
| Pre-tax margin | 42.7% | 43.4% | -0.6 | 41.6% | 43.3% | -1.7 | 42.3% | 43.9% | -1.7 |
| Net margin | 33.5% | 33.9% | -0.4 | 33.7% | 35.1% | -1.3 | 34.3% | 35.6% | -1.4 |
Sourc : Company data, Morgan Stanl y R s arch ( ) stimat s M Idea
Valuation Methodology and Risks
O r price target (base case scenario val e) remains NT$2,800: Our PT is based on a target multiple of 4 x 2 27e P/E (vs. 45x 2 27e previously). We lowered our multiple to factor in recent volatility in market sentiment toward AI. We view our multiple as justified based on our estimated 68% operating profit CAGR over 2 25-28. This implies a PEG of .6 vs. its average of 1. in the past decade, when the stock was trading at an average of ~19x forward P/E with an operating profit CAGR of 2 %.
B ll case scenario val e - NT$3,900 ( nchanged): We apply a 55x multiple (vs. 62x P/E previously) to our earnings estimate for 2 27. This scenario reflects stronger 5G and HPC demand, driving more earnings upside.
Bear case scenario val e - NT$1,100 ( nchanged): We apply a 16x P/E multiple (vs. 18x P/E previously) to our earnings estimate for 2 27. This scenario factors in weaker HPC revenue as hyperscalers start to focus more on ROI for AI capex than they did in the past couple of years.
Risks:
- Softer-than-expected AI capex
- Slower progress in advanced packaging capacity expansion
- Weaker consumer electronics and automobile related demand
Exhibit 13: Chroma - On -y ar Forward Cons nsus P/E
Sourc : FactS t cons nsus stimat s, Morgan Stanl y R s arch M Idea
Risk Reward - Chroma Ate Inc. (2360.TW) Risk Reward - Chroma Ate Inc. (2360.TW)
2027 Expected to Be Another Strong Year
NT$2,800.00 PRICE TARGET
Base case, 40x 2027e P/E. We use P/E as our valuation methodology because we think it better captures Chroma's earnings growth momentum. The stock traded at an average valuation of ~19x P/E during 2014-25 with an operating profit CAGR of 20%, implying a PEG of 1.0. We think our target multiple of 40x is justified by the 68% operating profit CAGR we project for 2025-28.
NT$2,675.79
Source: Refinitiv, Morgan Stanley Research
BULL CASE
BASE CASE
OVERWEIGHT THESIS
- ▪Multiple drivers for semi business growth:
- SLT will see the first year of capex cycle for the Rubin generation GPU, along with adoption at MI450 and ASIC accelerators. The metrology business should grow along with advanced packaging capacity expansion. On CPO, Chroma was qualified for optical engine testing in Insertion 3 and system-level testing in Insertion 4.
- ▪Power testing business continues to ride the AI capex cycle: Migration into the ±400/800VDC power rack architecture should be a positive development, while infrastructure builds in China should drive better ESS demand.
- ▪Stay OW: Our PT of NT$2,800 is based on target P/E of 40x 2027e vs. an average of ~19x forward P/E since 2010.
Consensus Rating Distribution
Source: Refinitiv, Morgan Stanley Research
Risk Reward Themes
| Electric Vehicles: | Positive |
|---|---|
| New Data Era: | Positive |
| Secular Growth: | Positive |
View descriptions of Risk Rewards Themes here
BEAR CASE
55x 2027e EPS
Stronger demand from EV, 5G and HPC: This scenario mainly reflects stronger-thanexpected EV, 5G and HPC demand, driving higher earnings.
40x 2027e EPS
Growth drivers intact for the coming years: We see Chroma as well positioned to ride the AI deployment cycle in 2026-27 through its dominance in power testing, SLT and metrology tools. Its business outlook remains strong with growth emerging from semiconductors, photonics/CPO and power testing businesses. We also see potential upside from its FT handler business.
16x 2027e EPS
Weaker sales momentum from EV, semiconductor and power testing: This scenario factors in weaker-than-expected EV sales owing to component supply shortages as well as slower semiconductor and power testing equipment orders.
NT$1,100.00
NT$3,900.00
NT$2,800.00
M Idea
Risk Reward - Chroma Ate Inc. (2360.TW)
KEY EARNINGS INPUTS
| Drivers | Dec 2025 | Dec 2026eDec 2027eDec 2028e | Dec 2026eDec 2027eDec 2028e | Dec 2026eDec 2027eDec 2028e |
|---|---|---|---|---|
| Test Instruments & ATS (NT$, mn) | 10,546 | 24,564 | 37,108 | 48,814 |
| Semiconductor/Photonics Test Solutions (NT$, mn) | 9,759 | 22,362 | 35,252 | 40,249 |
INVESTMENT DRIVERS
- New semi testing, EV or 3D sensing project/order wins
- Smartphone (iPhone/Android phone) ToF adoption
- Strong 5G infrastructure demand
- Mini LED product launch
GLOBAL REVENUE EXPOSURE
Source: Morgan Stanley Research Estimate View explanation of regional hierarchies here
MS ALPHA MODELS
2/5
MOST
3 Month
Horizon
Source: Refinitiv, FactSet, Morgan Stanley Research; 1 is the highest favored Quintile and 5 is the least favored Quintile
RISKS TO PT/RATING
RISKS TO UPSIDE
- Better-than-expected macro conditions
- Stronger semi and photonics and power testing demand
- Margin improvement via better product mix
- Better opex control
RISKS TO DOWNSIDE
- Macro slowdown
- Softer-than-expected AI capex
- Slower progress in the advanced packaging capacity expansion
- Weaker consumer electronics and automobile related demand
- Margin contraction arising from lack of revenue scale and increasing opex
OWNERSHIP POSITIONING
Inst. Owners, % Active
73.5%
Source: Refinitiv, Morgan Stanley Research
MS ESTIMATES VS. CONSENSUS
M Idea
Risk Reward Reference links
- View explanation of Options Probabilities methodology -
Options_Probabilities_Exhibit_Link.pdf
- View descriptions of Risk Rewards Themes - RR_Themes_Exhibit_Link.pdf
-
View explanation of regional hierarchies - GEG_Exhibit_Link.pdf
-
View explanation of Theme/Exposure methodology -
ESG_Sustainable_Solutions_External_Link.pdf
- View explanation of HERS methodology - ESG_HERS_External_Link.pdf
M Idea