PDF 原檔:報告_MS_國巨2327_20260722_original.pdf
Trim 修正紀錄(2026-07-23)
pdf_trim 初版將本檔裁到僅 104 行(原始解析 1,132 行),砍掉了 Earnings Estimates Changes、Price Target Discussion/RI Model、Risk Reward、Financials(Exhibit 17/18)等核心內容,只保留封面與財測摘要表。ingest 時改讀 proceed/3.unprocessed_data/parsed/報告_MS_國巨2327_20260722.md(未裁剪解析版)補回全文,僅裁去純法遵揭露文字(Global Research Conflict Management Policy 以後的免責聲明、Stock Ratings Distribution、Industry Coverage 名單等,無研究價值)。
圖片清單(已驗證 2026-07-23)
| 檔名 | size | 分類 | 親眼所見內容 |
|---|---|---|---|
報告_MS_國巨2327_20260722_001.png |
66KB | 裝飾·banner | 「Asia Summer School 2026」廣告橫幅(泳池背景),非資料圖 |
報告_MS_國巨2327_20260722_002.png |
203KB | 真資料圖 | Walsin Tech(華新科)1Q26 產品營收占比與應用分布圖 |
報告_MS_國巨2327_20260722_003.png |
79KB | 真資料圖 | Exhibit 4:國巨季度營收依產品別(1Q23-1Q26)堆疊柱狀圖 |
報告_MS_國巨2327_20260722_004.png |
46KB | 真資料圖 | Exhibit 6:國巨季度營收依通路別(Distributors/EMS/Direct Sales) |
報告_MS_國巨2327_20260722_005.png |
86KB | 真資料圖 | Exhibit 8:國巨季度營收依應用別(Telecom/Computing/Consumer/Industrial/Automotive/Aero) |
報告_MS_國巨2327_20260722_006.png |
52KB | 真資料圖 | Exhibit 5:國巨年度營收依產品別(2018-2025) |
報告_MS_國巨2327_20260722_008.png |
57KB | 真資料圖 | Exhibit 9:國巨年度營收依應用別(2018-2025) |
報告_MS_國巨2327_20260722_010.png |
49KB | 真資料圖 | Exhibit 15:MLCC 同業(村田/太陽誘電/TDK/SEMCO/國巨)營業利益率趨勢比較(2015FY-2028FYe),標示國巨(Yageo,深藍線)持續拉開差距 |
報告_MS_國巨2327_20260722_013.png |
60KB | 真資料圖 | Risk Reward Chart:Bull(NT$2,075)/Base(NT$1,465)/Bear(NT$685)三情境目標價圖 |
報告_MS_國巨2327_20260722_016.png |
44KB | 真資料圖 | MS Estimates vs. Consensus:2027E Sales/EBITDA/Net income/EPS 區間比較圖 |
報告_MS_國巨2327_20260722_017.png |
66KB | 真資料圖 | 股價走勢與評等/目標價沿革圖(2023-07 至 2026-07),標示 TP 由 1,355 上調至 1,515 後本次下修至 1,465 |
<40KB未 Read(007、009、011、012、014、015:Exhibit 7/13/14/16 P/E P/B 圖與其他次要圖表,預設非本次核心資料圖)。
原始內容
M July 22, 2026 08:10 AM GMT
Yageo Corp. | Asia Pacific
2Q preview - tightening MLCC narrative is unchanged
| What's Changed | To | |
|---|---|---|
| Price Target | NT$1,515.00 | NT$1,465.00 |
Recent market volatility has driven the stock to sell-off >40% from the peak (the TAIEX is down 6% over the same period). However, the medium-term narrative remains unchanged - there is not enough capacity to support the strong high-cap, high-end AI MLCCs. Stay OW going into earnings.
Key Takeaways
- Expect 3Q rev guidance "up moderately q/q", with GM/OpM "up slightly q/q".
- Walsin Tech's strong June preliminary profits should imply stronger pricing, which should be seen in Yageo's 3Q guidance.
2Q preview - better than guidance: Revenue reached NT$44.2bn (+16% q/q, +35% y/y), materially stronger than management's guidance of a "moderate increase q/q" (which we interpret as mid single digits), driven by stronger pricing and stronger pull-ins from ODMs as they build up their inventory buffer in response to concerns that midrange/low-end MLCCs would be in shortage once demand for high-cap MLCCs starts to ramp meaningfully, driven by Rubin and other AI server racks (see our previous reports here, here, and here). We forecast 2Q GM at 38.8% (+70bps q/ q), 30bps below the Street, but OpM at 26.8% (+170bps q/q), 20bps above the Street, and both in line with management's guidance of "up slightly."
3Q outlook - pricing to drive revenue and margin expansion: Despite sluggish demand for consumer tech, we still see strong demand for AI. We also expect Yageo to benefit from pricing tailwinds; our supply chain checks point to a 30-40% rise in direct customer pricing on average in 2H26, as mentioned before. This drives our expectation that Yageo will be able to lift revenue 8% q/q, to NT$47.6bn, and expand GM 150bps q/q, to 40.3%, with 210bps q/q OpM expansion, to 28.9% resulting in EPS of NT$5.49. As a result, we see management issuing 3Q revenue guidance of a "moderate increase q/q" and GM/OpM guidance of "up slightly q/q."
Key issues on which we will focus in the earnings call: 1) demand visibility for nonAI; 2) pricing actions for MLCC, 3) pricing actions for tantalum, resistors, magnetics, etc., 4) customer inventory levels, 5) similarities and differences in this cycle vs. the last cycle (2018), 6) view on midrange/low-end capacity shortage in CY27.
Reiterate OW with price target at NT$1,465: This implies ~31x CY28e P/E; however, PEG is only 0.85x. We favor Yageo for its scale, broad product portfolio across all passive components, and leverage to an improving industry cycle.
Idea
| Morgan Stanley Taiwan Limited+ Howard Kao Equity Analyst Howard.Kao@morganstanley.com | +886 2 2730-2989 |
|---|---|
| Irene Yen Research Associate Irene.Yen@morganstanley.com | +886 2 2730-2869 |
| Morgan Stanley Asia Limited+ Andy Meng, CFA Equity Analyst Andy.Meng@morganstanley.com | +852 2239-7689 |

Yageo Corp. (2327.TW, 2327 TT)
Greater China Technology Hardware | Taiwan
Stock Rating Industry View
Price target
Up/downside to price target (%)
Shr price, close (Jul 21, 2026)
52-Week Range
Sh out, dil, curr (mn)
Mkt cap, curr (mn)
EV, curr (mn)
Avg daily trading value (mn)
Overweight In-Line
NT$1,465.00
119
NT$670.00
NT$1,220.00-126.00
1,997
NT$1,337,899
NT$1,354,638
NT$15,806
| Fiscal Year Ending | 12/25 | 12/26e | 12/27e | 12/28e |
|---|---|---|---|---|
| EPS (NT$)** | 11.51 | 20.11 | 34.23 | 46.87 |
| Prior EPS (NT$)** | - | 20.59 | 35.13 | 48.00 |
| EPS (NT$)§ | 11.61 | 19.05 | 30.11 | 43.25 |
| Revenue, net (NT$ mn) | 132,930 | 180,835 | 249,369 | 305,345 |
| EBITDA (NT$ mn) | 39,635 | 60,272 | 97,062 | 130,101 |
| ModelWare net inc (NT | 23,634 | 41,299 | 70,290 | 96,242 |
| $ mn) | ||||
| P/E | 20.1 | 33.3 | 19.6 | 14.3 |
| P/BV | 2.7 | 6.3 | 5.2 | 4.4 |
| RNOA (%) | 12.0 | 20.5 | 36.8 | 52.0 |
| ROE (%) | 14.5 | 23.7 | 32.3 | 36.7 |
| EV/EBITDA | 12.4 | 21.9 | 13.1 | 9.3 |
| Div yld (%) | 2.2 | 0.9 | 1.8 | 3.1 |
| FCF yld ratio (%)** | 6.6 | 3.5 | 5.4 | 7.1 |
| Leverage (EOP) (%) | 9.6 | (15.5) | (31.6) | (43.4) |
Unless otherwise noted, all metrics are based on Morgan Stanley ModelWare framework
- ** = Based on consensus methodology
- § = Consensus data is provided by Refinitiv Estimates
e = Morgan Stanley Research estimates
Morgan Stanley does and seeks to do business with companies covered in Morgan Stanley Research. As a result, investors should be aware that the firm may have a conflict of interest that could affect the objectivity of Morgan Stanley Research. Investors should consider Morgan Stanley Research as only a single factor in making their investment decision.
For analyst certification and other important disclosures, refer to the Disclosure Section, located at the end of this report.
+= Analysts employed by non-U.S. affiliates are not registered with FINRA, may not be associated persons of the member and may not be subject to FINRA restrictions on communications with a subject company, public appearances and trading securities held by a research analyst account.
M
AlphaSignals Earnings Preview
Focus KPI
Yageo Corp.
2Q OpM
Focus KPI Surprise
Likely upside surprise
Likely impact to consensus EPS*
Modest revision higher
- We estiamte 2Q OpM at 26.8% (+170bps q/q), which is 20bps above the Street.
*Likely impact to consensus EPS is for the next 12 months
Source: Company data, Morgan Stanley Research
2327.TW
Idea
Revenue
Jun-26
3,961
Jun-25
3,185
y/y
24%
1026
9,538
M
NPM
2Q26 Results Preview
8.6%
Exhibit 1: 2Q26 Results Preview
| Results | Results | Results | Results | Results | Results |
|---|---|---|---|---|---|
| NT$mn | Actual | QoQ | YoY | Cons | Variance |
| Net sales | 44,165 | 16% | 35% | 43,058 | 3% |
| COGS | -27,017 | 14% | 28% | -26,206 | 3% |
| Gross profit | 17,148 | 18% | 47% | 16,853 | 2% |
| Operating expenses | -5,290 | 7% | 15% | -5,376 | -2% |
| Operating income | 11,858 | 23% | 68% | 11,476 | 3% |
| Non-operating income | 700 | -2% | NM | 537 | 30% |
| Pre-tax income | 12,558 | 22% | 79% | 12,013 | 5% |
| Income tax | -3,391 | 48% | 68% | -2,837 | 20% |
| Net income | 9,131 | 14% | 83% | 9,176 | 0% |
| EPS (NT$) | 4.45 | 14% | 83% | 4.47 | 0% |
| Margins (%) | ppt | ppt | ppt | ||
| Gross margin | 38.8% | 0.7 | 3.3 | 39.1% | -0.3 |
| Operating margin | 26.8% | 1.7 | 5.4 | 26.7% | 0.2 |
| Pre-tax margin | 28.4% | 1.4 | 7.0 | 27.9% | 0.5 |
| Net margin | 20.7% | -0.3 | 5.4 | 21.3% | -0.6 |
Source: Visible Alpha, Morgan Stanley Research estimates (E).
Walsin Tech
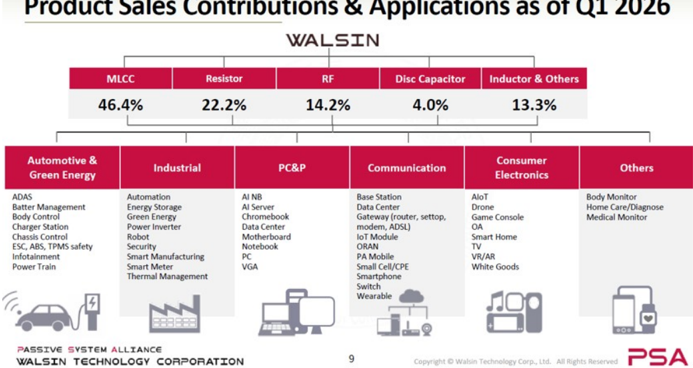
On July 21, Walsin Tech (2492.TW, Not Covered) disclosed its preliminary June profits, with its net profit margin improving to 18.1% for the month of June, vs. 8.6% in 1Q26, or a 950bps improvement. As of 1Q, Walsin's MLCC revenue mix is 46.4% MLCCs, 22.2% resistors, and 13.3% inductors. So combined MLCCs + resistors = 68.6% of total revenue, which is higher than Yageo's 33%. Thus, we do not expect Yageo to show such a strong margin improvement in June. But we do think this implies that pricing is picking up and we think Yageo's guidance in 3Q should reflect this. And we think Yageo's management and tone in the earnings call will likely reflect this as well (assuming there is no one-off impact driving Walsin Tech's meaningful margin improvements in the month of June).
Exhibit 2: Walsin Tech's preliminary June profits show meaningful margin improvement vs 1Q26
Source: Company data, Morgan Stanley Research.
Source: Company data.
Details for Yageo's 2Q26 Earnings Virtual NDR Conference Call
Pre-registration is required.
Date and time: July 29, Wednesday, 4.00 PM Taiwan / HK / China / Singapore
Speakers: Mr. David Wang (President & CEO), Mr. Eddie Chen (Co-COO), Mr. Claudio Lollini (Co-COO), Mr. Gavin Zhong (CFO)
Replay will be available through the same webcast link post-event. Only pre-registered clients will be allowed to join the webcast.
Charts
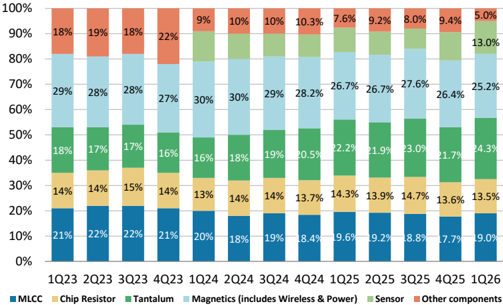
Exhibit 4: Quarterly Sales, by Product, 1Q23-1Q26
Source: Company data, Morgan Stanley Research
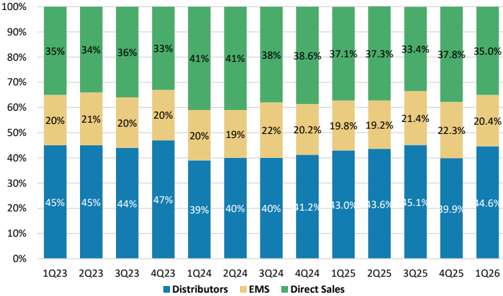
Exhibit 6: Quarterly Sales, by Channel, 1Q23-1Q26
Source: Company data, Morgan Stanley Research
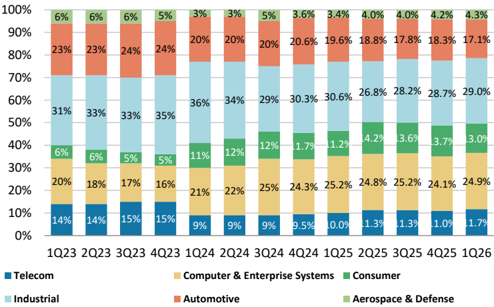
Exhibit 8: Quarterly Sales, by Segment, 1Q23-1Q26
Source: Company data, Morgan Stanley Research
Exhibit 5: Annual Sales, by Product, 2018-25
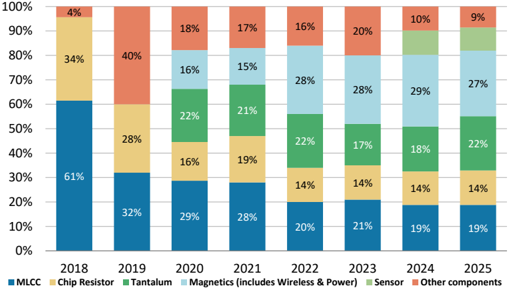
Source: Company data, Morgan Stanley Research
Exhibit 7: Annual Sales, by Channel, 2018-25
Source: Company data, Morgan Stanley Research
Exhibit 9: Annual Sales, by Segment, 2018-25
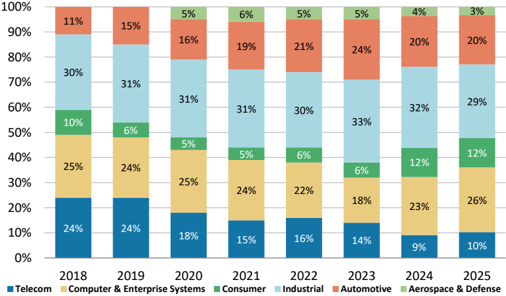
Source: Company data, Morgan Stanley Research
M
Earnings Estimates Changes
We fine-tune our model, resulting in 2-3% decreases in our CY26-28 EPS estimates.
Exhibit 10: Earnings Estimates
| 2026e Earnings Estimates | 2026e Earnings Estimates | 2026e Earnings Estimates | 2027e Earnings Estimates | 2027e Earnings Estimates | 2027e Earnings Estimates | 2028e Earnings Estimates | 2028e Earnings Estimates | 2028e Earnings Estimates | |
|---|---|---|---|---|---|---|---|---|---|
| NT$ mn | New | Old | Variance | New | Old | Variance | New | Old | Variance |
| Net sales | 180,835 | 180,835 | 0% | 249,369 | 249,369 | 0% | 305,345 | 305,345 | 0% |
| COGS | -108,778 | -107,886 | 1% | -137,335 | -135,342 | 1% | -157,706 | -155,051 | 2% |
| Gross profit | 72,058 | 72,950 | -1% | 112,034 | 114,027 | -2% | 147,639 | 150,294 | -2% |
| Operating expenses | -21,255 | -20,858 | 2% | -24,136 | -23,740 | 2% | -26,406 | -26,033 | 1% |
| Operating income | 50,803 | 52,092 | -2% | 87,898 | 90,287 | -3% | 121,233 | 124,261 | -2% |
| Non-operating income | 2,949 | 2,949 | 0% | 3,425 | 3,425 | 0% | 3,844 | 3,844 | 0% |
| Pre-tax income | 53,751 | 55,040 | -2% | 91,323 | 93,712 | -3% | 125,077 | 128,105 | -2% |
| Income tax | -12,305 | -12,604 | -2% | -20,887 | -21,434 | -3% | -28,688 | -29,383 | -2% |
| Net income | 41,299 | 42,289 | -2% | 70,290 | 72,131 | -3% | 96,242 | 98,575 | -2% |
| EPS (NT$) | 20.11 | 20.59 | -2% | 34.23 | 35.13 | -3% | 46.87 | 48.00 | -2% |
| Margins (%) | ppt | ppt | ppt | ||||||
| Gross margin | 39.8% | 40.3% | -0.5 | 44.9% | 39.5% | 5.4 | 48.4% | 49.2% | -0.9 |
| Operating margin | 28.1% | 28.8% | -0.7 | 35.2% | 27.0% | 8.3 | 39.7% | 40.7% | -1.0 |
| Pre-tax margin | 29.7% | 30.4% | -0.7 | 36.6% | 29.0% | 7.7 | 41.0% | 42.0% | -1.0 |
| Net margin | 22.8% | 23.4% | -0.5 | 28.2% | 22.2% | 6.0 | 31.5% | 32.3% | -0.8 |
Source: Morgan Stanley Research (e) estimates
Where we are vs. consensus earnings estimates
We are 4%, 12%, and 11% above the Street on 2026, 2027 and 2028 EPS estimates, respectively.
Exhibit 11: Morgan Stanley estimates vs. consensus
| Yageo | MSe | MSe | MSe | Consensus | Consensus | Consensus | Variance | Variance | Variance |
|---|---|---|---|---|---|---|---|---|---|
| Yageo | 2026 | 2027 | 2028 | 2026 | 2027 | 2028 | 2026 | 2027 | 2028 |
| Revenue | 180,835 | 249,369 | 305,345 | 179,544 | 237,982 | 292,942 | 1% | 5% | 4% |
| GM | 39.8% | 44.9% | 48.4% | 39.7% | 44.3% | 48.2% | 0.1% | 0.6% | 0.2% |
| OpM | 28.1% | 35.2% | 39.7% | 27.4% | 33.2% | 37.2% | 0.7% | 2.1% | 2.5% |
| Net income | 41,299 | 70,290 | 96,242 | 39,732 | 62,987 | 86,767 | 4% | 12% | 11% |
| EPS | 20.11 | 34.23 | 46.87 | 19.35 | 30.67 | 42.25 | 4% | 12% | 11% |
Source: Visible Alpha, Morgan Stanley Research estimates.
M
Price target discussion and valuation methodology
We lower our 12-month price target to NT$1,465 (from NT$1,515): This is driven by the lowered EPS estimates in CY26-28. Our price target is our base case value, derived from our residual income valuation model. Similar to our analysis of other tech hardware companies within our coverage, we think this methodology provides the most accurate value of the firm by taking into account the cost of equity.
Our key assumptions are all unchanged, including:
- Cost of equity of 7.8%:
- ° Risk-free rate of 1.0% (10-year Taiwanese government bond yield);
- ° Equity risk premium of 6.8%;
- ° Beta of 1.1;
- Medium-term growth rate of 16%;
- Terminal growth rate of 3%.
Our price target implies 43x 2027e P/E and 31x 2028e P/E. These are above its five-year historical range of 8x to 18x, which we view as justified considering its longer-term transformation story to become a global total solutions provider, moving from passive into active components. In addition, compared to global passive component peers, we believe Yageo stock remains undervalued with higher ROE and margins but lower P/E vs. Japanese peers (which trade on an average at 30x+ P/E).
Our bull and bear case scenario values are also lowered to NT$2,075 and NT$685, respectively.
Exhibit 12: Residual Income (RI) Model
| 2026E | 2027E | 2028E | 2029E | 2030E | 2031E | 2032E | 2033E | 2034E | 2035E | 2036E | ||
|---|---|---|---|---|---|---|---|---|---|---|---|---|
| Total Equity | 217,731 | 262,495 | 315,778 | 363,206 | 418,223 | 482,042 | 556,072 | 641,947 | 741,562 | 857,116 | 955,798 | |
| Net Profit | 41,299 | 70,290 | 96,242 | 111,641 | 129,503 | 150,224 | 174,259 | 202,141 | 234,483 | 272,001 | 280,161 | |
| Return on Equity | 21.1% | 29.3% | 33.3% | 32.9% | 33.1% | 33.4% | 33.6% | 33.7% | 33.9% | 34.0% | 30.9% | |
| Cost of Equity | 7.8% | 7.8% | 7.8% | 7.8% | 7.8% | 7.8% | 7.8% | 7.8% | 7.8% | 7.8% | 7.8% | 7.8% |
| Residual Income | 23,186 | 46,842 | 67,004 | 79,338 | 92,201 | 107,120 | 124,426 | 144,500 | 167,785 | 194,795 | 198,399 | |
| Spread | 13.3% | 21.5% | 25.5% | 25.1% | 25.4% | 25.6% | 25.8% | 26.0% | 26.1% | 26.3% | 23.1% | |
| Beginning Equity Capital | 217,731 | |||||||||||
| PV of Forecast Period | 757,427 | |||||||||||
| PV of Continuing Value | 2,033,261 | |||||||||||
| Equity Value | 3,008,420 | |||||||||||
| No. of Shares | 2,054 | |||||||||||
| Projected Price | 1,465.0 | |||||||||||
| Implied 2027e PE | 43x | |||||||||||
| Implied 2028e PE | 31x |
Source: Morgan Stanley Research (E) estimates.
M
Exhibit 13: Yageo - P/E
Source: TEJ, Morgan Stanley Research.
Exhibit 15: MLCC peers - operating margins
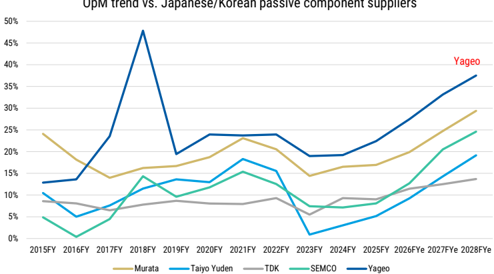
Source: Visible Alpha.
Exhibit 14: Yageo - P/B
Exhibit 16: 2027e P/E vs. ROE
Source: Morgan Stanley Research estimates.
M
Risk Reward - Yageo Corp. (2327.TW) Risk Reward - Yageo Corp. (2327.TW)
Demand looks stronger and price increases appear likely - stay OW
NT$1,465.00 PRICE TARGET
Base case, multistage residual income valuation model. Key assumptions: cost of equity 7.8% (risk-free rate 1%, equity risk premium 6.8% and beta of 1.1), medium-term growth rate 16%, terminal growth rate 3%.
BASE CASE
31x 2028e EPS
Demand remains strong into 2027-28: 1)
Utilization remains high for premium products. 2) Utilization for standard products stabilizes at 70%+ with resilient consumer tech demand. 3) Transformation and synergies are ongoing with continued active initiatives. 4) Yageo continues to drive expansion into the AI realm and slowly gains market share. 5) High utilization rates and inflationary raw material costs result in continued price hikes.
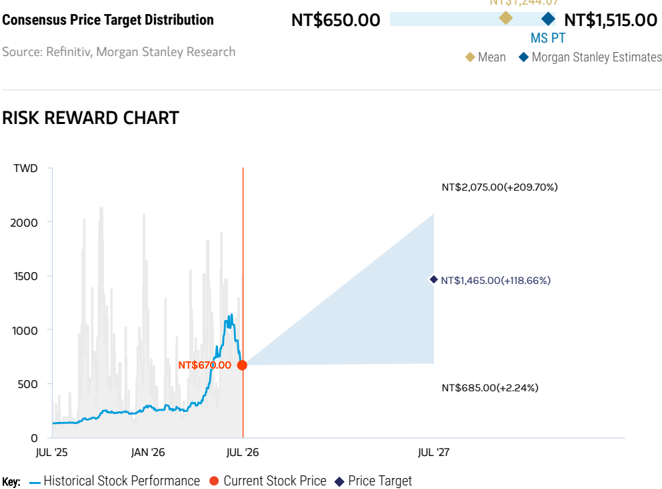
Source: Refinitiv, Morgan Stanley Research
BULL CASE
NT$2,075.00
44x 2028e EPS
Demand continues to grow faster than
expected in 2027-28: 1) Demand improves significantly, driving pricing power for Yageo in premium and standard products alike. 2) Yageo makes meaningful progress into AI, driving significant share gains. 3) Yageo takes on more acquisition initiatives to further widen its product portfolio. 4) Severe undersupply leads to continued price hikes for an extended period of time, which helps expand Yageo's margins in 2027-28.
OVERWEIGHT THESIS
- There is fear that leading Japanese and Korean MLCC suppliers are shifting more capacity to cater to the high end, resulting in undersupply for the midrange/low end.
- The same narrative that drove the 2018 cycle is now back in play.
- Utilization rates are increasing, so suppliers are expecting price hikes for the midrange/low end. Distributors and ODMs are both building inventory.
- AI demand is growing and tantalum capacitor pricing may show further price increases in 2H.
- All of this should help support a re-rating in the stock.
Risk Reward Themes
Electric Vehicles: Positive | Self-help: Positive | Special Situation: Positive
BEAR CASE
15x 2028e EPS
Earnings erode as macro conditions weaken and demand falls again in 2027-28: 1) Non-AI
demand weakens from 2H26 onward, despite AI demand remaining strong. 2) Pricing power shifts to end customers with heightened competition among peers. 3) Acquisitions do not bear fruit, resulting in layoffs and leading to cost burdens. 4) Automotive and industrial end demand does not recover, hampering Yageo's premium business. 5) Yageo does not make any material advancements into AI.
NT$685.00
M
Risk Reward - Yageo Corp. (2327.TW)
KEY EARNINGS INPUTS
| Drivers | Dec 2025 | Dec 2026e | Dec 2027e | Dec 2028e |
|---|---|---|---|---|
| MLCC ASP y/y (%) | 0.6 | 29.8 | 67.4 | 14.9 |
| MLCC GM (%) | 31.7 | 36.2 | 44.9 | 49 |
| r-chip ASP y/y (%) | 0.8 | 8.5 | 45.8 | 27.3 |
| r-chip GM (%) | 43.4 | 44 | 53.1 | 58.1 |
INVESTMENT DRIVERS
- Transformation into global total solutions service provider
- Premium/standard sales mix
- Utilization rates and capacity
- Inventory and pricing
MS ALPHA MODELS
3 Month Horizon
Source: Refinitiv, FactSet, Morgan Stanley Research; 1 is the highest favored Quintile and 5 is the least favored Quintile
RISKS TO PT/RATING
RISKS TO UPSIDE
- Faster-than-expected revenue/profit recognition from stronger AI server/notebook demand
- Further price hikes led by stronger pricing power arising from better demand and/or tighter supply
RISKS TO DOWNSIDE
- A sudden bursting of demand for AI
- Inventory risk
- Consumer electronics demand risk
OWNERSHIP POSITIONING
Inst. Owners, % Active
61.9%
Source: Refinitiv, Morgan Stanley Research
MS ESTIMATES VS. CONSENSUS
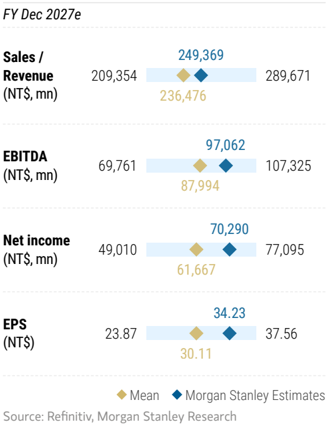
M
Financials
Exhibit 17: Quarterly Earnings Estimates
| 1Q25 | 2Q25 | 3Q25 | 4Q25 | 1Q26 | 2Q26E | 3Q26E | 4Q26E | 2025 | 2026E | 2027E | 2028E | |
|---|---|---|---|---|---|---|---|---|---|---|---|---|
| Net sales | 31,104 | 32,771 | 33,087 | 35,968 | 38,166 | 44,165 | 47,614 | 50,891 | 132,930 | 180,835 | 249,369 | 305,345 |
| Gross profit | 11,086 | 11,652 | 11,974 | 13,417 | 14,542 | 17,148 | 19,211 | 21,157 | 48,130 | 72,058 | 112,034 | 147,639 |
| Operating income | 6,463 | 7,044 | 7,562 | 8,732 | 9,613 | 11,858 | 13,765 | 15,567 | 29,801 | 50,803 | 87,898 | 121,233 |
| Pre-tax income | 7,173 | 7,028 | 8,212 | 8,706 | 10,325 | 12,558 | 14,514 | 16,355 | 31,120 | 53,751 | 91,323 | 125,077 |
| Net income | 5,530 | 4,998 | 6,356 | 6,751 | 8,001 | 9,131 | 11,284 | 12,884 | 23,634 | 41,299 | 70,290 | 96,242 |
| EPS | 2.69 | 2.43 | 3.10 | 3.29 | 3.90 | 4.45 | 5.49 | 6.27 | 11.51 | 20.11 | 34.23 | 46.87 |
| Gross Margin (%) | 35.6 | 35.6 | 36.2 | 37.3 | 38.1 | 38.8 | 40.3 | 41.6 | 36.2 | 39.8 | 44.9 | 48.4 |
| Operating Margin (%) | 20.8 | 21.5 | 22.9 | 24.3 | 25.2 | 26.8 | 28.9 | 30.6 | 22.4 | 28.1 | 35.2 | 39.7 |
| Net Margin (%) | 17.8 | 15.3 | 19.2 | 18.8 | 21.0 | 20.7 | 23.7 | 25.3 | 17.8 | 22.8 | 28.2 | 31.5 |
Source: Company data, Morgan Stanley Research (E) estimates.
M
Exhibit 18: Consolidated Financial Summary
Consolidated Income Statement
| NT$mn (Year End Dec 31) | 2025 | 2026E | 2027E | 2028E |
|---|---|---|---|---|
| Net sales | 132,930 | 180,835 | 249,369 | 305,345 |
| Gross profit | 48,130 | 72,058 | 112,034 | 147,639 |
| Operating income | 29,801 | 50,803 | 87,898 | 121,233 |
| Pre-tax income | 31,120 | 53,751 | 91,323 | 125,077 |
| Net income | 23,634 | 41,299 | 70,290 | 96,242 |
| Reported EPS (NT$) | 11.51 | 20.11 | 34.23 | 46.87 |
Consolidated Balance Sheet
| NT$mn (Year End Dec 31) | 2025 | 2026E | 2027E | 2028E |
|---|---|---|---|---|
| Cash | 81,473 | 130,886 | 179,037 | 232,148 |
| Total Assets | 390,789 | 455,962 | 528,446 | 602,450 |
| Total Liabilities | 216,793 | 238,231 | 265,951 | 286,672 |
| Total Shareholders' Equity | 173,997 | 217,731 | 262,495 | 315,778 |
Source: Company data, Morgan Stanley Research (E) estimates.
Consolidated Financial Ratios
| 2025 | 2026E | 2027E | 2028E | |
|---|---|---|---|---|
| Gross margin | 36.2 | 39.8 | 44.9 | 48.4 |
| Operating margin | 22.4 | 28.1 | 35.2 | 39.7 |
| Net margin | 17.8 | 22.8 | 28.2 | 31.5 |
| Cash dividend payout (%) | 52% | 60% | 60% | 60% |
| Net Debt/Equity (%) | 26% | -2% | -21% | -34% |
| ROAE (%) | 14% | 21% | 29% | 33% |
| ROAA (%) | 6% | 10% | 14% | 17% |
M
Disclosure Section
Analyst Certification
The following analysts hereby certify that their views about the companies and their securities discussed in this report are accurately expressed and that they have not received and will not receive direct or indirect compensation in exchange for expressing specific recommendations or views in this report: Howard Kao; Andy Meng, CFA.
以下純法遵揭露文字(Global Research Conflict Management Policy、Stock Ratings Distribution、Industry Coverage 分析師覆蓋名單等)已省略,無研究價值;如需查證請調閱 報告_MS_國巨2327_20260722_original.pdf 原檔。