PDF 原檔:報告_MS_和碩4938_20260812_original.pdf
trim 腳本誤砍,已改用完整解析版
本份報告第 1 頁頁腳含免責聲明字串,pdf_trim.py 誤判整份為免責聲明而砍到只剩 99 行。此檔內容已改用 proceed/3.unprocessed_data/parsed/ms_Pegatron_20260812.md(完整解析版,802 行)覆蓋,保留報告完整內容(2Q26 結果、AI server 展望、估值方法、財務報表、風險)。
圖片清單(已驗證 2026-08-13)
| 檔名 | size | 分類 | 親眼所見內容 |
|---|---|---|---|
報告_MS_和碩4938_20260812_001.png |
66KB | 裝飾·banner | "Asia Summer School 2026" 泳池主題廣告 banner,非資料圖 |
報告_MS_和碩4938_20260812_002.png |
58KB | 真資料圖 | Risk Reward 圖:Consensus Price Target Distribution(Mean NT$58 vs MS PT NT$99.6 附近)+ 股價走勢與 Bull/Base/Bear 目標價扇形圖(NT$131 / NT$96 / NT$69,現價 NT$91.40) |
報告_MS_和碩4938_20260812_003.png |
20KB | 未驗證 | <40KB,未 Read(預設非資料圖) |
報告_MS_和碩4938_20260812_004.png |
20KB | 未驗證 | <40KB,未 Read(預設非資料圖) |
報告_MS_和碩4938_20260812_005.png |
41KB | 真資料圖 | MS Estimates vs Consensus 表:FY Dec 2027e Sales/EBITDA/Net income/EPS 的 Mean 與 MS 估計對比點狀圖(Sales 2,039,359 vs consensus mean 1,393,842;EPS 7.71 vs mean 6.76) |
報告_MS_和碩4938_20260812_006.png |
21KB | 未驗證 | <40KB,未 Read(預設非資料圖) |
報告_MS_和碩4938_20260812_007.png |
54KB | 真資料圖 | Pegatron PE Band 歷史本益比走勢圖(2021-2026),標示 +1SD 14.1x、平均 11.3x、-1SD 8.5x |
報告_MS_和碩4938_20260812_008.png |
62KB | 真資料圖 | 股價、目標價與評等沿革圖(2023/08-2026/08),標示歷次評等變動(E/I、U/I)與目標價數字(63→131→58→85 等) |
分類只有三類:
真資料圖/裝飾·logo·banner/文字卡;<40KB 未 Read 者標記「未驗證」(預設非資料圖,未逐張確認)。
原始內容
M August 12, 2026 07:19 PM GMT
Pegatron Corporation | Asia Pacific
2Q in line, but servers tracking above expectations
| What's Changed | To | |
|---|---|---|
| Price Target | NT$85.00 | NT$96.00 |
AlphaSignals Earnings Reaction
Unchanged
Impact to our thesis
Source: Company data, Morgan Stanley Research
Similar to other OEM and ODMs, Pegatron's AI server momentum has been better than expected. However, valuation at 12x CY27e P/E (above 5-year historical average) keeps us EW.
As we had written previously, Pegatron is seeing increasing revenue from AI servers, with momentum tracking ahead of prior expectations. Computing revenue rose 85% q/q in 2Q26 on strong server shipments and higher PC ASPs, and 3Q server revenue should continue to increase q/q on higher GB300 and HGX shipments. Management now expects full-year server revenue growth to exceed its previous 10x y/y growth target, and for servers to become one of its top two or three business groups in terms of revenue contribution, within 1-2 years, supported by robust demand and high ASPs. Inventory increased sharply to support current orders and prospective demand, including GB300 programs that are expected by management to extend into 2027.
PC demand remains challenged; smartphones should benefit from seasonality:
Management expects 2H26 PC unit volumes to decline at a single-digit %, with uncertainties driven by component availability. However, PC revenue should be more resilient, aided by higher component prices. As for communications, revenue should be supported by new smartphone model launches, with management mentioning staggered ones in 2H26 and 1Q27, though memory supply remains a swing factor for actual shipment timing.
Like most ODMs, Pegatron needs to raise capital for procurement of key
components in AI servers: The company said it plans to issue corporate bonds of no more than NT$20B and ECB of no more than US$500M. The raised capital will be used to support its AI server business. Its CY26 capex plan is unchanged at US $300-350M. New capacity spending is to mainly target Taiwan and North America; further investment in Southeast Asian capacity is possible, although much of the factory infrastructure is already in place.
PT increases by 13% to NT$96; stay EW: Our PT implies 12.5x 2027e P/E, higher than its five-year historical average of 11.3x, which we view as fair due to rising exposure to AI servers, with key customers such as Together AI.
Meaningful upside
Financial results versus consensus
Modest revision higher
Direction of next 12-month consensus EPS
Update
| Morgan Stanley Taiwan Limited+ Howard Kao Equity Analyst Howard.Kao@morganstanley.com | +886 2 2730-2989 |
|---|---|
| Irene Yen Research Associate Irene.Yen@morganstanley.com | +886 2 2730-2869 |
| Morgan Stanley Asia Limited+ Andy Meng, CFA Equity Analyst Andy.Meng@morganstanley.com | +852 2239-7689 |

Pegatron Corporation (4938.TW, 4938 TT)
Greater China Technology Hardware | Taiwan
| Stock Rating | Equal-weight |
|---|---|
| Industry View | In-Line |
| Price target | NT$96.00 |
| Up/downside to price target (%) | 5 |
| Shr price, close (Aug 12, 2026) | NT$91.40 |
| 52-Week Range | NT$102.50-67.50 |
| Sh out, dil, curr (mn) | 2,614 |
| Mkt cap, curr (mn) | NT$238,899 |
| EV, curr (mn) | NT$204,785 |
| Avg daily trading value (mn) | NT$956 |
| Fiscal Year Ending | 12/25 | 12/26e | 12/27e | 12/28e |
|---|---|---|---|---|
| EPS (NT$)** | 5.39 | 5.70 | 7.71 | 8.31 |
| Prior EPS (NT$)** | - | 5.39 | 7.61 | 8.04 |
| EPS (NT$)§ | 4.92 | 5.61 | 6.76 | 7.43 |
| Revenue, net (NT$ mn) | 1,117,160 | 1,264,895 | 2,039,359 | 2,297,407 |
| EBITDA (NT$ mn) | 27,307 | 34,863 | 45,453 | 49,331 |
| ModelWare net inc (NT$ mn) | 14,403 | 15,235 | 20,613 | 22,192 |
| P/E | 12.7 | 16.0 | 11.8 | 11.0 |
| P/BV | 0.7 | 0.9 | 0.9 | 0.8 |
| RNOA (%) | 5.5 | 7.1 | 10.4 | 10.8 |
| ROE (%) | 6.0 | 6.2 | 7.7 | 8.0 |
| EV/EBITDA | 5.5 | 5.3 | 4.0 | 4.1 |
| Div yld (%) | 6.1 | 0.0 | 0.0 | 0.0 |
| FCF yld ratio (%)** | 5.3 | 4.8 | 4.1 | (3.3) |
| Leverage (EOP) (%) | (21.9) | (27.5) | (27.2) | (20.4) |
Unless otherwise noted, all metrics are based on Morgan Stanley ModelWare framework
- ** = Based on consensus methodology
- § = Consensus data is provided by Refinitiv Estimates
e = Morgan Stanley Research estimates
Risk Reward - Pegatron Corporation (4938.TW)
Growth hit by iPhone EMS business despite diversification efforts
NT$96.00 PRICE TARGET
Base case, sum-of-the-parts. Recurring core business earnings: 9x 2027e P/E, within ODMs' historical trading range of 8x to 12x since 2011, and below Pegatron's five-year average of 11.3x. We view our target P/E multiple as fair, reflecting a weaker end demand outlook for Pegatron's smartphone and PC business. We value its stakes in AsRock, Kinsus and Azure based on their market values in proportion to Pegatron's holdings.
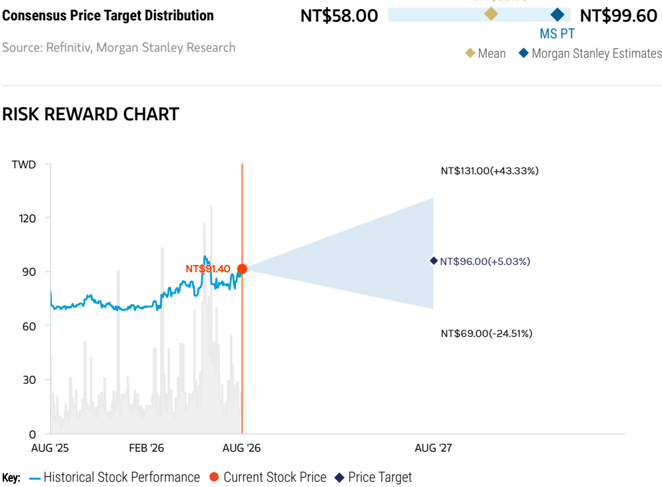
Source: Refinitiv, Morgan Stanley Research
BULL CASE
16.9x 2027e EPS
Stronger growth thanks to iPhone volumes and a much-better-than-expected EV contribution: We also assume the EV business contributes a double-digit share of revenue. Contributions from Kinsus and Luxshare investments are higher than in our base case.
NT$131.00
BASE CASE
12.4x 2027e EPS
Limited growth from core business with decent investment gains: Luxshare's competition in iPhone EMS business remains an overhang on the stock, and its EV business (single-digit revenue contribution) is still too small for us to be bullish.
NT$96.00
EQUAL-WEIGHT THESIS
- We expect Pegatron to not benefit as much vs. its peers (e.g., Hon Hai) from increased AI iPhone sales, as its exposure to iPhone is skewed toward the non-premium models.
- Fierce competition from Luxshare in iPhone EMS also remains an overhang.
- Server business prospects are strong, but the contribution is still not significant enough to offset the weakness of demand for consumer electronics.
- Auto/EV business could continue to decelerate in 2026, due to intensifying competition from Chinese brands.
- We view current valuation as insufficiently attractive.
BEAR CASE
8.9x 2027e EPS
Revenue decline on weaker iPhone volumes and business challenges from significant share loss to Luxshare and declining profitability from its consolidated subsidiaries such as Kinsus. EV contribution also declines on a y/y basis owing to share loss.
NT$69.00
KEY EARNINGS INPUTS
| Drivers | Dec 2025 | Dec 2026e | Dec 2027e | Dec 2028e |
|---|---|---|---|---|
| iPhone shipment y/y (%) | (3.4) | (8.5) | 5 | 5 |
| iPhone OPM (%) | 0.2 | 0.2 | 0.5 | 0.5 |
INVESTMENT DRIVERS
- iPhone demand
- Global NB/broadband demand
- Game console demand
- EV demand
- Margin performance
RISKS TO PT/RATING
RISKS TO UPSIDE
- Better-than-expected iPhone volumes.
- Stronger PC shipments as a result of better component supply.
- Better-than-expected demand from EVs.
RISKS TO DOWNSIDE
- Weaker iPhone demand.
- Margin erosion from poor resource planning.
- Lower contribution from non-PC products.
MS ESTIMATES VS. CONSENSUS
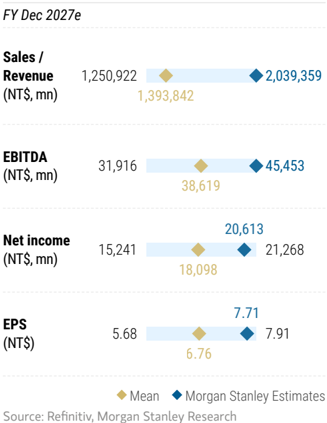
2Q26 results summary
2Q GM was 4.4% (flat q/q), 30bps above MSe but in line with the Street.
2Q OP came in at NT$4.2B (+48% q/q), 3% above MSe and the Street, for OpM of 1.5% (+40bps q/q).
2Q non-op income was higher at NT$3.5B, primarily owing to higher gains on financial asset valuation.
Thus, 2Q NP came in at NT$4.5B (+187% q/q), 37% above MSe and 48% above the Street, for EPS of NT$1.68.
In addition to supply tightness of CPU and memory, which has persisted for some time already, management flagged that shortages of PCB (and its supply chain - CCL and glass fabric) and power-related IC/component (high-cap/vol MLCC, power module, MOSFET, PMIC, etc.) appear to have worsened recently.
Exhibit 1: Pegatron 2Q26 results summary
| Year to Dec. 31 (NT$m) P&L Summary | Actual 2Q26 | Q/Q | Y/Y | Mse 2Q26 | Diff.% | Cons. 2Q26 | Diff.% |
|---|---|---|---|---|---|---|---|
| Net sales | 274,448 | 12% | 3% | 316,300 | -13% | 283,006 | -3% |
| COGS | (262,292) | (303,130) | (270,485) | ||||
| Gross profit | 12,156 | 13% | 45% | 13,170 | -8% | 12,521 | -3% |
| Operating expenses | (7,958) | (9,106) | (8,457) | ||||
| Operating income | 4,198 | 48% | 185% | 4,064 | 3% | 4,064 | 3% |
| Non-operating income | 3,547 | 2,361 | 2,166 | ||||
| Pre-tax income | 7,744 | 124% | 347% | 6,426 | 21% | 6,230 | 24% |
| Income tax | (1,431) | (2,249) | |||||
| Minority interest (paid) received | (1,826) | (890) | |||||
| Net income | 4,488 | 187% | 1461% | 3,287 | 37% | 3,023 | 48% |
| EPS (NT$) | 1.68 | 1.23 | 1.13 | ||||
| Gross margin | 4.4% | 0.0 | 1.3 | 4.2% | 0.3 | 4.4% | 0.0 |
| Operating margin | 1.5% | 0.4 | 1.0 | 1.3% | 0.2 | 1.4% | 0.1 |
| Pretax margin | 2.8% | 1.4 | 2.2 | 2.0% | 0.8 | 2.2% | 0.6 |
| Net margin | 1.6% | 1.0 | 1.5 | 1.0% | 0.6 | 1.1% | 0.6 |
Source: Company data, Visible Alpha, Morgan Stanley Research estimates
AI Server Revenue Contribution
Exhibit 2: Pegatron's AI server revenue and contribution %
Pegatron's AI Server Revenue Contribution (NT$ B)
Source: Morgan Stanley Research estimates.
Estimate Changes
We adjust our model to reflect 2Q26 results and updated guidance from management, and increase our 2026-2028 EPS estimates by 6% for 2026, 1% for 2027, and 3% for 2028. The increase in our 2026 forecast is mainly driven by the 2Q26 non-op income beat.
Exhibit 3: Estimate Changes
| P&L Summary (NT$m) | New 2026E | Old 2026E | Diff.% | New 2027E | Old 2027E | Diff.% | New 2028E | Old 2028E | Diff.% |
|---|---|---|---|---|---|---|---|---|---|
| Net sales | 1,264,895 | 1,315,917 | -4% | 2,039,359 | 1,858,125 | 10% | 2,297,407 | 2,006,048 | 15% |
| Gross profit | 52,731 | 55,030 | -4% | 67,618 | 67,588 | 0% | 72,011 | 71,088 | 1% |
| Operating income | 18,205 | 18,601 | -2% | 26,870 | 26,479 | 1% | 28,822 | 27,859 | 3% |
| Net income | 15,235 | 14,415 | 6% | 20,613 | 20,347 | 1% | 22,192 | 21,491 | 3% |
| EPS (NT$) | 5.70 | 5.39 | 6% | 7.71 | 7.61 | 1% | 8.31 | 8.04 | 3% |
| Gross margin | 4.2% | 4.2% | 3.3% | 3.6% | 3.1% | 3.5% | |||
| Operating margin | 1.4% | 1.4% | 1.3% | 1.4% | 1.3% | 1.4% |
Source: Morgan Stanley Research (E) estimates.
Price Target Discussion and Valuation Methodology
Our SoTP-derived PT (base-case value) rises to NT$96. We apply a P/E multiple of 9x (unchanged) to our estimate of Pegatron's recurring core business earnings for 2027. The increase in our PT is primarily driven by higher market caps for Pegatron's strategic investments.
The 9x P/E multiple is within ODMs' historical trading range of 8-12x since 2011 and below Pegatron's five-year average of 11.3x. We view our target P/E multiple as fair, reflecting weaker end-demand outlooks for Pegatron's smartphone and PC business.
For reference, to derive the historical P/E band for Pegatron's Design and Manufacturing Services (DMS) business, we use the following:
- Pegatron's total market cap;
- Minus the market cap for strategic investments - ASRock (3515.TW), Kinsus (3189.TW) and Azure (3694.TW);
- Minus the market cap for Casetek; and
- Pegatron's DMS-only earnings.
Our bull/bear case scenario values increase by similar magnitudes to the change in our base-case value, to NT$131 and NT$69, respectively.
Exhibit 4: Pegatron: SOTP methodology - We combine the market value of the core business and the strategic investments
| Pegatron - SOTP | |
|---|---|
| NT$mn | 2027e |
| Core business (DMS) | |
| Recurring earning after tax | 17,149 |
| Applied multiples | 9x |
| Market capitalization - (1) | 153,137 |
| Strategic long-term investments market value | |
| ASRock (56% holding) | 15,504 |
| Kinsus (39% holding) | 84,352 |
| Azure (33% holding) | 2,707 |
| Total strategic LT investments - (2) | 102,563 |
| Total market value | 255,700 |
| Outstanding shares | 2,663 |
| Pegatron's price target (NT$) | 96.0 |
Source: Morgan Stanley Research (e) estimates.
Exhibit 5: Pegatron P/E band
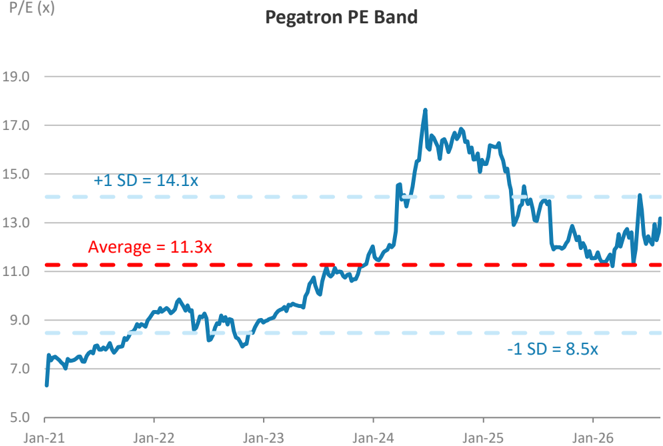
Source: TEJ, Morgan Stanley (e) Research estimates
Financials
Exhibit 6: Quarterly Earnings Estimates
| NT$mn | 1Q25 | 2Q25 | 3Q25 | 4Q25 | 1Q26 | 2Q26 | 3Q26E | 4Q26E | 2025 | 2026E | 2027E | 2028E |
|---|---|---|---|---|---|---|---|---|---|---|---|---|
| Net sales | 272,433 | 267,336 | 257,863 | 319,528 | 244,105 | 274,448 | 357,398 (343,004) | 388,944 | 1,117,160 | 1,264,895 | 2,039,359 | 2,297,407 (2,225,396) |
| Operating income | 2,483 | 1,471 | 3,218 | 4,437 | 2,829 | 4,198 | 5,165 | 6,014 | 11,609 | 18,205 | 26,870 | 28,822 |
| Net income | 4,303 | 287 | 4,545 | 5,267 | 1,561 | 4,488 | 4,295 | 4,891 | 14,403 | 15,235 | 20,613 | 22,192 |
| EPS | 1.61 | 0.11 | 1.70 | 1.97 | 0.58 | 1.68 | 1.61 | 1.83 | 5.39 | 5.70 | 7.71 | 8.31 |
| Gross Margin (%) | 3.7 | 3.1 | 4.2 | 4.1 | 4.4 | 4.4 | 4.0 | 4.0 | 3.8 | 4.2 | 3.3 | 3.1 |
| Operating Margin (%) | 0.9 | 0.6 | 1.2 | 1.4 | 1.2 | 1.5 | 1.4 | 1.5 | 1.0 | 1.4 | 1.3 | 1.3 |
| Net Margin (%) | 1.6 | 0.1 | 1.8 | 1.6 | 0.6 | 1.6 | 1.2 | 1.3 | 1.3 | 1.2 | 1.0 | 1.0 |
Source: Company data, Morgan Stanley Research (E) estimates.
Exhibit 7: Consolidated Financial Summary
| NT$mn (Year End Dec) | 2025 | 2026E | 2027E | 2028E |
|---|---|---|---|---|
| Net sales | 1,117,160 | 1,264,895 | 2,039,359 | 2,297,407 |
| Gross profit | 42,501 | 52,731 | 67,618 | 72,011 |
| Operating income | 11,609 | 18,205 | 26,870 | 28,822 |
| Net income | 14,403 | 15,235 | 20,613 | 22,192 |
| EPS for consensus | 5.39 | 5.70 | 7.71 | 8.31 |
| Cash | 119,380 | 139,689 | 144,082 | 136,375 |
| Total Assets | 623,115 | 682,219 | 895,928 | 982,852 |
| Shareholders' equity | 246,458 | 268,120 | 277,575 | 288,085 |
| ROAE (%) | 5.9 | 5.9 | 7.6 | 7.8 |
| Net Debt/Equity (%) | -21.9 | -27.5 | -27.2 | -20.4 |
| Adjusted cash dividend (NT$) | 4.0 | 4.2 | 4.4 | 4.6 |
| Yield (%) | 5.7 | 6.0 | 6.3 | 6.6 |
Source: Company data, Morgan Stanley Research (E) estimates.
Stock Price, Price Target and Rating History (See Rating Definitions)
Pegatron Corporation (4938.TW) - As of 08/12/26 GMT in TW
Industry : Greater China Technology Hardware
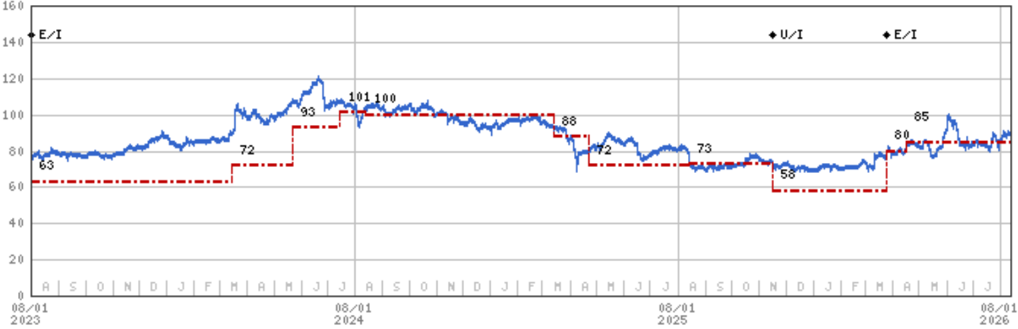
Industry View: Attractive
Disclosure Section(節錄)
The information and opinions in Morgan Stanley Research were prepared or are disseminated by Morgan Stanley Asia Limited and/or its affiliates. Morgan Stanley uses a relative rating system (Overweight/Equal-weight/Not-Rated/Underweight), not Buy/Hold/Sell. Unless otherwise specified, the time frame for price targets included in Morgan Stanley Research is 12 to 18 months.
(完整法律免責聲明、評等分佈統計、產業覆蓋名單見原始 PDF:報告_MS_和碩4938_20260812_original.pdf)