PDF 原檔:報告_MS_亞德客1590_20261012_original.pdf
圖片清單(已驗證 2026-10-13)
| 檔名 | size | 分類 | 親眼所見內容 |
|---|---|---|---|
報告_MS_亞德客1590_20261012_001.png |
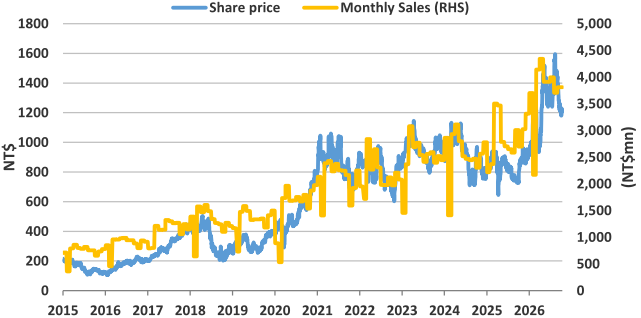
52KB | 真資料圖 | Exhibit 1:雙軸折線+柱狀圖,標題「AirTAC monthly sales vs its share price since 2015」;藍線為股價(NT$,左軸,2015–2026 逐年刻度),橘色柱為月營收(NT$mn,右軸),兩者長期同向攀升、2024 以後明顯加速 |
報告_MS_亞德客1590_20261012_002.png |
59KB | 真資料圖 | AirTAC(1590.TW)評等與目標價沿革圖,藍線為股價,紅色虛線階梯為歷次目標價(1050→1150→1130→1050→1000→1050→1030→1130→1000→1180→1230→2000),左側標記 E/I(Initiate)、中段標記 O/I(Overweight 起始);時間軸 2023/10–2026/10 |
報告_MS_亞德客1590_20261012_003.png |
58KB | 真資料圖 | Hiwin(2049.TW)評等與目標價沿革圖,藍線為股價,紅色虛線階梯為歷次目標價(205→220→210→205→225→310→160→210→300→380→400→450),標記 E/I、U/I(Underweight)、O/I(Overweight)切換點;時間軸 2023/10–2026/10 |
原始內容
M Update October 12, 2026 04:24 PM GMT
AirTAC International | Asia Pacific
September Sales Rose 3% MoM, 27% YoY
Here we focus on Airtac's monthly sales, which we belie e could be a catalyst for its share price.
What's new:
- September sales came in at NT$3,811mn (+3% MoM/+27% YoY .
- 3Q26 revenue was NT$11,512mn (-5% QoQ/+40% YoY , in line with our estimate of NT$11,586mn (-5% QoQ/+41% YoY but slightly better than consensus at NT$11,215mn (-8% QoQ/+36% YoY .
- By segment, shipments of machine tool (+35% YoY , energy & lighting (+30% YoY , electronics (+27% YoY and textiles (+25% YoY outperformed during the month.
Outlook:
- Both order booking and shipments continued to exceed company expectations in the month.
- Looking ahead, management remains positive on its growth outlook, driven by share gains and stimulus policies, which could help sustain the upcycle at least into 2027.
- We remain OW as current valuation at 18x 2027e P/E is undemanding vs. its mid-cycle average of 25x, though we think Hiwin (2049.TW might outperform on share price on the back of sequential growth in the top line and potentially GM in 3Q26.
Exhibit 1: AirTAC monthly sales vs. its share price since 2015
Source: Company data, TEJ, organ Stanley Research. Note: Past performance is no guarantee of future results. Results shown do not include transaction costs.
organ Stanley Taiwan Limited+
| Derrick Yang Equity Analyst Derrick.Yang@morganstanley.com | +886 2 2730-2862 |
|---|---|
| Vivi Huang Research Associate Vivi.Huang@morganstanley.com | +886 2 2730-2860 |
| organ Stanley Asia Limited+ Andy Meng, CFA Equity Analyst Andy. eng@morganstanley.com | +852 2239-7689 |
AirTAC International(1590.TW, 1590 TT)
Greater China Technology Hardware | Taiwan
| Stock Rating | Overweight |
|---|---|
| Industry iew | In-Line |
| Price target | NT$2,000.00 |
| Up/downside to price target (%) | 65 |
| S r price, close (Oct 12, 2026) | NT$1,210.00 |
| 52-Week Range | NT$1,615.00-840.00 |
| S out, dil, curr (mn) | 200 |
| Mkt cap, curr (mn) | US$7,583 |
| EV, curr (mn) | US$7,433 |
| Avg daily trading value (mn) | US$35 |
| Fiscal Year Ending | 12/25 | 12/26e | 12/27e | 12/28e |
|---|---|---|---|---|
| EPS (NT$)** | 41.97 | 60.77 | 68.77 | 77.77 |
| EPS (NT$)§ | 41.43 | 58.80 | 68.02 | 74.62 |
| Revenue, net (NT$ mn) | 34,330 | 45,007 | 50,917 | 57,428 |
| EBITDA (NT$ mn) | 12,866 | 17,543 | 19,669 | 22,130 |
| ModelWare net inc (NT | 8,400 | 12,165 | 13,765 | 15,567 |
| $ mn) | ||||
| P/E | 22.2 | 19.9 | 17.6 | 15.6 |
| P/BV | 3.5 | 4.1 | 3.6 | 3.2 |
| RNOA (%) | 17.7 | 25.1 | 25.9 | 27.3 |
| ROE (%) | 17.5 | 23.1 | 23.4 | 23.4 |
| EV/EBITDA | 14.1 | 13.4 | 11.8 | 10.3 |
| Div yld (%) | 2.2 | 2.4 | 2.5 | 2.8 |
| FCF yld ratio (%) | 3.4 | 3.0 | 4.0 | 4.4 |
| Leverage (EOP) (%) | (9.1) | (11.0) | (15.2) | (18.7) |
Unless ot erwise noted, all metrics are based on Morgan Stanley ModelWare framework
** = Based on consensus met odology
§ = Consensus data is provided by Refinitiv Estimates
e = Morgan Stanley Researc estimates
Morgan Stanley does and seeks to do business with companies covered in Morgan Stanley Research. As a result, investors should be aware that the firm may have a conflict of interest that could affect the objectivity of Morgan Stanley Research. Investors should consider Morgan Stanley Research as only a single factor in making their investment decision.
For analyst certification and other important disclosures, refer to the Disclosure Section, located at the end of this report.
= Analysts employed by non-U.S. affiliates are not registered with FINRA, may not be associated persons of the member and may not be subject to FINRA restrictions on communications with a subject company, public appearances and trading securities held by a research analyst account.
M Update
AlphaSignals Catalyst Event Reaction
| Company / Catalyst | Date | Impact to t esis | Catalyst versus expectation |
|---|---|---|---|
| AirTAC International 1590.TW | |||
| September 2026 Sales | 12 Oct 2026 | Unc anged | In-line |
Source:Company data, Morgan Stanley Researc M Update
Valuation Methodology and Risks
AirTAC International (1590.TW)
Base case, 29x 2027e P/E. We believe this methodology better captures earnings growth momentum for industrial automation component plays (market sentiment moves along with business cycles . As the industry enters an up-cycle, we think applying a near-peak cycle valuation of 29x P/E is reasonable given the stronger business outlook.
Risks to Upside
- n Stronger macroeconomic climate in China
- n Stronger-than-expected demand from industrial automation
Risks to Downside
- n Sharper economic downturn in China
- nMiniature linear guideway business development taking more time
- n Larger-than-expected investment in new products but weaker-than-expected demand
Hiwin Tec nologies Corp. (2049.TW)
Base case, P/E. We think this valuation methodology better captures Hiwin's earnings growth momentum, as its valuation tends to move with the business cycle. We apply a target multiple of 38x to our 2027 EPS estimate. We view this multiple as justified by the 47% operating profit CAGR we project for 2025-28.
Risks to Upside
- n Stronger industrial automation demand pickup.
- nMarket share gains.
- n Earlier-than-expected revenue contribution from humanoids.
Risks to Downside
- nWeaker industrial automation demand.
- nMore pricing pressure.
- nMarket share loss.
- nMore broad-based impact on the global economy from geopolitical risks.
M Update