PDF 原檔:報告_MQ_聯發科2454_20260629_original.pdf
原始內容
rec history
12000 — 2454 (LH5]
10000
Outperform
4000
2000
300
100
Marqueeldeas CZO
50
Jan-24 Aug-24 Apr-25 Nov-25 Jun-26
Source: FactSet. Macauarie Research. Jun 2026 lall fiaures in
MediaTek
See ASIC upside; smartphone headwinds partly offset by share gains
Key Points
- We expect ASIC to be OPM accretive, with upside from new customers; we believe a second US CSP project may emerge.
- Expect smartphone shipments to decline over 2026-28, with pricing pressure driving mix shift to lower-end models. New wins could alleviate headwinds.
- Cutting 2026E/2027E EPS 16%/11% but raising 2028E EPS 71% on ASIC demand; TP +71% to NT$10,000.
- ASIC seeing significant revenue upside from next-gen TPU, share gains. ASIC revenue is tracking well above our prior expectation, and we now estimate 2028 ASIC revenue of US$40bn (US$18bn previously). The company has indicated the 2028 next-gen TPU project utilises more advanced nodes, which we believe will drive >2x ASP growth. MediaTek is actively gaining market share from Broadcom (see details here). While we estimate this project will be slightly dilutive to GPM, we also estimate it will significantly boost OPM. We believe further upside potential exists from a new CPU project with another leading US CSP (see details here).
- Smartphone shipments pressured by component price hikes, but flagship wins should offer relief. We forecast overall smartphone shipments will decline through 2026-28, as sustained memory price increases weigh on end demand. With smartphone companies facing pressure to raise retail prices (ie, see Apple news here), we believe consumers are responding by downshifting to lower-priced models, which leads us to expect 4G to slightly outperform 5G. Despite these headwinds, we believe MediaTek's flagship SoC has a strong probability of entering the Samsung Galaxy S series, which we believe would partially alleviate downside pressure on 5G through 2027/28E.
Earnings changes: We cut 2026E/2027E EPS 16%/11% to reflect weakerthan-expected smartphone and consumer electronics markets. We raise 2028E EPS 71% to reflect stronger-than-expected ASIC demand.
Valuation: We raise our TP 71%, to NT$10,000 from NT$5,850, based on an unchanged 35x 2028E PER. We justify this multiple based on our estimate for a 63% EPS CAGR over 2025-28.
Catalysts: Cloud ASIC/TPU milestones; new ASIC design wins; early LEO satellite chip design wins; smartphone-demand recovery.
Investment Thesis and Recommendation
We expect smartphone/consumer electronics inventory levels to normalise and for MediaTek to benefit from restocking demand, 5G growth, and the AI upgrade cycle. More company research here.
- Rel TAlEX [RHS) • Price Target
Semicons & Semicon Equip
Taiwan
Arthur Lai
Katherine Zheng
| 2454 TT | Outperform |
|---|---|
| Price (at 26 Jun 2026) | TWD3,880 |
| 12-month target | TWD10,000 |
| 12-month TSR (%) | 159.2 |
| Volatility Index | High |
| Market Cap (Local) (m) | 6,223,114 |
| Market Cap (USD) (m) | 195,364 |
| Free Float (%) | 97 |
| 30-day avg turnover (USD) (m) | 1,901.3 |
Investment Fundamentals
| Year end 31 Dec Revenue (bn) | 2025A 596.0 | 2026E 605.5 | 2027E 955.2 | 2028E 1,898 |
|---|---|---|---|---|
| Revenue growth (%) | 12.3 | 1.6 | 57.8 | 98.7 |
| EBIT (bn) | 103.5 | 89.3 | 205.7 | 535.0 |
| EBIT growth (%) | 1.0 | (13.7) | 130.2 | 160.1 |
| Adjusted profit (bn) | 105.3 | 87.1 | 183.5 | 454.9 |
| EPS adj [TWD] | 66.2 | 54.7 | 115.2 | 285.6 |
| EPS adj growth (%) | (1.2) | (17.4) | 110.8 | 147.8 |
| Net debt/equity (%) | (56.4) | (32.6) | (50.5) | (85.9) |
| ROA (%) | 14.4 | 12.1 | 24.2 | 35.7 |
| ROE (%) | 26.4 | 21.6 | 41.1 | 68.7 |
| PER adj (x) | 58.6 | 71.0 | 33.7 | 13.6 |
| EV/EBITDA (x) | 54.6 | 62.8 | 30.6 | 12.3 |
| P/BV (x) | 15.4 | 15.2 | 12.7 | 7.4 |
| Total div yield (%) | 1.4 | 1.5 | 1.6 | 1.7 |
Quant (rank vs. global sector)
183 / 657
2454 TT rel TAIEX performance, & rec history
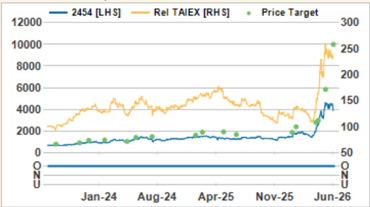
Source: FactSet, Macquarie Research, Jun 2026 (all figures in TWD unless noted, TP in TWD)
Key Risks to Investment Thesis
- End-demand remaining soft.
- Higher-than-expected foundry costs.
- Google TPU project delays.
- Unfavourable FX rates.
Figure 1 - MediaTek - Revenue breakdown by product (NT$ bn)
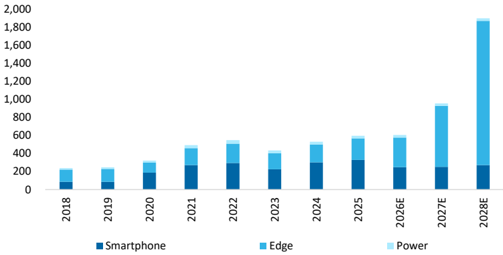
Source: Company data, Macquarie Research, June 2026
MediaTek (2454 TT) TWD/(bn) unless otherwise noted
| Income Statement Dec FY | 2025A | 2026E | 2027E | 2028E | Q1/26A | Q2/26E | Balance Sheet | 2025A | 2026E | 2027E | 2028E |
|---|---|---|---|---|---|---|---|---|---|---|---|
| Revenue | 596.0 | 605.5 | 955.2 | 1,898 | 149.2 | 134.7 | Cash | 235.3 | 140.7 | 257.2 | 786.3 |
| Cost of Goods Sold | 312.9 | 331.9 | 556.0 | 1,161 | 80.1 | 72.2 | Receivables | 68.6 | 129.7 | 202.8 | 501.9 |
| Gross Profit | 283.1 | 273.6 | 399.2 | 736.3 | 69.1 | 62.5 | Inventories | 67.2 | 86.5 | 135.2 | 334.6 |
| EBITDA | 116.8 | 103.1 | 215.4 | 544.4 | 26.2 | 20.9 | Investments | 12.4 | 10.3 | 10.3 | 10.3 |
| Depreciation | 13.3 | 13.8 | 9.7 | 9.3 | 3.3 | 3.6 | Fixed Assets | 60.4 | 55.3 | 52.8 | 51.0 |
| Amortisation | 0.0 | 0.0 | 0.0 | 0.0 | 0.0 | 0.0 | Intangibles | 80.3 | 87.6 | 87.6 | 87.6 |
| EBIT | 103.5 | 89.3 | 205.7 | 535.0 | 22.9 | 17.3 | Other Assets | 219.6 | 220.7 | 226.8 | 251.7 |
| Net Interest Income | 10.2 | 7.5 | 8.0 | 2.6 | 2.3 | 2.4 | Total Assets | 743.8 | 730.7 | 972.6 | 2,023 |
| Associates | 6.0 | 3.8 | 4.0 | 2.0 | 0.8 | 1.0 | Payables | 48.7 | 64.8 | 101.4 | 250.9 |
| Exceptionals | 0.0 | 0.0 | 0.0 | 0.0 | 0.0 | 0.0 | Short Term Debt | 4.5 | 5.7 | 6.3 | 61.1 |
| Forex Gains / Losses | 0.0 | 0.0 | 0.0 | 0.0 | 0.0 | 0.0 | Long Term Debt | 0.1 | 0.1 | 0.1 | 0.0 |
| Other Pre-Tax Income | 5.3 | 1.1 | 0.0 | 0.0 | 1.1 | 0.0 | Other Liabilities | 281.3 | 246.6 | 368.3 | 866.9 |
| Pre-Tax Profit | 124.9 | 101.6 | 217.7 | 539.6 | 27.0 | 20.6 | Total Liabilities | 334.6 | 317.2 | 476.1 | 1,179 |
| Tax Expense | (18.8) | (13.8) | (32.7) | (80.9) | (2.6) | (3.1) | Shareholders' Funds | 370.2 | 370.3 | 453.3 | 801.3 |
| Net Profit | 106.1 | 87.8 | 185.1 | 458.6 | 24.4 | 17.5 | Minority Interests | 8.6 | 8.2 | 8.2 | 8.2 |
| Minority Interests | (0.8) | (0.7) | (1.5) | (3.8) | (0.2) | (0.1) | Other | 30.4 | 35.0 | 35.0 | 35.0 |
| Reported Earnings | 105.3 | 87.1 | 183.5 | 454.9 | 24.2 | 17.4 | Total S/H Equity | 409.2 | 413.5 | 496.5 | 844.4 |
| Adjusted Earnings | 105.3 | 87.1 | 183.5 | 454.9 | 24.2 | 17.4 | Total Liab & S/H Funds | 743.8 | 730.7 | 972.6 | 2,023 |
| Basic Shares Outstanding | 1.6 | 1.6 | 1.6 | 1.6 | 1.6 | 1.6 | Net Debt / Equity (%) | (56.4) | (32.6) | (50.5) | (85.9) |
| Diluted Shares Outstanding | 1.6 | 1.6 | 1.6 | 1.6 | 1.6 | 1.6 | ROE (%) | 26.4 | 21.6 | 41.1 | 68.7 |
| EPS (adj) [TWD] | 66.2 | 54.7 | 115.2 | 285.6 | 15.2 | 10.9 | ROA (%) | 14.4 | 12.1 | 24.2 | 35.7 |
| Total DPS [TWD] | 54.1 | 59.1 | 63.1 | 67.1 | 29.1 | 0.0 | ROIC (%) | 41.8 | 43.2 | 62.8 | 185.1 |
| Ratio | 2025A | 2026E | 2027E | 2028E | Cash Flow Analysis | 2025A | 2026E | 2027E | 2028E | ||
| Revenue Growth (%) | 12.3 | 1.6 | 57.8 | 98.7 | - | - | EBITDA | 116.8 | 103.1 | 215.4 | 544.4 |
| EBITDA Growth (%) | 1.6 | (11.7) | 109.0 | 152.7 | - | - | Tax Paid | (18.8) | (13.8) | (32.7) | (80.9) |
| EBIT Growth (%) | 1.0 | (13.7) | 130.2 | 160.1 | - | - | Chgs in Working Cap | 22.5 | (95.1) | 30.4 | 124.6 |
| EPS Growth (adj) (%) | (1.2) | (17.4) | 110.8 | 147.8 | - | - | Net Interest Paid | 10.2 | 7.5 | 8.0 | 2.6 |
| Gross Profit Margin (%) | 47.5 | 45.2 | 41.8 | 38.8 | - | - | Other | 32.0 | 17.3 | 9.0 | 4.5 |
| EBITDA Margin (%) | 19.6 | 17.0 | 22.6 | 28.7 | - | - | Operating Cashflow | 162.8 | 18.9 | 230.2 | 595.1 |
| EBIT Margin (%) | 17.4 | 14.8 | 21.5 | 28.2 | - | - | Acquisitions | 0.0 | 0.0 | 0.0 | 0.0 |
| Net Profit Margin (%) | 17.7 | 14.4 | 19.2 | 24.0 | - | - | Capex | (15.1) | (13.8) | (13.8) | (13.8) |
| Payout Ratio (%) | 81.7 | 108.2 | 54.8 | 23.5 | - | - | Other | (22.7) | 0.2 | 0.0 | 0.0 |
| PE (adj) (x) | 58.6 | 71.0 | 33.7 | 13.6 | - | - | Investing Cashflow | (37.8) | (13.6) | (13.8) | (13.8) |
| EV/EBITDA (x) | 54.6 | 62.8 | 30.6 | 12.3 | - | - | Dividend (Ordinary) | (86.1) | (94.2) | (100.5) | (106.9) |
| EV/EBIT (x) | 61.3 | 72.1 | 32.0 | 12.5 | - | - | Financing Cashflow | (87.7) | (102.0) | (100.0) | (52.2) |
| Price/Book (x) | 15.4 | 7.4 | - | - | 31.6 | (94.6) | 116.5 | 529.1 | |||
| 15.2 | 12.7 | - | Net Chg in Cash/Debt | ||||||||
| Total Div Yield (%) | 1.4 | 1.5 | 1.6 | 1.7 | - | Free Cashflow | 147.7 | 5.1 | 216.4 | 581.3 |
Source: Company data, Macquarie Research Jun 2026
Company Description
MediaTek is the largest chip designer in Taiwan, with a diversified product portfolio that includes smartphone SoC (4G and 5G), TV SoC, consumer electronics chips such as SoC and connectivity (wifi, blutooth, GPPS) and power management. The firm also operates in Enterprise segments such as Enterprise / Telecom connectivity, switch and edge computing. Mediatek is launching a range of Automotive products, as the ADAS market represents a new opportunity.
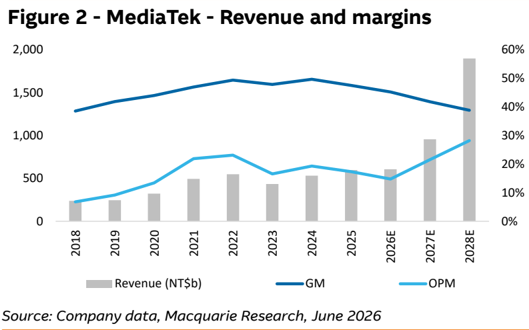
Figure 3 - MediaTek - QoQ revenue guidance vs actual reported
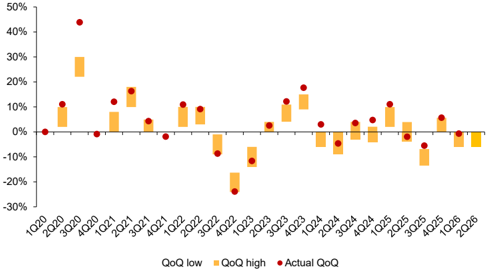
Source: Company data, Macquarie Research, June 2026
Figure 5 - MediaTek - Revisions snapshot
| (NT$m) | FY26E | FY26E | FY26E | FY27E | FY27E | FY27E | FY28E | FY28E | FY28E |
|---|---|---|---|---|---|---|---|---|---|
| New | Old | Change | New | Old | Change | New | Old | Change | |
| Revenue | 605,520 | 648,301 | -7% | 955,233 | 978,835 | -2% | 1,897,716 | 1,198,150 | 58% |
| Gross profit | 273,589 | 292,300 | -6% | 399,224 | 425,496 | -6% | 736,287 | 511,383 | 44% |
| Opex | -184,256 | -184,256 | 0% | -193,538 | -193,538 | 0% | -201,279 | -200,312 | 0% |
| Operating profit | 89,334 | 108,045 | -17% | 205,686 | 231,958 | -11% | 535,007 | 311,071 | 72% |
| Pretax profit | 101,641 | 120,622 | -16% | 217,728 | 245,161 | -11% | 539,588 | 315,602 | 71% |
| Net profit | 87,805 | 103,939 | -16% | 185,069 | 208,387 | -11% | 458,650 | 268,262 | 71% |
| EPS (NT$) | 54.66 | 64.71 | -16% | 115.24 | 129.76 | -11% | 285.60 | 167.05 | 71% |
| Margins | |||||||||
| Gross margin | 45.2% | 45.1% | 0.1 ppts | 41.8% | 43.5% | -1.7 ppts | 38.8% | 42.7% | -3.9 ppts |
| Op margin | 14.8% | 16.7% | -1.9 ppts | 21.5% | 23.7% | -2.2 ppts | 28.2% | 26.0% | 2.2 ppts |
| Net margin | 14.5% | 16.0% | -1.5 ppts | 19.4% | 21.3% | -1.9 ppts | 24.2% | 22.4% | 1.8 ppts |
Source: Macquarie Research, June 2026
Figure 6 - MediaTek - 12-month forward PE band (average since 2023)
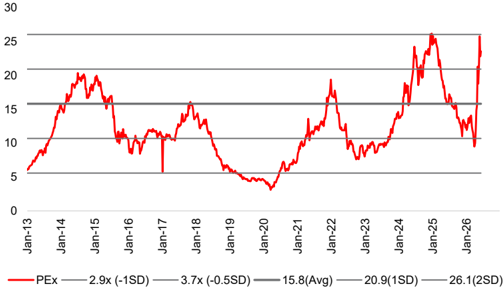
Source: TEJ, Macquarie Research, June 2026
Figure 4 - MediaTek - Gross margin guidance vs actual reported
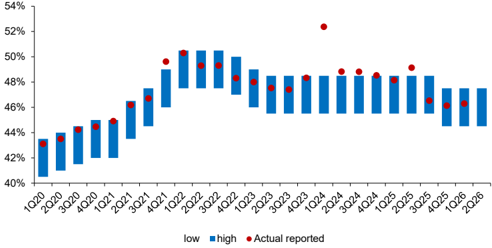
Source: MediaTek, Macquarie Research, June 2026
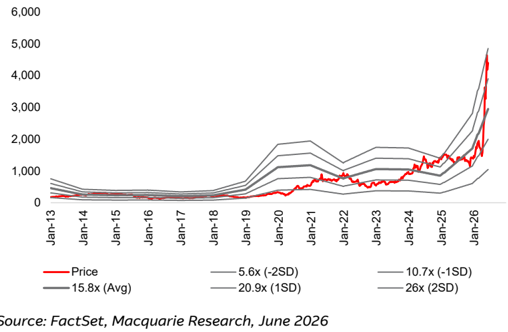
Figure 7 - MediaTek - 12-month forward PER (average since 2023)
Source: FactSet, Macquarie Research, June 2026
Key Quant Findings
The quant model currently holds a marginally positive view on MediaTek. The strongest style exposure is Price Momentum, indicating this stock has had strong medium to long term returns which often persist into the future. The weakest style exposure is Growth, indicating this stock has weak historic and/or forecast growth. Growth metrics focus on both top and bottom line items.
Macquarie Alpha Model: Key rankings
The Macquarie Quant's flagship Alpha model is a dynamic multi-factor model based on a staple of quant factors such as value, momentum, revisions, quality, and risk.
| Global | Market (Country) | Sector | |
|---|---|---|---|
| Whole Universe | Taiwan | Semiconductors & Semiconductor Equip. | |
| Macquarie Alpha Model | 7598/17949 | 407/977 | 183/657 |
| Fundamental (Consensus) * | 3924/17949 | 92/977 | 162/657 |
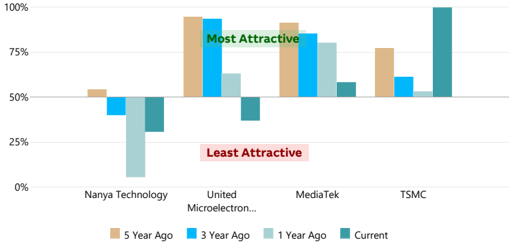
Current and Historical Alpha Model Rank
The chart shows the Macquarie Alpha model market ranking against the company's peers and over recent history.
Drivers of Stock Return
Breakdown of 1-year total return (local currency) into returns from dividends, changes in forward earnings estimates and the resulting change in earnings multiple.
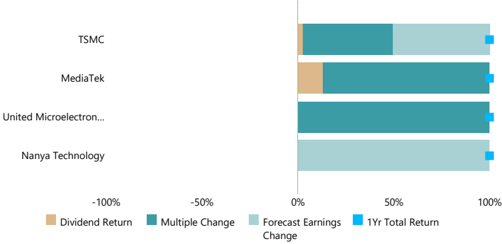
Alpha Model Decomposition
The Macquarie Alpha is decomposed into its sector and market relative factor & styles exposures (a higher/better percentile is coded in green, whilst lower in red).
| Percentile relative to | Percentile relative to | ||
|---|---|---|---|
| Factors / Styles | sectors (/657) | market (/977) | Core factors in definition |
| ALPHA | 72% | 58% | Built from the styles below |
| VALUE | 53% | 9% | Book, CF, Yield, Earnings Multiples |
| ANALYST | 52% | 73% | Revisions (Earnings, Recommendations) |
| MOMENTUM | 76% | 94% | Price Momentum |
| GROWTH | 10% | 11% | EPS, Sales (Forecast, Historic) |
| PROFITABILITY | 85% | 94% | ROE, Margin, Asset Turnover |
| QUALITY | 83% | 92% | Accruals, Earn Stability, Cash Conversion |
| CAPITAL | 70% | 35% | Investment/Capex, Net share issuance |
| LIQUIDITY | 80% | 100% | Size, Turnover, Analyst Coverage |
| LOW RISK | 78% | 63% | Beta, Volatility, Earn.Cert, Leverage |
| TECHNICAL | 78% | 78% | MACD, RSI, Bollinger, Williams R, etc |
Factors driving the Alpha Model vs peers
For the comparable firms this chart shows the key underlying styles and their contribution to the current overall raw Alpha score.
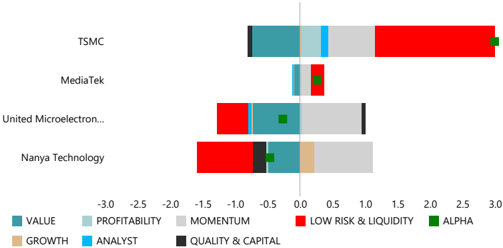
Macquarie Style Returns over last year
Recent performance to Macquarie style factors
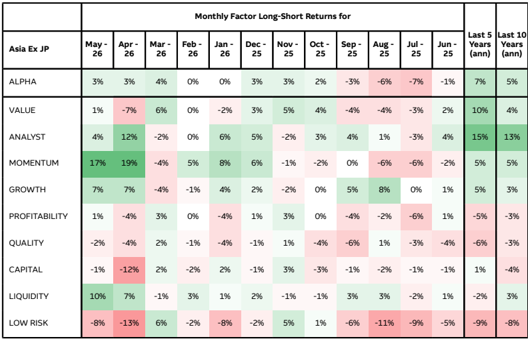
| Monthly Factor Long-Short Returns for | Monthly Factor Long-Short Returns for | Monthly Factor Long-Short Returns for | Monthly Factor Long-Short Returns for | Monthly Factor Long-Short Returns for | Monthly Factor Long-Short Returns for | Monthly Factor Long-Short Returns for | Monthly Factor Long-Short Returns for | Monthly Factor Long-Short Returns for | Monthly Factor Long-Short Returns for | Monthly Factor Long-Short Returns for | Monthly Factor Long-Short Returns for | |||
|---|---|---|---|---|---|---|---|---|---|---|---|---|---|---|
| Asia Ex JP | May - 26 | Apr - 26 | Mar - 26 | Feb - 26 | Jan - 26 | Dec - 25 | Nov - 25 | Oct - 25 | Sep - 25 | Aug - 25 | Jul - 25 | Jun - 25 | Last 5 Years (ann) | Last 10 Years (ann) |
| ALPHA | 3% | 3% | 4% | 0% | 0% | 3% | 3% | 2% | -3% | -6% | -7% | -1% | 7% | 5% |
| VALUE | 1% | -7% | 6% | 0% | -2% | 3% | 5% | 4% | -4% | -4% | -3% | 2% | 10% | 4% |
| ANALYST | 4% | 12% | -2% | 0% | 6% | 5% | -2% | 3% | 4% | 1% | -3% | 4% | 15% | 13% |
| MOMENTUM | 17% | 19% | -4% | 5% | 8% | 6% | -1% | -2% | 0% | -6% | -6% | -2% | 5% | 5% |
| GROWTH | 7% | 7% | -4% | -1% | 4% | 2% | -2% | 0% | 5% | 8% | 0% | 1% | 5% | 3% |
| PROFITABILITY | 1% | -4% | 3% | 0% | -4% | 1% | 3% | 0% | -4% | -2% | -6% | 1% | -5% | -3% |
| QUALITY | -2% | -4% | 2% | -1% | -4% | -1% | 1% | -4% | -6% | 1% | -3% | -4% | -6% | -3% |
| CAPITAL | -1% | -12% | 2% | -2% | 2% | -1% | 3% | -3% | -1% | -2% | -1% | -1% | 1% | -4% |
| LIQUIDITY | 10% | 7% | -1% | 3% | 1% | 2% | -1% | -1% | 3% | 3% | -2% | 1% | -2% | 3% |
| LOW RISK | -8% | -13% | 6% | -2% | -8% | -2% | 5% | 1% | -6% | -11% | -9% | -5% | -9% | -8% |
Source (all charts): FactSet, Refinitiv, and Macquarie Quant. For more details on the Macquarie Alpha model or for more customised analysis and screens, please contact the Macquarie Global Quantitative Team: maccapequitiesresearchquantglobal@macquarie.com. Explanation for items on this page can be found at https://www.macquarieinsights.com/rp/d/r/p/OTUyMzg1
Analysts
Arthur Lai
852 3922 4216 art.lai@macquarie.com
Macquarie Capital Limited
圖片清單(已驗證 2026-06-30)
| 檔名 | size | 分類 | 親眼所見內容 |
|---|---|---|---|
| 報告_MQ_聯發科2454_20260629_001.png | 32,805 | 裝飾·logo·banner | (< 40KB 未驗讀) |
| 報告_MQ_聯發科2454_20260629_002.png | 18,797 | 裝飾·logo·banner | (< 40KB 未驗讀) |
| 報告_MQ_聯發科2454_20260629_003.png | 49,712 | 真資料圖 | Figure 2 - MediaTek Revenue and margins:柱狀圖(Revenue NT$b,2018–2028E)搭配折線(GM、OPM),2027/2028E 收入大幅跳升;來源 Company data, Macquarie Research, June 2026 |
| 報告_MQ_聯發科2454_20260629_004.png | 33,393 | 裝飾·logo·banner | (< 40KB 未驗讀) |
| 報告_MQ_聯發科2454_20260629_005.png | 36,322 | 裝飾·logo·banner | (< 40KB 未驗讀) |
| 報告_MQ_聯發科2454_20260629_006.png | 32,878 | 裝飾·logo·banner | (< 40KB 未驗讀) |
| 報告_MQ_聯發科2454_20260629_007.png | 54,345 | 真資料圖 | 聯發科股價走勢(Jan-13 至 Jan-26)搭配 PER band(5.6x, 10.7x, Avg 15.8x, 20.9x, 26x);股價 2026 年急拉至約 4,000+ TWD;來源 FactSet, Macquarie Research, June 2026 |
| 報告_MQ_聯發科2454_20260629_008.png | 20,732 | 裝飾·logo·banner | (< 40KB 未驗讀) |
| 報告_MQ_聯發科2454_20260629_009.png | 17,269 | 裝飾·logo·banner | (< 40KB 未驗讀) |
| 報告_MQ_聯發科2454_20260629_010.png | 22,480 | 裝飾·logo·banner | (< 40KB 未驗讀) |
| 報告_MQ_聯發科2454_20260629_011.png | 79,529 | 文字卡 | Monthly Factor Long-Short Returns 色階表:Asia Ex JP 各因子(ALPHA, VALUE, ANALYST, MOMENTUM, GROWTH 等)May-26 至 Jun-25 每月績效百分比,以綠/紅標色;Macquarie 量化模型輸出表格 |
| 報告_MQ_聯發科2454_20260629_012.png | 91,303 | 真資料圖 | 2454 vs TAIEX 股價走勢圖(Jan-24 至 Jun-26)+ 右側推薦歷史表(含日期、Outperform 評等、目標價;最新 Jun-26 TP TWD 10,000,最舊 Jul-23 TP TWD 798.70) |