PDF 原檔:報告_ML_萬潤6187_20260713_original.pdf
圖片清單(已驗證 2026-07-14)
| 檔名 | size | 分類 | 親眼所見內容 |
|---|---|---|---|
260713_ml_allring-buy-initiaiton_002.png |
70KB | 真資料圖 | 雙軸圖「Back-end industry sales & capex (US$mn)」,2007-2027 深藍柱(sales)+橘柱(capex),藍/青綠線為 Sales YoY/Capex YoY |
260713_ml_allring-buy-initiaiton_003.png |
85KB | 真資料圖 | 左「Industry advanced packaging capacity addition mix」堆疊柱狀圖(ASE FoCoS/TSMC CoPoS/TSMC CoWoS),右軸青綠線「All Ring's blended content per k WPM capacity expansion(NT$mn)」,1Q24-3Q28 |
260713_ml_allring-buy-initiaiton_004.png |
56KB | 真資料圖 | 雙軸圖「Revenue(NT$mn)/GMs/OpMs」,深藍柱為 Revenue,藍線 GMs、橘線 OpMs,1Q22-3Q28E |
260713_ml_allring-buy-initiaiton_005.png |
83KB | 真資料圖 | 「CoWoS demand(k WPY)」堆疊柱狀圖依客戶別(Nvidia/AMD/Broadcom/Alchip/Mediatek/Google/Amazon/Meta/Microsoft/Others 等)分色,右軸藍線 Total CoWoS demand YoY,2020-2028 |
260713_ml_allring-buy-initiaiton_006.png |
79KB | 真資料圖 | 雙軸圖「All Ring's revenue by technologies(NT$mn)」,柱狀分 Advanced packaging/Other semis/Others/CPO,另有多條 YoY 折線,2023-2028 |
260713_ml_allring-buy-initiaiton_007.png |
41KB | 真資料圖 | P/E 估值扇形圖,NT$ weekly closing prices,Dec-20 至 Dec-25,標示 41x/30x/19x/13x/8x 倍數線 |
260713_ml_allring-buy-initiaiton_008.png |
59KB | 真資料圖 | 後段製程流程圖:BGA→Substrate Inspection→Flux Jetting→Post die Bonding→Post curing AOI→Underfill→Post underfill AOI→Heat Sink→Ball Mount→Six-side Visual Inspection,附各步驟 Key equipment suppliers(All Ring/Machvision/V5/Ta Liang Technology/Utechzone/Asymtek/Musashi/Horng terng) |
260713_ml_allring-buy-initiaiton_009.png |
57KB | 真資料圖 | 與 _008 完全相同的後段製程流程圖(重複圖) |
260713_ml_allring-buy-initiaiton_010.png |
205KB | 真資料圖 | 萬潤設備組合圖,中文標示機台照片:高精度點膠機、關鍵製程點膠機、Metal TIM、CPO光耦合機、CPO PKG 外觀檢驗機,環繞 Wafer→WoW→PCB/FOPLP→CPO 流程箭頭 |
260713_ml_allring-buy-initiaiton_011.png |
87KB | 真資料圖 | 6 步驟後段製程圖示:01 Bump formation、02 Dicing、03 Bump bonding、04 Underfill dispensing、05 Molding、06 Final test |
260713_ml_allring-buy-initiaiton_012.png |
74KB | 真資料圖 | CTE 熱脹冷縮循環示意圖,Heating/Cooling 循環箭頭,顯示 Silicon chip/Solder bump/Contact pad/Organic base substrate 及升溫後出現 Crack 裂紋 |
260713_ml_allring-buy-initiaiton_013.png |
57KB | 真資料圖 | Flip chip 剖面圖,標示 Lid/Die/TIM/Sold bumps/Underfill(紅圈)/PCB/Solder joints;來源 Ansys |
260713_ml_allring-buy-initiaiton_014.png |
234KB | 真資料圖 | 三張並列實拍照片:PCB 上散熱片+晶片特寫、以針筒塗佈 TIM 膏於晶片上、橘框 PCB 上安裝散熱片 |
260713_ml_allring-buy-initiaiton_015.png |
285KB | 真資料圖 | AOI 檢測缺陷影像 4x3 網格,標示 No stick/Missing wires/Bump defects/Missing bonds/Underfill/BGA-Flip Chip/Contamination/Epoxy-paste/Waffle packs/Die defects/Bonds on thickfilm;來源 Nordson YESTECH |
260713_ml_allring-buy-initiaiton_016.png |
110KB | 真資料圖 | AOI 感測頭元件圖,標示 Ultra Fast 2D & 3D Sensor(FPGA)、Shadow Free Dual Laser(3D)、7 Channel LED(Color 2D);來源 Accelonix |
260713_ml_allring-buy-initiaiton_017.png |
125KB | 真資料圖 | 上半為 Heat Sink/Metal Lid/TIM1/TIM2/Chip 立體堆疊圖(左為 Air 對照、右為 TIM),下半為對應 Temperature vs Distance 熱阻曲線圖 |
260713_ml_allring-buy-initiaiton_018.png |
94KB | 真資料圖 | 與 _002 相同的「Back-end industry sales & capex(US$mn)」雙軸圖(重複圖) |
260713_ml_allring-buy-initiaiton_019.png |
87KB | 真資料圖 | 雙軸圖「Back-end industry sales & capex / Capital intensity」,深藍柱(sales)+橘柱(capex)+綠線(capital intensity),2000-2028 |
260713_ml_allring-buy-initiaiton_020.png |
68KB | 真資料圖 | 柱狀+折線圖「CoWoS-R/L wafer demand/capacity/utilization」,深藍柱(demand)、藍柱(capacity)、橘線(utilization),3Q24-4Q28 |
260713_ml_allring-buy-initiaiton_021.png |
123KB | 真資料圖 | TSMC SoIC roadmap「Logic-on-Logic」示意圖,Y軸 Interconnect IO Count,紅框標示各年度 Pitch/TD/BD 參數(2023-2029),含 3D 晶片堆疊小圖 |
260713_ml_allring-buy-initiaiton_022.png |
95KB | 真資料圖 | 「CoWoS demand(k WPY)」堆疊柱狀圖,客戶別配色與 _005 相近但圖例排列不同,右軸藍線 Total CoWoS demand YoY,2020-2028 |
260713_ml_allring-buy-initiaiton_023.png |
177KB | 真資料圖 | 左右並列對比圖「Face-to-Back 3D SoIC Technology(Gen1)」vs「Face-to-Face 3D SoIC Technology(Gen2)」,剖面示意圖含 Top Die/Bottom Die/TSV/HCB 密度數據標註 |
260713_ml_allring-buy-initiaiton_024.png |
73KB | 真資料圖 | 雙軸圖「TSMC SoIC supply/demand(k WPQ)」柱狀(demand ex-CPO/supply)+橘線「SoIC utilization ex-CPO」,1Q23-4Q28 |
260713_ml_allring-buy-initiaiton_025.png |
40KB | 真資料圖 | 「Revenue mix」100% 堆疊柱狀圖,分類 Other semiconductor/Flip-chip/Advanced packaging excluding CoWoS/CoWoS/Others/Passive components,2023-2028E |
260713_ml_allring-buy-initiaiton_026.png |
90KB | 真資料圖 | 雙軸圖「Revenue by segments(NT$mn)」,柱狀分 Semiconductor/Others/Passive components,多條 YoY 折線,2023-2028E |
260713_ml_allring-buy-initiaiton_028.png |
95KB | 真資料圖 | 與 _003 相同的「Industry advanced packaging capacity addition mix / All Ring tool content per k WPM」圖(重複圖) |
260713_ml_allring-buy-initiaiton_029.png |
114KB | 真資料圖 | 雙軸圖「All Ring's revenue from major advanced packaging expansion(NT$mn)」橘柱 + 深藍線(capacity addition)+藍線(blended content per k WPM),1Q24-4Q28 |
260713_ml_allring-buy-initiaiton_030.png |
46KB | 真資料圖 | 折線圖「GMs trend by segments」,Advanced packaging/Flip-chip & other semiconductor/Passive components/Corporate gross margin 四條線,2023-2028E |
260713_ml_allring-buy-initiaiton_031.png |
448KB | 真資料圖 | CPO 共封裝製程流程圖,上方 Component 列出 LD/Lens/SMT/FAU,主體含編號 1-6 步驟框(EIC&PIC/LD bond/EIC on PIC/Optical ASSY/Evolution 1 FC-FO-2.5D/Evolution 2 晶片剖視圖),左側 Node(nm)製程節點刻度,底部 Fab→Wafer Level Process→CoW ASSY→Optical ASSY→On SBT ASSY→Final ASSY & Testing 流程列 |
260713_ml_allring-buy-initiaiton_032.png |
59KB | 真資料圖 | 雙軸圖「All Ring's accumulated CPO equipment sales & Industry OE demand」,深藍柱(equipment sales)+藍柱(OE demand)+橘/青線(YoY),2026E-2028E |
260713_ml_allring-buy-initiaiton_033.png |
95KB | 真資料圖 | 與 _006 同型「All Ring's revenue by technologies(NT$mn)」雙軸圖,柱狀 Advanced packaging/Other semis/Others/CPO + 多條 YoY 折線,2023-2028 |
260713_ml_allring-buy-initiaiton_034.png |
83KB | 真資料圖 | 與 _004 同型「Revenue(NT$mn)/GMs/OpMs」雙軸圖,惟 Y 軸上限為 $6,000(_004 為 $4,500),1Q22-3Q28E |
260713_ml_allring-buy-initiaiton_035.png |
50KB | 真資料圖 | 圖「Free cash flow/Capex/Operating cash flow(NT$mn)」,深藍柱(FCF)+藍柱(Capex)+橘線(OCF),2021-2028E |
260713_ml_allring-buy-initiaiton_037.png |
56KB | 真資料圖 | 雙軸折線圖「ROE/Net margin」vs「Asset turnover/Financial leverage」,四條線,2023-2028E |
260713_ml_allring-buy-initiaiton_038.png |
48KB | 真資料圖 | 雙軸圖「EPS/DPS(NT$)」深藍柱(EPS)+藍柱(DPS) + 橘線「Dividend payout ratio」,2021-2028 |
260713_ml_allring-buy-initiaiton_039.png |
54KB | 真資料圖 | 與 _007 相同的 P/E 估值扇形圖(NT$ weekly closing prices, Dec-20至Dec-25,41x/30x/19x/13x/8x)(重複圖) |
260713_ml_allring-buy-initiaiton_040.png |
56KB | 真資料圖 | 「1yr fwd P/E」走勢圖,深藍線為股價本益比,附 Avg+2std=34x/Avg+1std=26x/Avg P/E=19x/Avg-1std=11x/Avg-2std=4x 五條水平參考線,Jan-20至Nov-25 |
(<40KB 略過未列:_001, _027, _036)
原始內容
All Ring
Riding on the tide of accelerating leading edge semiconductor packaging expansion
Initiating Coverage: BUY | PO: 1,500 TWD | Price: 1,050 TWD
Initiate at Buy, PO of NT$1,500 based on 36x 2027 P/E
We initiate coverage with Buy rating and NT$1,500 PO on 36x 2027 P/E (vs. its 8-41x range) on All Ring, a leading back-end semiconductor equipment supplier with a focus on dispensing, thermal sink, AOI, and optical coupling for packaging upgrades/inspection. With its drivers tied to the strong advanced packaging capacity expansion (CoWoS, SoIC, CPO, CoPoS), its track record delivering total solution across equipment and software to foundries/OSATs and strong on-field support, the company could grow its sales/earnings at 34%/42% CAGR from 2026-28E, lifting EPS to NT$26.46/41.82/53.34 in 2026/27/28.
Diversifying catalysts from advanced packaging expansion
We model All Ring ' s semiconductor equipment business to grow at a 34% CAGR from 2026-28E, driven by 1) packaging and testing industry capex +46% CAGR led by TSMC CoWoS and ASE FoCoS expansion where All Ring has high share in chip level dispensing and heat sink, 2) rising TAM in diversifying advanced packaging technologies (FOPLP, SoIC, CoPoS) from its Taiwan and US customers and 3) CPO optical coupling equipment surging to 29%/42% in ' 27/ ' 28 (vs. 2% of sales in ' 26) as a 2 nd leg to the advanced packaging opportunity, with the industry preparing capacity for commercialization.
Improving mix and scale lifting operating leverage
With its asset light business model outsourcing most of the tool production and focusing on system design, All Ring ' s growing revenue and resilient GMs at 50-55% backed by strong customer stickiness, flexibility on customization and favorable business mix upgrading with its customers could expand its OpMs from 29% in ' 26 to 34% in ' 28E.
40%+ earnings CAGR through '28 at compelling valuation
We think the shares appear attractive at 40x/25x '26/'27E P/E (vs. its peers 42x/26x) following pullback due to concerns on CPO delay and advanced packaging expansion moderation. Risks: 1) industry-wide AI investment slowdown, 2) Mis-execution in equipment development.
| Estimates (Dec) (NT$) | 2024A | 2025A | 2026E | 2027E | 2028E |
|---|---|---|---|---|---|
| Net Income (Adjusted - mn) | 1,311 | 1,485 | 2,549 | 4,028 | 5,137 |
| EPS | 14.57 | 15.46 | 26.46 | 41.82 | 53.34 |
| EPS Change (YoY) | 755.0% | 6.1% | 71.2% | 58.0% | 27.5% |
| Dividend / Share | 10.19 | 11.79 | 18.00 | 30.00 | 35.00 |
| Free Cash Flow / Share | 7.82 | 15.04 | 1.29 | 34.30 | 36.12 |
| Valuation (Dec) | |||||
| P/E | 72.05x | 67.92x | 39.68x | 25.11x | 19.68x |
| Dividend Yield | 0.970% | 1.12% | 1.71% | 2.86% | 3.33% |
| EV / EBITDA* | 67.69x | 59.78x | 35.51x | 22.03x | 17.16x |
| Free Cash Flow Yield* | 0.682% | 1.40% | 0.120% | 3.20% | 3.37% |
| * For full definitions of iQ method SM measures, see page 29. |
This research report provides general information only. No part of this report may be used or reproduced or quoted in any manner whatsoever in Taiwan by the press or other persons without the express written consent of BofA Securities.
>> Employed by a non-US affiliate of BofAS and is not registered/qualified as a research analyst under the FINRA rules.
Refer to "Other Important Disclosures" for information on certain BofA Securities entities that take responsibility for the information herein in particular jurisdictions.
BofA Securities does and seeks to do business with issuers covered in its research reports. As a result, investors should be aware that the firm may have a conflict of interest that could affect the objectivity of this report. Investors should consider this report as only a single factor in making their investment decision.
Refer to important disclosures on page 30 to 32. Analyst Certification on page 27. Price Objective Basis/Risk on page 27. 12993064
Timestamp: 12 July 2026 04:30PM EDT
13 July 2026
Equity
Haas Liu >> Research Analyst Merrill Lynch (Taiwan) +886 2 2376 3727 haas.liu@bofa.com
Cathy Hsu >> Research Analyst Merrill Lynch (Taiwan) +886 2 2376 3726 cathy.hsu3@bofa.com
Mike Yang >> Research Analyst Merrill Lynch (Taiwan) +886 2 2376 3729 mike.c.yang@bofa.com
Stock Data
| Price | 1,050 TWD |
|---|---|
| Price Objective | 1,500 TWD |
| Date Established | 13-Jul-2026 |
| Investment Opinion | C-1-7 |
| 52-Week Range | 307.50 TWD-1,490 |
| TWD | |
| Mrkt Val / Shares Out (mn) | 3,201 USD / 98.2 |
| Market Value (mn) | 103,103 TWD |
| Average Daily Value (mn) | 86.84 USD |
| Free Float | 80.4% |
| BofA Ticker / Exchange | XNQNF / TWO |
| Bloomberg / Reuters | 6187 TT / 6187.TWO |
| ROE (2026E) | 31.0% |
| Net Dbt to Eqty (Dec-2025A) | -52.8% |
Glossary on Exhibit 52
iQ profile SM All Ring
| Key Income Statement Data (Dec) | 2024A | 2025A | 2026E | 2027E | 2028E |
|---|---|---|---|---|---|
| (NT$ Millions) | |||||
| Sales | 5,535 | 5,366 | 9,333 | 13,968 | 16,809 |
| Gross Profit | 2,717 | 2,913 | 4,940 | 7,499 | 9,100 |
| Sell General &Admin Expense | (515) | (536) | (1,122) | (1,317) | (1,423) |
| Operating Profit | 1,427 | 1,611 | 2,741 | 4,471 | 5,762 |
| Net Interest &Other Income | 139 | 202 | 285 | 311 | 331 |
| Associates | NA | NA | NA | NA | NA |
| Pretax Income | 1,566 | 1,813 | 3,026 | 4,782 | 6,093 |
| Tax (expense) / Benefit | (255) | (316) | (476) | (749) | (950) |
| Net Income (Adjusted) | 1,311 | 1,485 | 2,549 | 4,028 | 5,137 |
| Average Fully Diluted Shares Outstanding | 90 | 96 | 97 | 97 | 97 |
| Key Cash Flow Statement Data | |||||
| Net Income | 1,311 | 1,485 | 2,549 | 4,028 | 5,137 |
| Depreciation &Amortization | 56 | 69 | 86 | 86 | 86 |
| Change in Working Capital | (700) | 256 | (2,619) | (961) | (1,905) |
| Deferred Taxation Charge | NA | NA | NA | NA | NA |
| Other Adjustments, Net | 413 | 148 | 780 | 784 | 784 |
| Cash Flow from Operations | 1,079 | 1,958 | 796 | 3,937 | 4,103 |
| Capital Expenditure | (376) | (513) | (672) | (633) | (624) |
| (Acquisition) / Disposal of Investments | (201) | (241) | (161) | 2 | 1 |
| Other Cash Inflow / (Outflow) | 218 | 88 | 117 | (2) | 1 |
| Cash Flow from Investing | (359) | (666) | (716) | (634) | (623) |
| Shares Issue / (Repurchase) | 1,394 | 0 | 0 | 0 | 0 |
| Cost of Dividends Paid | (131) | (980) | (1,146) | (1,749) | (2,916) |
| Cash Flow from Financing | 1,851 | (645) | (1,143) | (1,741) | (2,908) |
| Free Cash Flow | 704 | 1,445 | 124 | 3,303 | 3,478 |
| Net Debt | (3,309) | (3,951) | (3,052) | (4,611) | (5,183) |
| Change in Net Debt | (2,008) | (503) | 1,033 | (1,561) | (572) |
| Key Balance Sheet Data | |||||
| Property, Plant &Equipment | 1,298 | 1,879 | 2,472 | 3,033 | 3,585 |
| Other Non-Current Assets | 1,168 | 1,396 | 1,544 | 1,539 | 1,538 |
| Trade Receivables | 1,552 | 806 | 2,456 | 3,055 | 4,311 |
| Cash &Equivalents | 3,599 | 4,297 | 3,267 | 4,826 | 5,398 |
| Other Current Assets | 1,179 | 1,232 | 4,029 | 5,040 | 6,791 |
| Total Assets | 8,796 | 9,609 | 13,768 | 17,493 | 21,623 |
| Long-Term Debt | 290 | 339 | 133 | 133 | 133 |
| Other Non-Current Liabilities | 131 | 142 | 144 | 144 | 144 |
| Short-Term Debt | 0 | 7 | 82 | 82 | 82 |
| Other Current Liabilities | 1,858 | 1,633 | 4,061 | 4,846 | 6,014 |
| Total Liabilities | 2,279 | 2,121 | 4,420 | 5,205 | 6,373 |
| Total Equity | 6,517 | 7,488 | 9,348 | 12,288 | 15,250 |
| Total Equity &Liabilities | 8,796 | 9,609 | 13,768 | 17,493 | 21,623 |
| iQ method SM - Bus Performance* | |||||
| Return On Capital Employed | 23.6% | 18.4% | 26.4% | 34.0% | 34.8% |
| Return On Equity | 29.1% | 21.5% | 31.0% | 37.9% | 37.9% |
| Operating Margin | 25.8% | 30.0% | 29.4% | 32.0% | 34.3% |
| EBITDA Margin | 26.8% | 31.3% | 30.3% | 32.6% | 34.8% |
| iQ method SM - Quality of Earnings* | |||||
| Cash Realization Ratio | 0.8x | 1.3x | 0.3x | 1.0x | 0.8x |
| Asset Replacement Ratio | 8.0x | 8.7x | 9.3x | 8.7x | 8.6x |
| Tax Rate (Reported) | 16.3% | 17.5% | 15.7% | 15.7% | 15.6% |
| Net Debt-to-Equity Ratio | -50.8% | -52.8% | -32.6% | -37.5% | -34.0% |
| Interest Cover | NM | NM | NM | NM | NM |
Key Metrics
- For full definitions of iQ method SM measures, see page 29.
Company Sector
Semiconductor Capital Equipment
Company Description
Founded in 1996, All Ring is a Taiwan-based semiconductor equipment supplier with core technologies spanning dispensing, attachment, AOI, optical coupling, and precision automation. Building on its initial expertise in passive component manufacturing equipment, the company has gradually expanded into the back-end semiconductor packaging market and established long-term partnerships with leading foundry and OSATs customers.
Investment Rationale
We have a Buy rating on All Ring, in view of its solid market position in the semiconductor advanced packaging equipment. We believe its long-standing relationships with leading foundry and OSATs, coupled with strong technology development capabilities, position the company well to capture the secular uptrend in AI-driven advanced packaging capacity expansion and rising equipment content.

Focus charts and tables
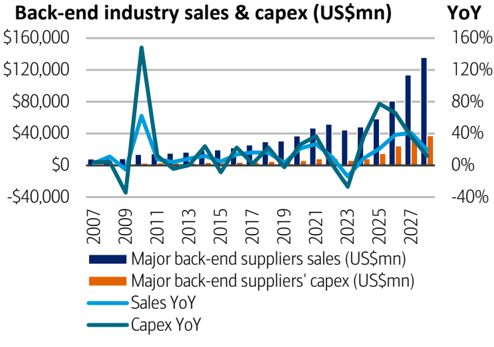
Exhibit 1: Semiconductor back-end sales, capex and growth trend
Back-end is now entering a new phase of expansion
Source: BofA Global Research estimates
BofA GLOBAL RESEARCH
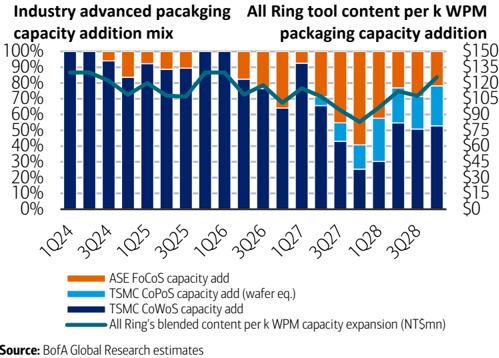
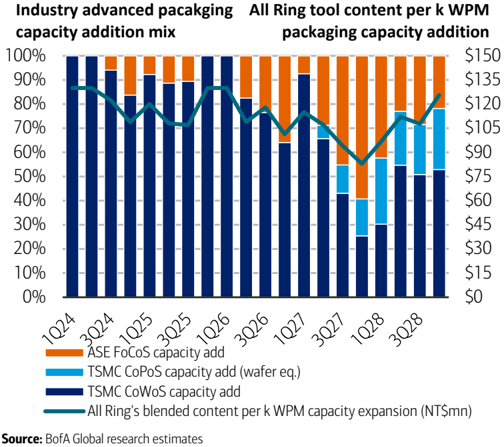
Exhibit 3: All Ring's blended content vs. packaging capacity mix
Blended revenue will decline a bit in 2027 as FoCoS contribution ramps
Source: BofA Global Research estimates
BofA GLOBAL RESEARCH
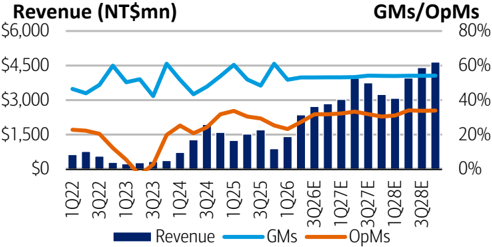
Exhibit 5: All Ring quarterly revenue and GMs/OpMs
All Ring's sales should grow along with advanced packaging capacity expansion with resilient margins
Source: BofA Global Research estimates, company data
BofA GLOBAL RESEARCH
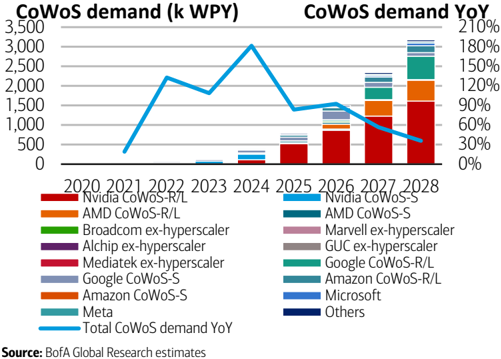
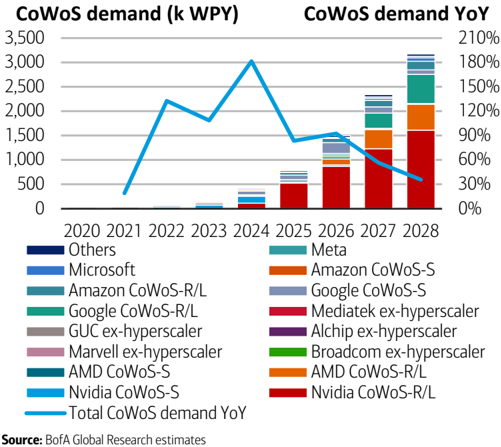
Exhibit 2: Industry CoWoS demand
CoWoS demand should remain strong through 2028
BofA GLOBAL RESEARCH
Exhibit 4: All Ring's revenue by technologies
CPO should become another key growth engine from 2027
Source:
BofA Global Research estimates
BofA GLOBAL RESEARCH
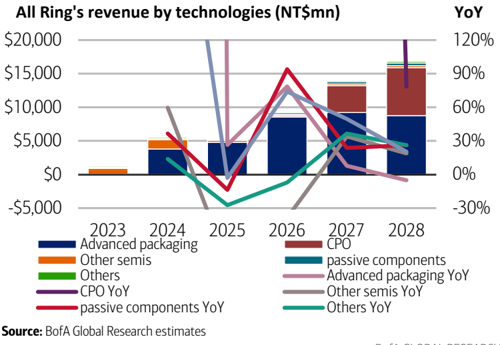
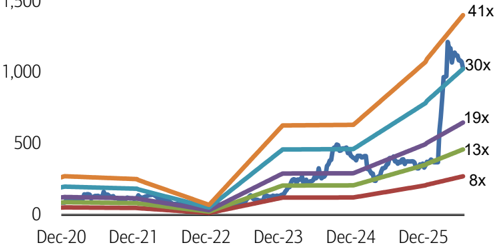
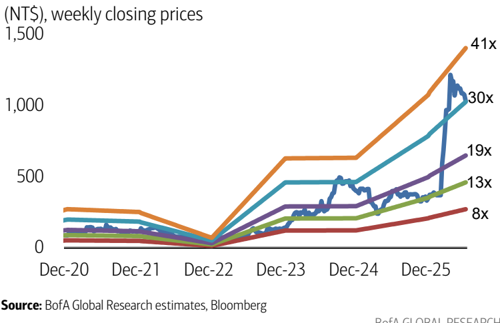
Exhibit 6: All Ring's P/E valuation band
All Ring's P/E of 36x is at the upper band of its range
1,500 (NT$), weekly closing prices
Source: BofA Global Research estimates
Source: BofA Global Research estimates
BofA GLOBAL RESEARCH
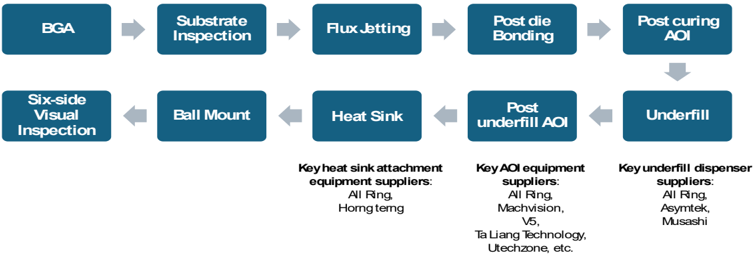
Exhibit 7: Key oS process related to All Ring's equipment portfolio and All Ring's major competitors
All Ring mainly provides equipment for underfill, heat sink attachment, and AOI process
Source: BofA Global Research
Exhibit 8: Peer valuation - All Ring vs. its equipment competitors
All Ring's valuation is still at a discount to its peers average
| Ticker | Company | Share price (LC) | Rating | Mkt cap | PER (X) | PER (X) | EPS CAGR | ROE (%) | ROE (%) | EV/EBITDA | EV/EBITDA | Div. yield (%) | Div. yield (%) |
|---|---|---|---|---|---|---|---|---|---|---|---|---|---|
| (US$mn) | 2026E | 2027E | 26-28E | 2026E | 2027E | 2026E | 2027E | 2026E | 2027E | ||||
| 6187 TT | All Ring | 1,050.0 | BUY | 3,203 | 39.7 | 25.1 | 42% | 31.0 | 37.9 | 32.3 | 20.0 | 1.7 | 2.9 |
| 7751 TT | Horng Terng | 1,295.0 | NC | 1,082 | 28.4 | 12.4 | 129% | 47.2 | 124.7 | n.a. | n.a. | 2.0 | 4.1 |
| NDSN US | Nordson | 286.4 | NC | 15,956 | 24.7 | 22.8 | 8% | 18.5 | 18.1 | 18.3 | 16.9 | 1.2 | 1.2 |
| 3563 TT | MACHVISION | 721.0 | NC | 1,433 | 30.9 | 19.1 | 56% | 22.5 | 34.7 | 23.4 | 13.2 | 2.9 | n.a. |
| 7822 TT | V5 | 998.0 | NC | 1,413 | 70.6 | 25.6 | 74% | 27.4 | 24.4 | 46.2 | 32.3 | 1.3 | 2.1 |
| 6640 TT | Gallant Micro Machining | 995.0 | NC | 882 | 36.9 | 21.8 | 70% | 36.1 | 57.7 | n.a. | n.a. | 2.3 | 3.7 |
| 2467 TT | C Sun | 556.0 | NC | 2,708 | 40.4 | 28.8 | 40% | 30.9 | 34.0 | 30.4 | 21.2 | 1.7 | 2.4 |
| 3131 TT | GPTC | 3,305.0 | BUY | 3,000 | 47.0 | 28.2 | 52% | 41.5 | 56.8 | 42.6 | 22.4 | 1.5 | 2.5 |
| 3583 TT | Scientech | 817.0 | NC | 2,039 | 40.9 | 27.8 | 44% | 23.5 | 27.7 | 25.2 | 16.6 | 1.2 | 1.7 |
| BESI NA | BE Semiconductor | 254.8 | BUY | 23,662 | 59.1 | 35.4 | 57% | 69.4 | 84.6 | 44.9 | 28.2 | 1.6 | 2.7 |
| 042700 KS | Hanmi Semiconductor | 223,000.0 | BUY | 14,053 | 70.7 | 36.9 | 83% | 37.3 | 49.8 | 53.9 | 26.9 | 0.5 | 0.9 |
| 6590 JP | Shibaura (N.A.) | 5,930.0 | NC | 2,560 | 23.7 | 20.7 | 28% | 23.7 | 25.8 | n.a. | n.a. | 1.5 | 2.0 |
| KLIC US | Kulicke &Soffa | 111.4 | NC | 5,829 | 33.2 | 26.3 | 15% | 20.9 | 23.9 | n.a. | n.a. | 0.7 | 0.7 |
| Taiwan peers average | Taiwan peers average | Taiwan peers average | Taiwan peers average | Taiwan peers average | 42.1 | 23.4 | 67% | 32.7 | 51.4 | 33.6 | 21.1 | 1.8 | 2.7 |
| Overseas peers average | Overseas peers average | Overseas peers average | Overseas peers average | Overseas peers average | 42.3 | 28.4 | 38% | 33.9 | 40.4 | 39.1 | 24.0 | 1.1 | 1.5 |
| Global peers average | Global peers average | Global peers average | Global peers average | Global peers average | 42.2 | 25.5 | 55% | 33.2 | 46.8 | 35.6 | 22.2 | 1.5 | 2.2 |
Source: BofA Global Research estimates, Bloomberg
Exhibit 9: All Ring's 2026-2028 estimates - BofA vs. Street
BofA estimates for 2028 are 5% behind consensus on more realistic capacity expansion and new technology ramp assumptions
| 2025 | 2026E | 2026E | 2026E | 2027E | 2027E | 2027E | 2028E | 2028E | 2028E | |
|---|---|---|---|---|---|---|---|---|---|---|
| Actual | BofAe | Street | vs. street | BofAe | Street | vs. street | BofAe | Street | vs. street | |
| Sales (NT$mn) | $5,366 | $9,333 | $8,671 | 8% | $13,968 | $13,954 | 0% | $16,809 | $18,272 | -8% |
| Sales QoQ / YoY (%) | 73.9% | 61.6% | 49.7% | 60.9% | 20.3% | 30.9% | ||||
| Gross profit (NT$mn) | $2,913 | $4,940 | $4,608 | 7% | $7,499 | $7,426 | 1% | $9,100 | $10,050 | -9% |
| GMs (%) | 54.3% | 52.9% | 53.2% | 0% | 53.7% | 53.2% | 0% | 54.1% | 55.0% | -1% |
| Operating profit (NT$mn) | $1,611 | $2,741 | $2,723 | 1% | $4,471 | $4,805 | -7% | $5,762 | $6,419 | -10% |
| OpMs (%) | 30.0% | 29.4% | 31.4% | -2% | 32.0% | 34.4% | -2% | 34.3% | 35.1% | -1% |
| Pretax profit (NT$mn) | $1,813 | $3,026 | $2,846 | 6% | $4,782 | $4,920 | -3% | $6,093 | $6,573 | -7% |
| Pretax margins (%) | 33.8% | 32.4% | 32.8% | 0% | 34.2% | 35.3% | -1% | 36.2% | 36.0% | 0% |
| Tax expense (NT$mn) | -$328 | -$478 | -$506 | -5% | -$755 | -$890 | -15% | -$956 | -$1,192 | -20% |
| Tax rate (%) | 18.1% | 15.8% | 17.8% | -2% | 15.8% | 18.1% | -2% | 15.7% | 18.1% | -2% |
| Net profit (NT$mn) | $1,485 | $2,549 | $2,341 | 9% | $4,028 | $4,030 | 0% | $5,137 | $5,382 | -5% |
| Net margins (%) | 27.7% | 27.3% | 27.0% | 0% | 28.8% | 28.9% | 0% | 30.6% | 29.5% | 1% |
| EPS (NT$) | $15.46 | $26.46 | $26.75 | -1% | $41.82 | $41.47 | 1% | $53.34 | $55.89 | -5% |
Source:
BofA Global research estimates, Bloomberg
BofA GLOBAL RESEARCH
BofA GLOBAL RESEARCH
BofA GLOBAL RESEARCH
Ride on advanced packaging uptrend with solid market position
All Ring was founded in 1996 headquartered in Kaohsiung and listed on the Taiwan Exchange in 2002. It started business from supplying the passive component automation equipment in early 2000 during the industry supply tightness and growing trend of import substitution with limited domestic tool available at that time. However, with the MLCC industry supply consolidated through the cycles and emerging China competitors, the company diversified its R&D focus to LED process equipment in 2008 and more importantly the semiconductor back-end equipment development since early 2010s. The early stage business transformation shifted its sales exposure from heavily relying on passive equipment from 2000-10 to 40% passives, 30% semis and 30% LCD/LED in ' 13.
Exhibit 10: All Ring's key development milestone
All Ring was reorganized as a semiconductor tool provider since 2016
| Year | Milestone |
|---|---|
| 1996 | All Ring was established and mainly developed passive component automation equipment |
| 2002 | Listed on Taipei Exchange |
| 2008 | Developed LED process equipment |
| 2013 | Developed SiP process equipment |
| 2015 | Developed PSA attachment equipment |
| 2016-2017 | Developed ACF/OCA attachment, AOI for advanced packaging, underfill dispenser, etc. |
| 2020-2021 | Developed AOI six-sided inspection equipment, wafer inspection equipment, etc. |
| 2022 | Developed heat sink attachment equipment for film TIM |
| 2023 | Developed heat sink attachment equipment for metal TIM, dual-valve underfill dispenser, etc. |
| Sales accelerated along with TSMC CoWoS capacity expansion |
Source: BofA Global Research, Company data
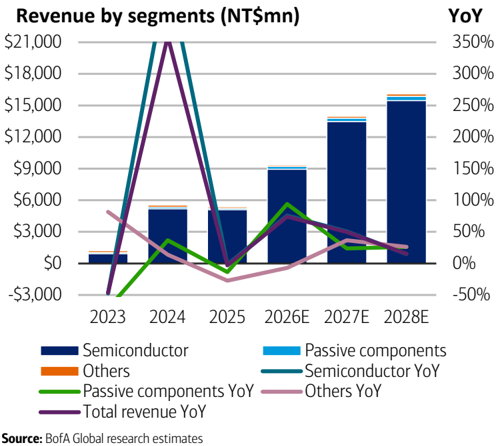
A more important milestone for the company happened in mid-2010s when its semiconductor packaging equipment solutions saw more customer traction more than offsetting the headwind it faced in the LCD/LED business seeing oversupply and China competition. All Ring was reorganized as a semiconductor tool provider since 2016 through accelerating its equipment roadmap and localizing its R&D/service teams next to the back-end clusters. Specifically, it rebuilds its R&D capability around software strength, with 60% of its R&D headcount in software engineers. Based on our estimate, the company generated 95% revenue from its semiconductor business in 2025, followed by 2% from passive component equipment sales and 3% from the rest of the business.
Asset light model: focusing on hardware and software design while outsourcing the equipment production
Exhibit 11: Key oS process related to All Ring's equipment portfolio and All Ring's major competitors All Ring mainly provides equipment for underfill, heat sink attachment, and AOI process
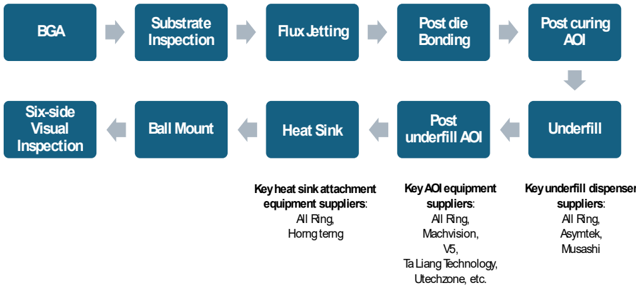
Source: BofA Global Research
BofA GLOBAL RESEARCH
BofA GLOBAL RESEARCH
Wafer
01
On PCB/ FOPLP
Underfill Dispenser
02
03
Instead of owning its production lines, All Ring runs the asset-light design-assemblyintegration model by outsourcing the majority of the equipment production to its subcontracting partners. In the meantime, it sources the critical components including precision stages, vision systems and dispense valve while focuses on proprietary design work including the recipe buildup, optics integration, and control code.
The effort on getting qualified by the foundry and OSAT customers and re-building itself as an integrated equipment supplier for advanced packaging started bearing fruit in 2023 when AI capex accelerated, with its sales up by 360% YoY in 2024 along with TSMC ' s CoWoS capacity expansion dominated All Ring ' s sales. In addition, it won itself the recognition by its major foundry and OSAT partners including TSMC ' s innovation supplier awards in 2025 and ASE ' s supplier award.
A comprehensive back-end equipment portfolio provides its customers with one stop shopping solution
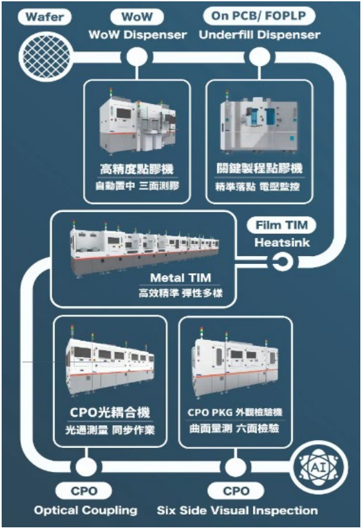
All Ring ' s equipment catalog maps directly to the steps becoming more challenging as AI semiconductor packaging technology migrates from conventional flip chip to CoWoS, SoIC, CPO, panel level packaging and higher power thermal modules. The technology upgrade requires higher level of precision material dispensing, heterogenous bonding, thermal interface control, in-line inspection, optical coupling and full line automation. We profile the company ' s major products including dispensing, AOI, bonding, optical coupling and precision automation as below:
Exhibit 12: All Ring's major equipment offerings
All Ring has solutions across underfill dispensing, TIM, CPO coupling and automation
Source: BofA Global Research, Company data
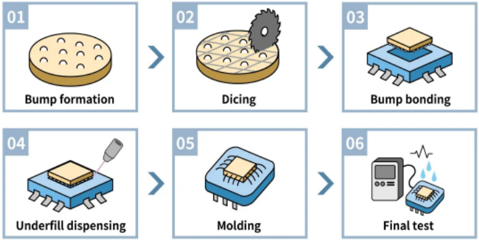
Exhibit 13: Major back-end process steps
Semis back-end process typically includes bonding, bumping, dicing, underfill dispensing, molding and testing
Source: Rapidus, BofA Global Research
WoW
BofA GLOBAL RESEARCH
- Dispensing: All Ring ' s most important product as it sits at the intersection of yield, reliability and package scaling. In advanced packaging, dispense tools are used for underfill, dam-and-fill, flux spray, adhesive coating and encapsulationadjacent steps in the increasing large-area wafer/panel-level processes.
BofA GLOBAL RESEARCH
Contact pad.
Couver. Aneue
Underfill
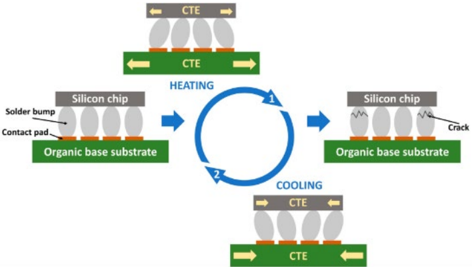
Exhibit 14: Chipset with underfill protection prevents malfunction through heating/cooling cycles Crack
CTE mismatch between the chip and organic substrate under thermal cycling could lead to mechanism failure easily without underfill
COOLING
Source:
MDPI, "Underfill: A Review of Reliability Improvement Methods in Electronics Production BofA GLOBAL RESEARCH
Dispensing is critical as it requires void-free flow around tens of thousands of micro-bumps to improve the chipset reliability across the interposers which are getting larger as the technology migrates, with TSMC ' s CoWoS capable of 5.5x reticle chipset package now and targeted to support up to 9x/14x reticle size package in 2027/28 amid more complex chipset design.
All Ring ' s dispense portfolio covers several material-delivery categories including piezo dispensing platform for micro volume and high-speed dispensing with nano-liter level control, screw-pump platform addresses high viscosity materials (e.g. silver/thermal paste) and spray dispensing designed for non-contact, large area thin layer coating including under-fill like materials.
Importantly, All Ring ' s knowledge in dispensing compounds through its process recipes and customer qualification over the past decade rather than hardware itself. It has also been developing the dispensing valve in house, making the platforms highly customizable to customers ' process specs with real time inspection, auto-calibration and cross machine automation, further strengthening the yield control on the advanced packaging processes.
While competing with its global peers including Asymtek in the US and Musashi Engineering in Japan, the key strength All Ring has is it has been co-developing with TSMC on the recipes for CoWoS which was subsequently used by ASE for further capacity expansion as the business outflows, allowing the company to gain meaningful share along with the industry growth. We believe All Ring as a qualified local supplier with strong track record at its foundry and OSAT customers should be in a solid position to capture further share beyond its currently leading position in the WoS dispensing equipment supply.
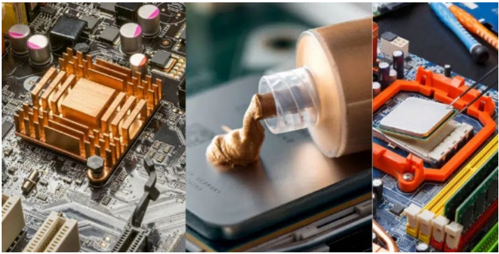
- Thermal/heat-sink attach. The thermal interface between the logic die, package lid, heat spreader and system cooling solutions becomes more critical to device reliability control, especially with AI and HPC packages moving to higher power density. For All Ring, it has process solutions across film TIM, metal TIM and paste TIM, providing micron-level thickness control, high uniformity coating / bonding, void control and process repeatability. In addition, the company offers thermal compression solutions which can reduce interfacial voids, improve bonding uniformity and enhance thermal conductivity, suitable for high-power and high-density packages widely adopted in AI applications.
CTE
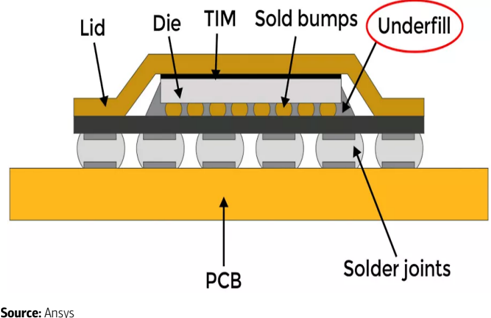
Exhibit 15: Flip chip underfill diagram
Underfill enhances the reliability of chipset in different environment
BofA GLOBAL RESEARCH
- Ultra Fast 2D & 3D Sensor
TIM 2
Exhibit 16: Common types of TIMs used in semiconductor
Major TIMs include thermal grease, gap filler pads, thermal tapes/films, cured dispensed gap fillers and phase change materials
• Shadow Free Dual Laser: 3D
Underfill
Air -
Epoxy / paste
Couveo. Mordeon VICTCCLI
Source: Thermtest Instruments
BofA GLOBAL RESEARCH
Similar to underfill equipment supply for CoWoS capacity, while All Ring is competing with major back-end equipment suppliers (e.g. Shibaura, ASM Pacific), each heat sink requires customization but at low pricing, reducing the risk for 1 st tier competitors to prioritize the business.
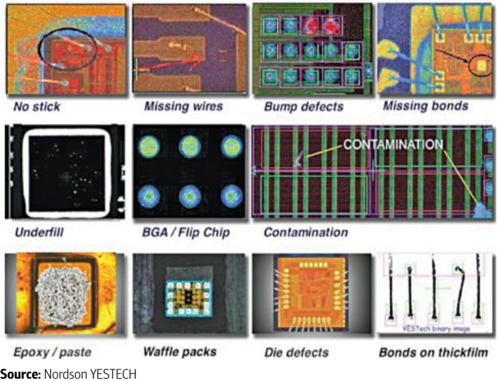
- AOI and optical inspection. AOI is a yield protection and process feedback process across traditional and advanced packaging. All Ring ' s AOI platform features high precision positioning at the 20um level, multi-light source configurations and integration with loaders, unloaders and robotic handling and covers the functions including die-attach inspection, post dispensing inspection, solder-ball inspection and six-sided final inspection.
Exhibit 18: The defects AOI equipment checks
AOI checks components during manufacturing and ensures they meet the required design criteria
BofA GLOBAL RESEARCH
The business is growing its importance in the advanced packaging as the failure cost gets higher, with one undetected defect in a multi-die AI package scrapping the value of expensive logic tile, HBM and substrate. This is especially the case the stacking becomes more complex across 2.5D/3D packaging technologies.
Source: Nordson YESTECH
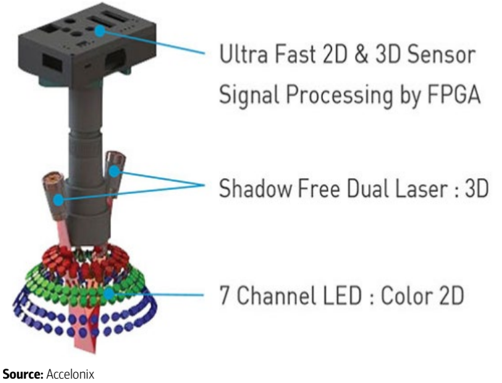
Exhibit 19: The major components for 2D/3D AOI inspection
AOI system typically includes lighting system, inspection camera, conveyor system and software algorithm specifically designed for AOI
BofA GLOBAL RESEARCH
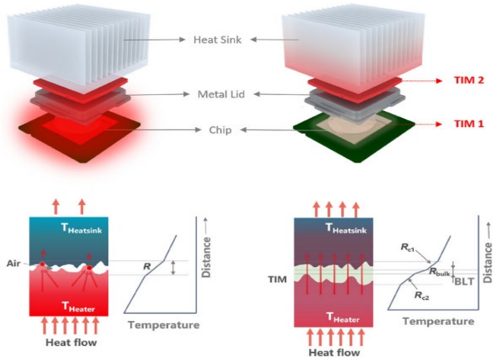
Exhibit 17: Heat sink, metal lid, and TIM for chips
Thermal interface becomes more critical to device reliability control
Source: SusMat "Thermal interface materials: From fundamental research to applications"
BofA GLOBAL RESEARCH
- CPO / optical coupling. All Ring ' s optical coupling platform is designed for photonics integration, where the critical challenge is not placing components but aligning optical paths with sufficiently low insertion loss. To support the CPO development, the company developed a six-axis motion platform with realtime optical power feedback, passive/active alignment, 2.5um positioning accuracy, 5nL dispensing accuracy, UV curing compensation and immediate optical verification through power measurement and insertion loss testing.
While the sales contribution is limited at this stage, the business is strategically important as CPO manufacturing combines several of All Ring ' s existing competencies including precision alignment, adhesive dispense, curing compensation, optical verification, fragile material handling and automation. We would note the company at Semicon West in 2025 already demonstrated its optical coupling and precision dispensing system featuring an optical coupling platform for CoWoS chipset and FAU along with a 600mm x 600mm panel underfill dispenser for large size substrate packaging.
- Bonding/lamination and automation. All Ring ' s bonding, lamination and automation business provides value add on the heterogenous integration focusing on bonding-critical capabilities including micron-level alignment, multi-axis motion control, precise bonding force control and material compatibility. It is also important to note the company ' s strength on process tuning, data feedback and yield control, and shipping the full line/multi-process solutions to its customers rather than discrete equipment increases the customers ' stickiness and lift the content it could capture per project.
- Legacy passive component and LED equipment. All Ring provides cutting, coil winding, resistor stacking and LED sorters to its customers though the business has been declining to low single digit of its revenue with limited growth opportunity.
Expanding service network to support TSMC's manufacturing footprint expansion
With All Ring ' s business highly skewed toward advanced packaging in recent years, the company ' s customer mix is also led by ASE/SPIL at 44%/34% on the back of TSMC ' s continued outsourcing of the WoS business, followed by TSMC at 11%. Amkor following its Arizona facility readiness in 2H27 should also grow meaningfully to the company.
Notably, All Rings Board approved in 1Q26 to enlarge its US and Japan subsidiaries which we believe the main goal is to support TSMC ' s Arizona and Kumamoto advanced packaging ecosystem. With the company ' s proven track record and willingness to provide local R&D and real time service support, we expect it to be considered as the first batch of back-end equipment suppliers as TSMC grows its overseas capacity.
Solid sales backed by the accelerated advanced packaging expansion
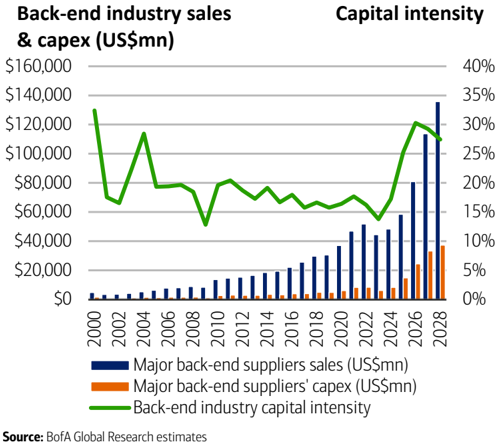
The back-end packaging and testing industry has operated with more modest capex than front-end manufacturing with a lower level of technology complexity. This is evident from much lower capital intensity historically at 15-20% range. However, the slower technology migration and more affordable equipment have also attracted more competition, leading to a more fragmented supply landscape, and a higher level of cyclicality of the industry capex trend vs. foundries.
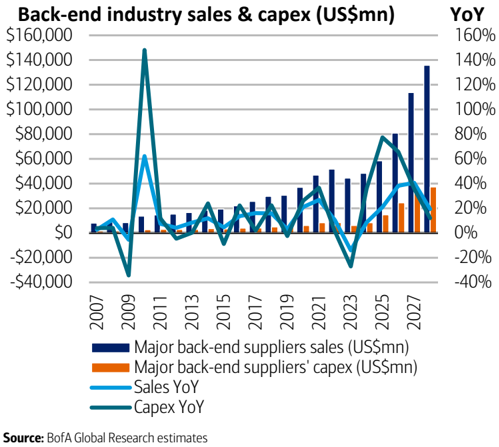
Historically, the industry would correct their capex every 1-2 years before another round of investment acceleration. However, in the current cycle, amid strong high-performance computing demand, the major back-end suppliers have been revising up their capex budget since 2H23. Following a 36% YoY capex growth in 2024, the back-end supply chain grew the capex by another 77% YoY to US$15bn in 2025 and is on track to rise by
another 60% YoY US$24bn in 2026. While the growth could be more moderate in 202728 at 40% CAGR off a high base, we believe the severe undersupply, the shift in competitive landscape with Intel ramping its own solutions along with the capacity builds for new technology ramp could drive the investment upside vs. our base case .
Specifically, based on our estimate, TSMC ' s back-end capex could grow by another 100% YoY in 2026, representing 31% of the industry back-end investment (vs. 24% in 2025), backed by its technology leadership in the advanced packaging solutions.
On top of TSMC ' s aggressiveness, ASE and Amkor ' s target to gain more exposure to capture the AI spillover orders in Taiwan and US will also drive the growth, supplemented by a modest acceleration of capital spending from Powertech for its panel level packaging deployment. Amid accelerating investment, the capital intensity for the back-end industry could rebound to 25-30%, the upper half of its long-term range, through the next few years until supply finally catches up with demand.
Exhibit 20: Semiconductor back-end sales, capex and growth trend Back-end is now entering a new phase of expansion
BofA GLOBAL RESEARCH
From the capacity perspective, while TSMC is leading on the packaging technology innovation, the insufficient supply is driving more business outflow from the company. ASE and Amkor set to accelerate their CoWoS-like solutions, FoCoS and SWIFT, respectively from 2026-28 to accommodate more outsourcing demand from TSMC and direct orders from their fabless and system house customers.
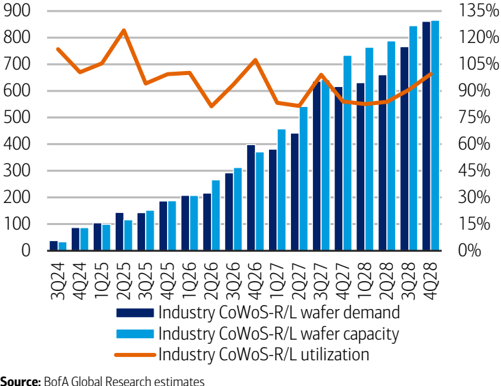
With surging server CPU demand on top of the already strong order backlog for GPUs and ASICs, we estimate the industry ' s CoWoS supply will need to grow by 52% CAGR from 2026-28. TSMC will still lead the capacity expansion from 120k WPM in 4Q26 to 180k WPM in 4Q27, while the OSATs will also grow their portion of the supply with ASE and Amkor adding capacity to 70-75k WPM (vs. 30-35k in 4Q26) and 25-30k WPM (vs. 15-20k by 4Q26) in 4Q27 respectively. Specifically, while TSMC will still lead the supply for complex GPU and ASIC packaging, ASE grows as a major 2 nd source with its capacity share growing from 14% of the industry in ' 26 to 23% in ' 27 and proven track record as the major CoWoS full process server provider for AMD ' s Venice server CPU.
Exhibit 21: Semiconductor back-end sales, capex and capital intensity Back-end capital intensity rising from 2024-26 on advanced investment
BofA GLOBAL RESEARCH
Interconnect 10 Count
Logic-on-Logic
Chip 1
Chip 2
a..u
...
Exhibit 22: Industry CoWoS-R/L supply/demand
CoWoS-R/L utilization should stay at high levels
BD: 2 N4 (TSV)
Pitch: 6um
TD: N2P
BD: 2 N3P (TSV)
Pitch: 6um
TD: N2P
BD: 2 N2P (TSV)
Industry CoWoS-R/L wafer supply/demand (k WPQ) CoWoS-R/L utilization
BofA GLOBAL RESEARCH
Hybrid bonding the next frontier for performance boost
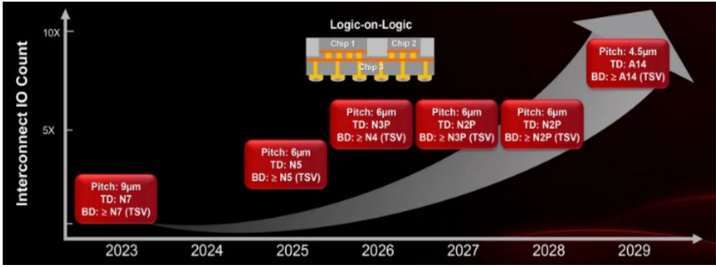
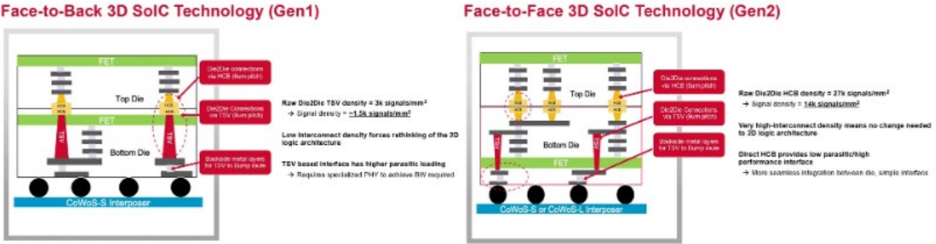
Beyond 2.5D packaging technology roadmap, the most critical inflection in high-end AI chipset packaging is the migration to direct copper to copper (Cu-Cu) hybrid bonding. Despite current challenges in thermal management, yield, bonding precision and test complexity, the much shorter interconnect distance and potentially higher bandwidth density 3D packaging could further enhance the chipset performance.
Exhibit 24: TSMC SoIC roadmap
3D hybrid bonding could achieve shorter interconnect distance and finer pitches
Source: TSMC
Source: BofA Global Research estimates
Pitch: 4.5um
TD: A14
BD: 2 A14 (TSV)
Exhibit 23: Industry CoWoS demand
CoWoS demand should remain strong through 2028
2029
Source:
BofA Global Research estimates
BofA GLOBAL RESEARCH
BofA GLOBAL RESEARCH
By abandoning legacy solder microbumps, 3D hybrid bonding achieves sub-10mm interconnect pitches, enabling vertical cache and logic stacking with low latency penalties. AMD has validated the roadmap with its 3D V-Cache and is accelerating its use in sever CPUs, with its 6 th generation EPYC Venice processors scaling up to 256 Zen 6 cores on TSMC ' s 2nm and leveraging a combination of TSMC ' s SoIC-X and CoWoS-L to manage the extreme compute density.
We expect Nvidia to leverage the solution for its Feynman GPU in 2028 for its LPU integration. The technology is also gaining more traction for the hyperscalers ' CPUs to stack the compute tile with SRAM to enable wider memory bandwidth for faster data transmission, with Google in early engagement on developing its own server CPUs for multiple dies stacking based on the supply chain feedback.
Face-to-Back 3D SolC Technology (Gen1)
FETE
Notably, Broadcom has also been working with Fujitsu to build the company ' s Monaka supercomputer CPU, a general-purpose data center processor featuring 4 computing tiles (36 ARMv9 cores per tile) on TSMC ' s 2nm set to ramp production in 2027. The computing tiles would be stacked face-to-face (F2F) with the SRAM chiplets built on 5nm through hybrid copper bonding (HCB), equipped with a large I/O die integrating DDR5 memory controllers and PCIe 6.0 connectivity with CXL 3.0 support. By stacking compute tiles with the SRAM tiles, the chipset could add meaningfully more cache to Armv9 cores to maximize their single-thread performance. FET
Exhibit 25: 3D SoIC technology
Face-to-Back and Face-to-Face 3D packaging technology comparison
Source: TSMC
We estimate TSMC ' s SoIC capacity will reach 20k WPM by 4Q26 and will need to grow to 35k WPM by 4Q27 and further to 50k WPM by 4Q28 with the applications proliferating from AMD ' s GPUs to Apple ' s M-series CPUs in 2026, hyperscalers ' customized ARM based server CPUs in 2027 and adoption by Nvidia for its Feynman GPU along with the inflection of CPO penetration in 2028.
Exhibit 26: TSMC SoIC supply/demand trend
TSMC's SoIC capacity will reach 20k WPM by 4Q26 and will need to grow to 35k WPM by 4Q27
Source: BofA Global Research estimates
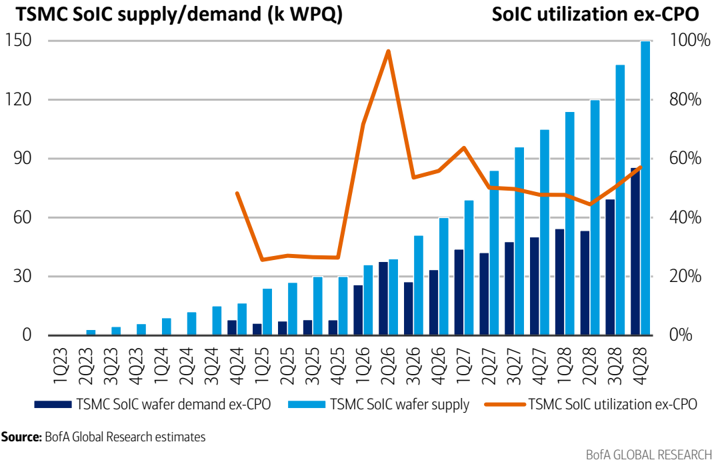
Similar to CoWoS, the SoIC technology could be even more important for TSMC going forward and the capacity ramp could be steep given much faster data transmission
Face-to-Face 3D SolC Technology (Gen2)
Raw Die20ie HC8 donsify = 27k signals/mm?
→ Signsi density = 14k sionalsimm"
Very tighi-istercannact density maans no change neute a 20 logic archifectun
DRSCtHCS provides low parasitic/high porformance interface
→ Ware seaninss istagration betvnan dle, sanpla mafaca
BofA GLOBAL RESEARCH
required for the HPC chipsets across CPUs, GPUs, AI accelerators and networking switches. At full utilization, we estimate SoIC could contribute US$2516mn annually to TSMC in 2028 (1% of the company ' s total sales)
CoPoS trial run in progress, providing another leg up in '27-28
Beyond CoWoS and SoIC, the panel level packaging is also growing more customer traction for better yield control and cost efficiency vs. wafer level packaging as the package size for AI chipsets gets bigger. TSMC ' s CoPoS pilot line started tool deliveries for R&D purpose in late 1Q26 and pilot production line is set to be ready around mid-' 26. TSMC is standardizing the 310 x 310 mm panel format to validate its equipment and material supply chain in 2026-27 before moving the technology to mass production in late 2028. It also has the goal to deliver 510 x 515mm panel technology for better economics of scale though the ramp schedule could be further beyond.
Exhibit 27: CoWoS vs. CoPoS CoPoS provides better production efficiency than CoWoS
CoWoS (Round Wafer)
Source: BofA Global Research
CoPoS (S quare P anel)
BofA GLOBAL RESEARCH
For All Ring, the company has announced its 600mm x 600mm panel dispenser in 2025 for underfill, designed for large format substrate packaging with multi-valve synchronized dispensing, closed loop flow control and temperature uniformity management to improve process stability and yield for panel level packaging applications. In addition, the company developed a fan out panel level packaging dispenser supporting the packaging applications across CoPoS, CoWoS, SoIC, CPO, IPD and InFO, with quad-pump architecture and in line automation integration.
While CoPoS technology may not be commercially ready until late 2028, we believe the milestone of the equipment qualification by TSMC would be critical in the next few quarters as the company could start pulling in equipment for the capacity ramp from 2H27 to support a fast capacity ramp in 2028-29 depending on the technology availability and customers ' demand, lifting the addressable market for All Ring similar to the 1 st wave of the CoWoS capacity build acceleration in 2023-24.
Dispensing content grows as advanced packaging technology migrates
Along with the industry ' s capacity expansion on the CoWoS and SoIC and spec upgrade in these technologies, we believe the importance of dispensing will grow as the underfill protects microbumps, redistributes mechanical stress, fills tiny gaps, suppresses voids and improve thermal-cycle reliability. Notably, on the wafer level, the capillary underfill volume would scale with interposer area and bump count while the dispense time will ramp with flow length and pass count as large multi-die packages require more
controlled material flow, better void suppression and more repeatable dispensing recipes. TSMC also stated RDL layer and C4 /underfill layers provide a buffer against CTE mismatch and reduce strain energy density in the C4 bump area.
From the technology perspective, moving from 3.3x reticle package to 5.5x implies 67% interposer area growth and would be 4.2x the area when further moving to 14x reticle size CoWoS packaging when TSMC commercializes the solution in 2028. In addition, more compute tiles and HBM stacks in larger reticle size CoWoS means more die edges, microbump fields, dispense keep-out zones, leading to higher chance for voids / flow defects. The multi-layer local silicon interface in CoWoS-L vs. single silicon interposer for CoWoS-S also drives another layer of package design variation, favoring recipeintensive dispensing suppliers who can customize their solutions for their customers.
For instance, a 4x reticle Rubin GPU interposer carries 3x the area of a Hopper GPU package, driving more dispense passes, longer flow and cure cycles and tighter voidcontrol windows and lifting the number of dispenser demand per 1k WPM. On top of longer dispensing process, the migration from CoWoS-S for Hopper GPU packaging to CoWoS-L adds bridge level underfill and encapsulation insertions.
At this stage, while All Ring at this stage mostly supplies its dispensing solutions for the chipset level on-substrate process of the CoWoS technology and is seeing limited benefit from the higher level of complexity in the wafer process, we believe the fast growing unit demand of the semiconductor chipsets should still allow the company to grow along with industry capacity growth. Notably, ASE already kicked off 15 greenfield facility construction for its plan to accelerate capacity expansion across advanced packaging and testing though 2030.
Exhibit 28: All Ring revenue mix by technologies CoWoS revenue ramped up meaningfully from 2024
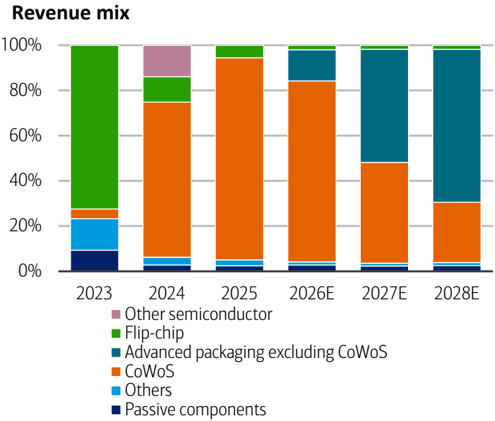
Source: BofA Global research estimates
Exhibit 29: All Ring revenue by segments
Semiconductor segment is the main sales driver
Source: BofA Global research estimates
BofA GLOBAL RESEARCH
BofA GLOBAL RESEARCH
Comprehensive TIM offerings lift bar for competition
AI/HPC chipset power density grows as compute silicon gets bigger and more HBM and die to die functions are integrated, forcing the thermal path to handle a much larger heat flux over a larger and more mechanically fragile package. The lid/heat-spreader area also grows with package area, resulting a higher requirement of TIM thickness uniformity. In addition, the die height difference in a package would lead to higher thermal resistance while underfill/TIM voids can create another layer of reliability and hot-spot issues.
Beyond the physical challenges, the material mix to form TIM becomes complicated as each solution (e.g. paste TIM, metal TIM and film TIM) is not interchangeable. High-end AI packages may need different TIM material systems depending on customer power target, lid design, reliability requirement and module architecture.
All Ring ' s platform supports different TIM solutions to fit customers ' requirements while its integrated thermal process solutions emphasize multi-process integration, lower manual intervention, reduced alignment errors, stable cycle time and better reliability. The capability is more valuable as package size grows, with induced warpage and alignment variation meaningfully impacting production yield. As one of the few qualified suppliers for TIM attach in the CoWoS flow and even more limited competition providing total solutions, we believe All Ring ' s business should drive significant content opportunity at an accretive margin.
Industry capacity growth and content gains supporting business visibility at resilient margins
We believe All Ring should maintain its high share in the dispensing equipment supply in the CoWoS and the upcoming CoPoS solutions through its strong technology capability in meeting the requirements from its foundry and OSAT customers across dispensing recipes, thermal process conditions, bonding parameters and inspection thresholds. In addition, compared with its global peers, the company has higher flexibility to provide highly customized solutions.
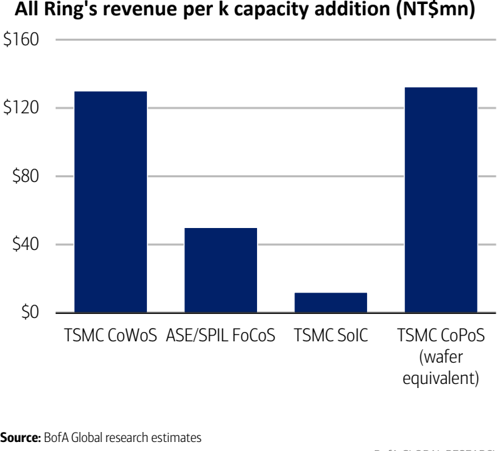
As packages become larger and more expensive, customers tend to prefer the equipment supply chain with track record rather than switching aggressively for cost savings. More importantly, the heat sink/TIM business should become a second growth engine for All Ring on more demand for TIM thickness control, heat spreader attach, bonding force control and void inspection. Along with its strength in dispensing, inspection and automation, this should drive higher level of customer stickiness.
Exhibit 30: All Ring's revenue per k capacity addition by technologies CoWoS / CoPoS have higher content per k capacity on more TIM value
Source: BofA Global research estimates
BofA GLOBAL RESEARCH
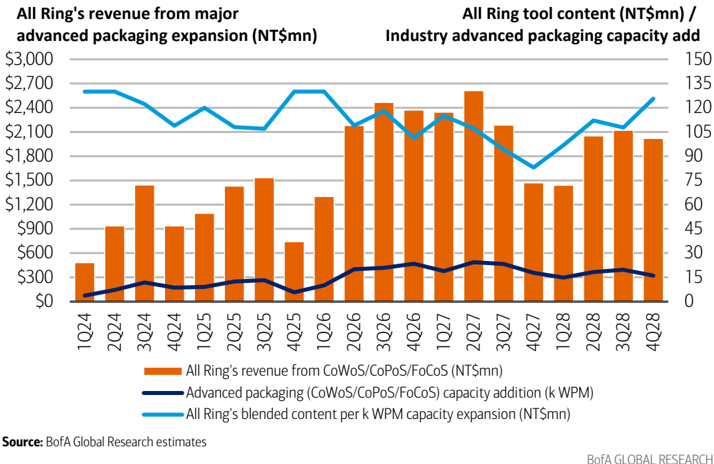
Based on our estimate of NT$130mn revenue contribution per 1k WPM CoWoS capacity addition (slightly lower content for OSAT including ASE ' s FoCoS given different process flows), our bottom up analysis on the CoWoS capacity expansion, the content gain from throughput change for different technology and the consideration for lead time between equipment shipment vs. revenue recognition, we expect All Ring ' s advanced packaging related revenue in dispensing equipment and heat sink/TIM to grow from NT$8.8bn in 2026 to NT$15.9bn in 2028 at a CAGR of 35%.
Exhibit 31: All Ring's blended content vs. packaging capacity mix Blended revenue will decline a bit in 2027 as FoCoS contribution ramps
Source:
BofA Global research estimates
BofA GLOBAL RESEARCH
Exhibit 32: All Ring's advanced packaging business trend - unit, dollar content and revenue
All Ring's advanced packaging equipment revenue could see meaningful ramp from 2H26-2027
Source:
BofA Global Research estimates
BofA GLOBAL RESEARCH
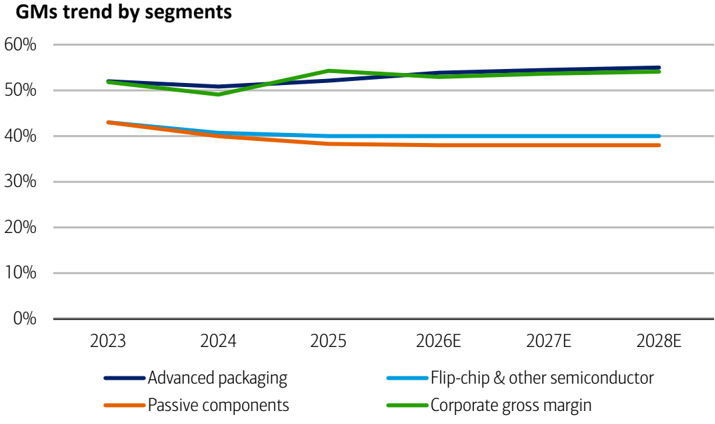
With All Ring ' s GMs for advanced packaging and flip-chip/passive components sustaining at 54-55% and 38-40% respectively in the next few years, we believe its asset-light business model outsourcing the equipment production and focus on the hardware + software solution design could drive significant operating leverage in the next few years.
Exhibit 33: All Ring GMs trend by segments
GMs for advanced packaging equipment are higher than flip-chip/passive components
Source: BofA Global research estimates
BofA GLOBAL RESEARCH
CPO as a 2 nd growth leg inflecting in 2027
As we highlighted earlier, co-packaged optics (CPO) is moving toward measured adoption, with the supply chain indicating the foundries and OSATs are pulling in the first batch of the equipment for CPO pilot production from late 2Q26. With fast growing interconnect power control becoming important, we expect the initial ramp of the technology to kick off from 2027 for selected scale-out domains before a more meaningful adoption in 2028 for high-end scale-up networking switches. To support a
Sinm
Component
LD
Lens
SMT
smooth and fast commercialization of the technology, the requirement for the equipment to deliver higher level of precision and productivity at efficient cost structure gets more stringent. · Fiber attach Metal Ild
• Lens attach
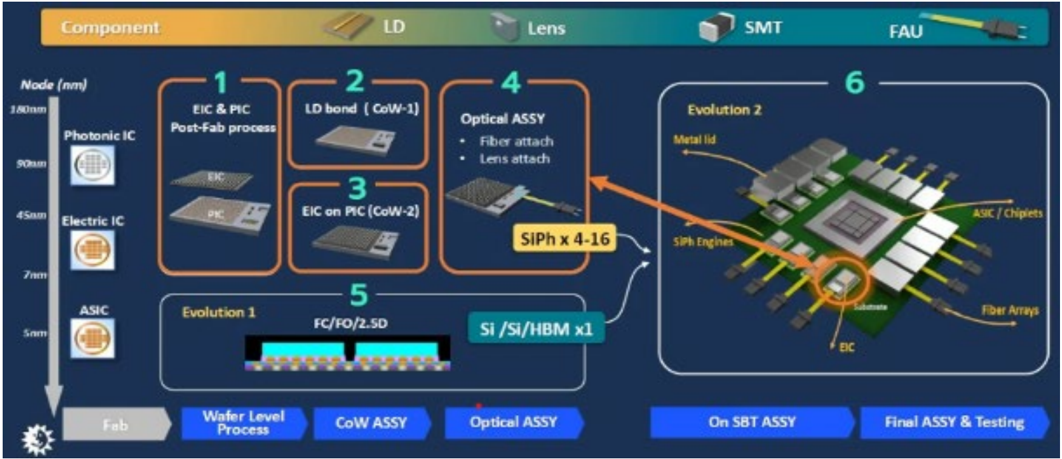
Exhibit 34: Process steps for co-packaged fabrication and assembly
The optical assembly between optical engine and fiber array unit requires high precision, leading to lower throughput
Electric IC
ASIC / Chiplets
Source: ASE
We believe All Ring should be well positioned in the equipment supply for CPO and silicon photonics as the one stop shopping solutions it provides in Taiwan across optical coupling along with its existing strength in dispensing, AOI, bonding, thermal and automation integration allows its customers to improve the production efficiency and access to the real time engineering support. Specifically, the company ' s CPO content is concentrated in four process modules including FAU optical-engine coupling, post attach AOI, integrated SiPh inspection/test cells and thermal attach solutions.
The company ' s strength is the FAU coupling cell which combines an in-house six-axis arm, machine-vision recognition, alignment search algorithm, epoxy dispensing and UV cure in one offering. This addresses the highest value bottleneck in the CPO flow across active optical alignment where sub-micro multi-channel tolerance, coupling loss and post-cure shift determine the yield and value of the tool. The key advantage is vertical control of the arm, vision and software stack which allows All Ring to improve cycle time internally rather than relying on 3 rd party subsystems.
Another competitive edge All Ring has is the heat sink attach solutions as OE switch packages are sensitive to temperature and stress, making the attach force, warpage control and bond-line uniformity more demanding than in conventional lid attach. The company ' s existing TIM attach process knowledge should therefore be relevant, with graphene thermal sheet lamination representing potential upside.
With All Ring ' s proven track record in advanced packaging across precision motion, machine vision, dispense/cure control and inline inspection, The fast-growing equipment demand to enable CPO adoption gives the company and opportunity to diversify from its dominating sales exposure in the advanced packaging. Given the demanding requirement for the alignment between FAU and the OE engine with tight loss budgets, the barrier for the tool design and manufacturing is high as it needs to power the optical path, search the optimal position across six degrees of freedom, dispense UV epoxy, cure without excessive drift and re-verify insertion loss before the engine proceeds to AOI.
6
FAU
BofA GLOBAL RESEARCH
Exhibit 35: CPO networking switch shipment and wafer demand opportunity for TSMC
TSMC could see 3% sales contribution from CPO networking switches by '30 using its front-end and back-end solutions
| 2024 | 2025 | 2026 | 2027 | 2028 | 2029 | 2030 | |
|---|---|---|---|---|---|---|---|
| 25.6T switching ASIC | 0 | 1 | 0 | 0 | 0 | 0 | 0 |
| 51.2T switching ASIC | 0 | 1 | 0 | 0 | 0 | 2 | 5 |
| 102T switching ASIC | 0 | 0 | 0 | 0 | 1 | 17 | 37 |
| 204T switching ASIC | 0 | 0 | 0 | 0 | 25 | 125 | 313 |
| 57.6T IB switching ASIC | 0 | 3 | 13 | 23 | 27 | 20 | 12 |
| 115.2T IB switching ASIC | 0 | 0 | 0 | 0 | 3 | 10 | 20 |
| Scale-out CPO Switches ('000 units) | 0 | 4 | 13 | 23 | 56 | 174 | 386 |
| NVLink switching ASIC 200G | 0 | 0 | 1 | 27 | 94 | 125 | 157 |
| NVLink switching ASIC 400G | 0 | 0 | 0 | 1 | 22 | 320 | 717 |
| Non-NVLink switching ASIC 200G | 0 | 0 | 0 | 1 | 17 | 66 | 182 |
| Non-NVLink switching ASIC 400G | 0 | 0 | 0 | 0 | 0 | 0 | 0 |
| Scale-up CPO Switches ('000 units) | 0 | 0 | 1 | 29 | 134 | 511 | 1,056 |
| Blended number of OE per switch (1.6T equivalent) | 23 | 33 | 35 | 36 | 79 | 106 | 115 |
| 2024 | 2025 | 2026 | 2027 | 2028 | 2029 | 2030 | |
| Wafer demand for scale-out switch ASIC | 7 | 69 | 257 | 448 | 1,101 | 3,400 | 7,560 |
| Wafer demand for scale-out optical engine | 6 | 79 | 366 | 725 | 4,366 | 18,175 | 43,463 |
| Wafer demand for scale-up switch ASIC | 0 | 0 | 16 | 565 | 2,623 | 10,014 | 20,674 |
| Wafer demand for scale-up optical engine | 0 | 0 | 23 | 915 | 10,402 | 53,528 | 118,851 |
| Total wafer demand for networking switch ASIC (units) | 7 | 69 | 274 | 1,013 | 3,725 | 13,415 | 28,234 |
| Total wafer demand for optical engine (units) | 6 | 79 | 390 | 1,640 | 14,768 | 71,703 | 162,314 |
Source: BofA Global Research estimates
Our top down model shows the total unit demand of CPO networking switch will grow at a CAGR of 219% from ' 26-30 to 1.4mn units (10% share of 51.2T+ switch), with scaleout +133% CAGR and scale-up +498% CAGR. Factoring the front/back-end production yield, the annual wafer consumption by switch ASICs and OEs could grow to 28k and 162k units respectively by ' 30.
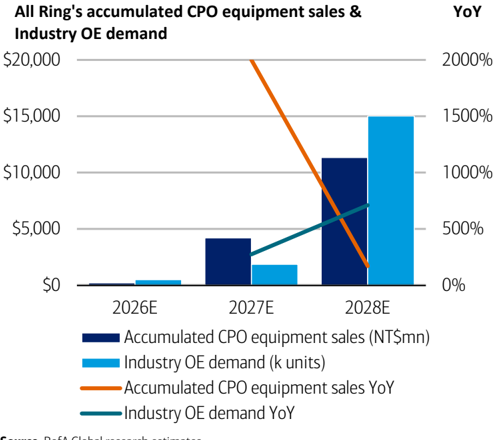
Exhibit 36: All Ring's CPO sales and industry OE demand
All Ring's accumulated CPO sales ramps with industry OE shipment
BofA GLOBAL RESEARCH
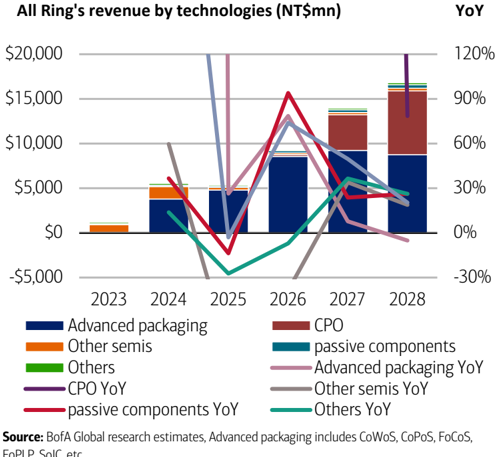
Along with fast growing demand for CPO switch, we expect CPO optical coupling equipment to start generating sales for All Ring from late-2026, with more meaningful shipment ramp-up in 2027/28. CPO would contribute 29%/42% of All Ring ' s total revenue in 2027/28 (up from only 2% in 2026) on higher equipment dollar content and larger scale of equipment installed base to satisfy customers ' expected throughput.
Source: BofA Global research estimates
Exhibit 37: All Ring's revenue by technologies
CPO should become another key growth engine from 2027
BofA GLOBAL RESEARCH
BofA GLOBAL RESEARCH
Financial analysis: multiple growth catalysts drive OpMs expansion in '27-28
Exhibit 38: All Ring's 2Q26-4Q26 estimates - BofA vs. Street
BofA estimates for 2Q26/3Q26/4Q26 are 12%/3%/28% ahead of consensus
| 1Q26 | 2Q26E | 2Q26E | 2Q26E | 3Q26E | 3Q26E | 3Q26E | 3Q26E | 4Q26E | 4Q26E | |
|---|---|---|---|---|---|---|---|---|---|---|
| Actual | BofAe | Street | vs. street | BofAe | Street | vs. street | BofAe | Street | vs. street | |
| Sales (NT$mn) Sales QoQ / YoY (%) | $1,411 | $2,355 66.8% | $2,076 47.1% | 13% | $2,723 15.6% | $2,580 24.3% | 6% | $2,844 4.4% | $2,362 -8.4% | 20% |
| Gross profit (NT$mn) GMs (%) | $731 51.8% | $1,250 53.1% | $1,111 53.5% | 13% 0% | $1,447 53.1% | $1,377 53.4% | 5% 0% | $1,512 53.2% | $1,249 52.9% | 21% 0% |
| Operating profit (NT$mn) OpMs (%) | $328 23.2% | $644 27.3% | $639 30.8% | 1% -3% | $866 31.8% | $929 36.0% | -7% -4% | $904 31.8% | $795 33.6% | 14% -2% |
| Pretax profit (NT$mn) Pretax margins (%) | $387 27.4% | $711 30.2% | $624 30.1% | 14% 0% | $938 34.5% | $906 35.1% | 4% -1% | $990 34.8% | $760 32.2% | 30% 3% |
| Tax expense (NT$mn) Tax rate (%) | -$63 16.2% | -$120 16.9% | -$118 19.0% | 1% -2% | -$148 15.7% | -$172 18.9% | -14% -3% | -$148 14.9% | -$143 18.8% | 4% -4% 36% |
| Net profit (NT$mn) Net margins (%) | $325 23.0% | $591 25.1% | $506 24.4% | 17% 1% | $791 29.0% | $735 28.5% | 8% 1% | $842 29.6% | $617 26.1% | 3% |
| EPS | $3.37 | $6.14 | $5.50 | 12% | $8.21 | $7.94 | 3% | $8.74 | $6.82 | |
| (NT$) | 28% |
Source: BofA Global research estimates, Bloomberg
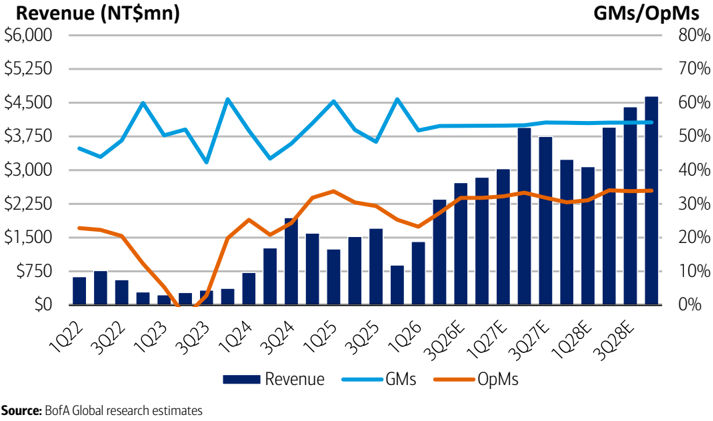
All Ring ' s 2Q26 sales rose 67% QoQ, following a decent +59% QoQ in 1Q26, driven by rapid expansion of CoWoS capacity across its foundry and OSAT customers as advanced packaging remains one of the key bottlenecks with supply still undergrowing demand for AI chipset manufacturing. We expect 2Q26 GMs/OpMs to increase by 130bps/410bps QoQ to 53.1%/27.3% on growing revenue contribution from CoWoS-related equipment.
Exhibit 39: All Ring quarterly revenue and GMs/OpMs
All Ring's sales should grow along with advanced packaging capacity expansion with resilient margins
Source: BofA Global research estimates
BofA GLOBAL RESEARCH
Off a high base in 2Q26, we model its sales to further grow by 16% QoQ in 3Q26 and another 4% QoQ growth in 4Q26 as we see its order visibility extending through 1Q27 underpinned by foundry/OSATs ' aggressive plan for advanced packaging capacity ramp to catch up demand from their AI GPU, ASIC and CPU customers.
Looking into the outlook for 2026/2027, we model All Ring ' s revenue to rise 74%/50% YoY respectively, backed by the strength in CoWoS-related equipment orders, along with increasing contribution from OSAT partner ' s CoWoS-like capacity build and next generation advanced packaging technologies ramp.
BofA GLOBAL RESEARCH
On the other hand, traditional flip-chip packaging related equipment and passive component related equipment would remain stable due to limited growth catalyst. The improving mix shift toward advanced semiconductor packaging should lift its GMs mildly to 52.9%/53.7% in 2026/27 but more importantly its higher revenue scale could drive OpMs expansion to 32% in 2027.
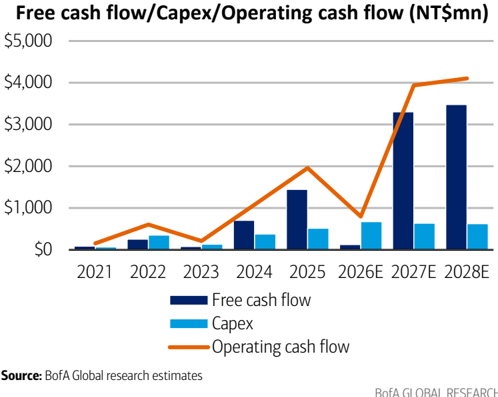
Exhibit 40: All Ring's cash flow/ Capex trend
Free cash flow will continue to trend positively on a YoY basis
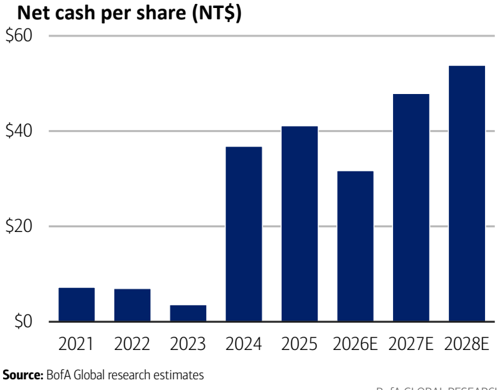
Exhibit 41: All Ring's net cash position All Ring's met cash position per share will stay at over NT$30 level
BofA GLOBAL RESEARCH
BofAe below consensus for '28 earnings on realistic expectations of packaging expansion and CPO adoption
When compared with consensus for 2027-28E EPS, our estimates are largely in line with the Street in 2027, while behind the Street by 5% in 2028. We believe our estimate adequately captures the multi-year capacity expansion cycle in advanced packaging industry on AI-related demand boom and increasing equipment dollar content on stringent packaging technology requirements. The Street may have overly positive assumption on industry SoIC/CoPoS capacity build and CPO equipment shipments.
Exhibit 42: All Ring's 2026-2028 estimates - BofA vs. Street
BofA estimates for 2028 are 5% behind consensus on more realistic capacity expansion and new technology ramp assumptions
| 2025 | 2026E | 2026E | 2026E | 2027E | 2027E | 2027E | 2028E | 2028E | 2028E | |
|---|---|---|---|---|---|---|---|---|---|---|
| Actual | BofAe | Street | vs. street | BofAe | Street | vs. street | BofAe | Street | vs. street | |
| Sales (NT$mn) | $5,366 | $9,333 | $8,671 | 8% | $13,968 | $13,954 | 0% | $16,809 | $18,272 | -8% |
| Sales QoQ / YoY (%) | 73.9% | 61.6% | 49.7% | 60.9% | 20.3% | 30.9% | ||||
| Gross profit (NT$mn) | $2,913 | $4,940 | $4,608 | 7% | $7,499 | $7,426 | 1% | $9,100 | $10,050 | -9% |
| GMs (%) | 54.3% | 52.9% | 53.2% | 0% | 53.7% | 53.2% | 0% | 54.1% | 55.0% | -1% |
| Operating profit (NT$mn) | $1,611 | $2,741 | $2,723 | 1% | $4,471 | $4,805 | -7% | $5,762 | $6,419 | -10% |
| OpMs (%) | 30.0% | 29.4% | 31.4% | -2% | 32.0% | 34.4% | -2% | 34.3% | 35.1% | -1% |
| Pretax profit (NT$mn) | $1,813 | $3,026 | $2,846 | 6% | $4,782 | $4,920 | -3% | $6,093 | $6,573 | -7% |
| Pretax margins (%) | 33.8% | 32.4% | 32.8% | 0% | 34.2% | 35.3% | -1% | 36.2% | 36.0% | 0% |
| Tax expense (NT$mn) | -$328 | -$478 | -$506 | -5% | -$755 | -$890 | -15% | -$956 | -$1,192 | -20% |
| Tax rate (%) | 18.1% | 15.8% | 17.8% | -2% | 15.8% | 18.1% | -2% | 15.7% | 18.1% | -2% |
| Net profit (NT$mn) | $1,485 | $2,549 | $2,341 | 9% | $4,028 | $4,030 | 0% | $5,137 | $5,382 | -5% |
| Net margins (%) | 27.7% | 27.3% | 27.0% | 0% | 28.8% | 28.9% | 0% | 30.6% | 29.5% | 1% |
| EPS (NT$) | $15.46 | $26.46 | $26.75 | -1% | $41.82 | $41.47 | 1% | $53.34 | $55.89 | -5% |
Source: BofA Global research estimates, Bloomberg
We see clear uptrend for All Ring ' s earnings trajectory through 2028, factoring 32% sales CAGR from advanced packaging over 2026-28E. Increasing complexity in new advanced packaging technologies, coupled with tighter technology migration timeline lead to stricter equipment qualifications and higher supplier switching costs. We believe this will strengthen customer stickiness to established suppliers, like All Ring, with proven product quality and capability to keep pace with packaging technology transition.
BofA GLOBAL RESEARCH
BofA GLOBAL RESEARCH
ROE to see further expansion on business diversification
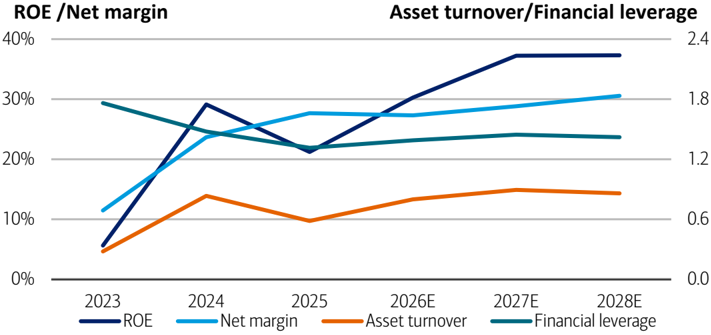
All Ring ' s ROE historically had been steady at 15~20% levels from 2015-2023, trending closely to its net margins. Its ROE expanded to over 20% from 2024 along with the accelerated revenue contribution from CoWoS.
Looking ahead, we forecast All Ring ' s ROE to improve to 30~40% in 2027/2028E, supported by net margin improvement to 25-30% from business diversification and steady asset turnover/financial leverage at around 0.8x /1.4x.
Exhibit 43: All Ring's ROE/net margin/asset turnover/financial leverage trend
We expect ROE to maintain at the 30-40% range
Source: BofA Global research estimates, company data
BofA GLOBAL RESEARCH
Robust net cash position sustain decent payout ratio
All Ring has demonstrated nice free cash flow managing capability over the years, supported by enhancing profitability along with rising AI-driven advanced packaging exposure and disciplined capex requirement as the company mainly leverage outsourced partners for equipment production. We expect free cash flow to continue to trend positively on a YoY basis going onwards.
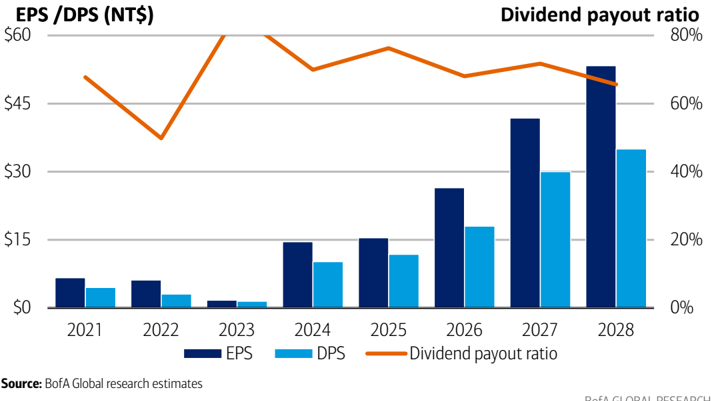
Exhibit 44: All Ring's dividend payout ratio
Dividend policy could sustain at current 65-75% levels
Source: BofA Global research estimates
BofA GLOBAL RESEARCH
All Ring has maintained its long-term dividend payout ratio largely above 65% from 2015, and we expect the improving net cash position and healthy cash flow to sustain dividend policy at current 65-75% levels.
Valuation and risk
Our PO of NT$1,500 is based on 36x 2027 P/E, positioned at the upper half of its historical trading range of 8-41x. We believe P/E based valuation is appropriate given All Ring ' s robust top-line outlook backed by strong order visibility, stable GMs profile, and operating margins expansion from higher revenue scale to support healthy earnings growth on the back of its decent exposure to AI-driven advanced packaging upcycle.
Our target PE multiple of 36x is justified by 34%/42% CAGR in sales and earnings over 2026-28E and steady ROE in the 30~40% range. All Ring ' s strong earnings growth in coming years is driven by 1) continued CoWoS/CoWoS-like capacity expansion at foundry/OSAT to meet surging demand across AI GPU/CPU/AISC vendors, 2) diversifying into next-generation advanced packaging technologies.
Exhibit 45: All Ring's P/E valuation band
All Ring's P/E of 36x is at the upper band of its range
Source: BofA Global Research estimates, Bloomberg
BofA GLOBAL RESEARCH
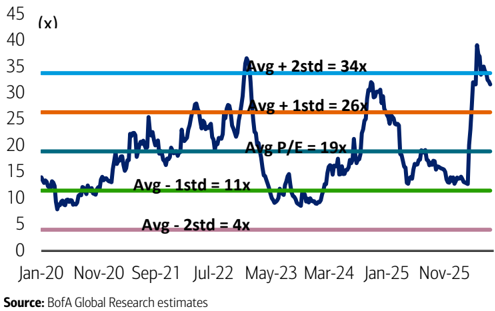
We note the company ' s valuation has been re-rated from the average of 18x 1-year forward P/E over 2020-2025 to average 25x 1-year forward P/E YTD on the back of 1) rising expectations on its optical coupling equipment business opportunity for CPO technology, and 2) expanding growth drivers beyond CoWoS to new areas such as SoIC, CoPoS, FoCoS, FOPLP, and US IDM packaging technology. We believe successful market share gain and orders win in existing/new advanced packaging process steps should serve as the main catalyst for further re-rating.
Attractive valuation vs. historical range/peer comparison
When compared with its competitors in the universe of semiconductor advanced packaging equipment supply, All Ring ' s valuation trails by 6%/2% at 40x/25x 2026/2027E P/E vs. 42x/26x for its close global equipment peers.
In our view, this valuation gap does not fully reflect All Ring ' s high exposure to AI upcycle to generate decent earnings uptrend. With sustained growth in its semiconductor equipment business on multiple growth engines, dominant market position in certain equipment segments, proven track record in new equipment development, and long-term relationship with key foundry/OSATs, we see room for the valuation discount to narrow and All Ring should see valuation premium to its global peers.
Exhibit 46: All Ring's valuation based on BofA estimates
All Ring's P/E is between 4-34x from 1-year forward perspective
BofA GLOBAL RESEARCH
Exhibit 47: Peer valuation - All Ring vs. its equipment competitors
All Ring's valuation is still at a discount to its peers average
| Ticker | Company | Share price (LC) | Rating | Mkt cap | PER (X) | PER (X) | EPS CAGR | ROE (%) | ROE (%) | EV/EBITDA | EV/EBITDA | Div. yield (%) | Div. yield (%) |
|---|---|---|---|---|---|---|---|---|---|---|---|---|---|
| (US$mn) | 2026E 2027E | 2026E 2027E | 26-28E | 2026E | 2027E | 2026E | 2027E | 2026E | 2027E | ||||
| 6187 TT | All Ring | 1,050.0 | BUY | 3,203 | 39.7 | 25.1 | 42% | 31.0 | 37.9 | 32.3 | 20.0 | 1.7 | 2.9 |
| 7751 TT | Horng Terng | 1,295.0 | NC | 1,082 | 28.4 | 12.4 | 129% | 47.2 | 124.7 | n.a. | n.a. | 2.0 | 4.1 |
| NDSN US | Nordson | 286.4 | NC | 15,956 | 24.7 | 22.8 | 8% | 18.5 | 18.1 | 18.3 | 16.9 | 1.2 | 1.2 |
| 3563 TT | MACHVISION | 721.0 | NC | 1,433 | 30.9 | 19.1 | 56% | 22.5 | 34.7 | 23.4 | 13.2 | 2.9 | n.a. |
| 7822 TT | V5 | 998.0 | NC | 1,413 | 70.6 | 25.6 | 74% | 27.4 | 24.4 | 46.2 | 32.3 | 1.3 | 2.1 |
| 6640 TT | Gallant Micro Machining | 995.0 | NC | 882 | 36.9 | 21.8 | 70% | 36.1 | 57.7 | n.a. | n.a. | 2.3 | 3.7 |
| 2467 TT | C Sun | 556.0 | NC | 2,708 | 40.4 | 28.8 | 40% | 30.9 | 34.0 | 30.4 | 21.2 | 1.7 | 2.4 |
| 3131 TT | GPTC | 3,305.0 | BUY | 3,000 | 47.0 | 28.2 | 52% | 41.5 | 56.8 | 42.6 | 22.4 | 1.5 | 2.5 |
| 3583 TT | Scientech | 817.0 | NC | 2,039 | 40.9 | 27.8 | 44% | 23.5 | 27.7 | 25.2 | 16.6 | 1.2 | 1.7 |
| BESI NA | BE Semiconductor | 254.8 | BUY | 23,662 | 59.1 | 35.4 | 57% | 69.4 | 84.6 | 44.9 | 28.2 | 1.6 | 2.7 |
| 042700 KS | Hanmi Semiconductor | 223,000.0 | BUY | 14,053 | 70.7 | 36.9 | 83% | 37.3 | 49.8 | 53.9 | 26.9 | 0.5 | 0.9 |
| 6590 JP | Shibaura (N.A.) | 5,930.0 | NC | 2,560 | 23.7 | 20.7 | 28% | 23.7 | 25.8 | n.a. | n.a. | 1.5 | 2.0 |
| KLIC US | Kulicke &Soffa | 111.4 | NC | 5,829 | 33.2 | 26.3 | 15% | 20.9 | 23.9 | n.a. | n.a. | 0.7 | 0.7 |
| Taiwan peers average | Taiwan peers average | Taiwan peers average | Taiwan peers average | Taiwan peers average | 42.1 | 23.4 | 67% | 32.7 | 51.4 | 33.6 | 21.1 | 1.8 | 2.7 |
| Overseas peers average | Overseas peers average | Overseas peers average | Overseas peers average | Overseas peers average | 42.3 | 28.4 | 38% | 33.9 | 40.4 | 39.1 | 24.0 | 1.1 | 1.5 |
| Global peers average | Global peers average | Global peers average | Global peers average | Global peers average | 42.2 | 25.5 | 55% | 33.2 | 46.8 | 35.6 | 22.2 | 1.5 | 2.2 |
Source: BofA Global Research estimates, Bloomberg
Risk discussion
- Deceleration in advanced packaging capacity expansion among foundry and OSATs could reduce manufacturing equipment demand. As All Ring ' s growth is highly correlated to packaging capacity additions, a slowdown in industry capacity build would dampen All Ring ' s top-line momentum. However, we believe this risk is manageable as sustained AI infrastructure investment and surging AI chips demand would result in continued tight supply within advanced packaging industry.
- Mis-execution in equipment development may lead to losing new business opportunities to capture next wave of multi-year uptrend in advanced packaging market. Delay in engineering development, supply chain coordination, or workforce scaling could limit new product delivery and shipment growth. However, All Ring has demonstrated solid execution capability historically, supported by its experienced R&D team (accounting for around 60% of its total employees), and long-standing collaboration with key customers during product development stage.
- New technology commercialization risk . Next generation advanced packaging technology, such as CPO and CoPoS, remain at developing stage. Slower customers ' qualifications, delayed volume production, worse-thanexpected end-market adoption could postpone meaningful revenue contribution to All Ring.
- Revenue remains highly concentrated in CoWoS , exposing the company to fluctuation in CoWoS equipment installation schedule. While revenue growth primarily relays on single technology in past few years, we expect growth to become increasingly diversified as SoIC, CoPoS, and other advanced packaging technologies ramp up.
BofA GLOBAL RESEARCH
Exhibit 48: All Ring's income statement
All Ring's quarterly and annual income statement
| (NT$mn; %) | 1Q26 | 2Q26E | 3Q26E | 4Q26E | 1Q27E | 2Q27E | 3Q27E | 4Q27E | 2024 | 2025 | 2026E | 2027E |
|---|---|---|---|---|---|---|---|---|---|---|---|---|
| Revenue | $1,411 | $2,355 | $2,723 | $2,844 | $3,032 | $3,950 | $3,751 | $3,235 | $5,535 | $5,366 | $9,333 | $13,968 |
| Cost of revenue | -$681 | -$1,105 | -$1,277 | -$1,331 | -$1,419 | -$1,844 | -$1,720 | -$1,487 | -$2,818 | -$2,453 | -$4,393 | -$6,469 |
| Gross profit | $731 | $1,250 | $1,447 | $1,512 | $1,613 | $2,107 | $2,031 | $1,748 | $2,717 | $2,913 | $4,940 | $7,499 |
| Operating expenses | -$403 | -$607 | -$581 | -$608 | -$635 | -$790 | -$838 | -$765 | -$1,289 | -$1,303 | -$2,199 | -$3,028 |
| Operating income | $328 | $644 | $866 | $904 | $978 | $1,316 | $1,193 | $984 | $1,427 | $1,611 | $2,741 | $4,471 |
| Non-opt net | $59 | $68 | $73 | $86 | $72 | $79 | $76 | $84 | $139 | $202 | $285 | $311 |
| Pre-tax income | $387 | $711 | $938 | $990 | $1,050 | $1,395 | $1,269 | $1,068 | $1,566 | $1,813 | $3,026 | $4,782 |
| Income tax | -$67 | -$118 | -$145 | -$145 | -$168 | -$219 | -$196 | -$165 | -$255 | -$316 | -$476 | -$749 |
| Unusual, extraordinary gain (loss) | $0 | $0 | $0 | $0 | $0 | $0 | $0 | $0 | ||||
| Minority | $5 | -$2 | -$2 | -$3 | $0 | -$2 | -$2 | -$2 | $0 | -$11 | -$2 | -$5 |
| Net income (A) | $325 | $591 | $791 | $842 | $881 | $1,174 | $1,071 | $901 | $1,311 | $1,485 | $2,549 | $4,028 |
| EPS (NT$) | $3.37 | $6.14 | $8.21 | $8.74 | $9.15 | $12.20 | $11.12 | $9.35 | $15.25 | $15.46 | $26.46 | $41.82 |
| %of revenue | ||||||||||||
| Gross margin | 51.8% | 53.1% | 53.1% | 53.2% | 53.2% | 53.3% | 54.1% | 54.0% | 49.1% | 54.3% | 52.9% | 53.7% |
| Opex ratio | -28.6% | -25.8% | -21.3% | -21.4% | -21.0% | -20.0% | -22.3% | -23.6% | -23.3% | -24.3% | -23.6% | -21.7% |
| Operating margin | 23.2% | 27.3% | 31.8% | 31.8% | 32.2% | 33.3% | 31.8% | 30.4% | 25.8% | 30.0% | 29.4% | 32.0% |
| Pre-tax margin | 27.4% | 30.2% | 34.5% | 34.8% | 34.6% | 35.3% | 33.8% | 33.0% | 28.3% | 33.8% | 32.4% | 34.2% |
| Net margin | 23.0% | 25.1% | 29.0% | 29.6% | 29.1% | 29.7% | 28.6% | 27.9% | 23.7% | 27.7% | 27.3% | 28.8% |
| QoQ growth (%) | ||||||||||||
| Revenue | 59% | 67% | 16% | 4% | 7% | 30% | -5% | -14% | ||||
| Gross profit | 35% | 71% | 16% | 5% | 7% | 31% | -4% | -14% | ||||
| Operating income | 46% | 96% | 35% | 4% | 4% | 24% | 6% | -9% | ||||
| Pre-tax income | 5% | 84% | 32% | 5% | 8% | 35% | -9% | -18% | ||||
| Net income | 0% | 82% | 34% | 6% | 5% | 33% | -9% | -16% | ||||
| YoY growth (%) | ||||||||||||
| Revenue | 13% | 55% | 59% | 220% | 115% | 68% | 38% | 14% | 359% | -3% | 74% | 50% |
| Gross profit | -3% | 58% | 75% | 179% | 121% | 68% | 40% | 16% | 335% | 7% | 70% | 52% |
| Operating income | -22% | 39% | 73% | 302% | 58% | 30% | 44% | 26% | 1571% | 13% | 70% | 63% |
| Pre-tax income | -8% | 40% | 81% | 169% | 198% | 105% | 38% | 9% | 874% | 16% | 67% | 58% |
| Net income | -5% | 48% | 88% | 161% | 172% | 99% | 35% | 7% | 848% | 13% | 72% | 58% |
Source: BofA Global Research estimates, company data
Exhibit 49: All Ring's cash flow
All Ring's quarterly and annual cash flow
| (NT$mn) | 1Q26 | 2Q26E | 3Q26E | 4Q26E | 1Q27E | 2Q27E | 3Q27E | 4Q27E | 2024 | 2025 | 2026E | 2027E |
|---|---|---|---|---|---|---|---|---|---|---|---|---|
| Net Income | $320 | $593 | $793 | $845 | $882 | $1,176 | $1,073 | $903 | $1,311 | $1,496 | $2,550 | $4,033 |
| Depreciation &Amortization | $22 | $21 | $22 | $21 | $22 | $21 | $22 | $21 | $56 | $69 | $86 | $86 |
| Change in Working Capital | -$308 | -$1,520 | $405 | -$1,196 | $1,325 | -$3,389 | $3,743 | -$2,640 | -$700 | $256 | -$2,619 | -$961 |
| Other Adjustments | $195 | $195 | $195 | $195 | $195 | $195 | $195 | $195 | $413 | $137 | $778 | $778 |
| Operating Cash Flow | $228 | -$711 | $1,414 | -$136 | $2,423 | -$1,997 | $5,032 | -$1,522 | $1,079 | $1,958 | $796 | $3,937 |
| Capital Expenditure | -$253 | -$149 | -$135 | -$136 | -$168 | -$162 | -$150 | -$154 | -$376 | -$513 | -$672 | -$633 |
| Proceeds From Sale of Non-current Assets | $1 | $0 | $0 | $0 | $1 | $0 | $0 | $0 | $3 | $1 | $2 | $2 |
| Acquisitions/Disposals of investments | -$190 | $47 | -$11 | -$6 | -$1 | $7 | -$3 | -$1 | -$201 | -$241 | -$161 | $2 |
| Other Adjustments | $144 | -$53 | $12 | $13 | -$2 | -$8 | $4 | $2 | $215 | $86 | $115 | -$4 |
| Investing Cash Flow | -$298 | -$155 | -$134 | -$129 | -$171 | -$162 | -$149 | -$153 | -$359 | -$666 | -$716 | -$634 |
| Net Share Issue/Repurchase | $0 | $0 | $0 | $0 | $0 | $0 | $0 | $0 | $1,394 | $0 | $0 | $0 |
| Dividends Paid | $0 | $0 | -$1,146 | $0 | $0 | $0 | -$1,749 | $0 | -$131 | -$980 | -$1,146 | -$1,749 |
| Change in Debt | -$2 | $0 | $0 | $0 | $0 | $0 | $0 | $0 | $593 | $142 | -$2 | $0 |
| Other Adjustments | -$2 | $2 | $2 | $2 | $2 | $2 | $2 | $2 | -$6 | $192 | $4 | $8 |
| Financing Cash Flow | -$4 | $2 | -$1,144 | $2 | $2 | $2 | -$1,747 | $2 | $1,851 | -$645 | -$1,143 | -$1,741 |
| Net Change in Cash | -$73 | -$864 | $137 | -$263 | $2,255 | -$2,157 | $3,136 | -$1,673 | $2,571 | $647 | -$1,063 | $1,561 |
| Forex Effect | $29 | $0 | $0 | $0 | $0 | $0 | $0 | $0 | $30 | -$1 | $29 | $0 |
| Cash, Beginning of the Period | $4,182 | $4,137 | $3,273 | $3,410 | $3,147 | $5,402 | $3,245 | $6,381 | $936 | $3,536 | $4,182 | $3,147 |
| Cash, End of the Period | $4,137 | $3,273 | $3,410 | $3,147 | $5,402 | $3,245 | $6,381 | $4,708 | $3,536 | $4,182 | $3,147 | $4,708 |
Source: BofA Global Research estimates, company data
BofA GLOBAL RESEARCH
BofA GLOBAL RESEARCH
Exhibit 50: All Ring's balance sheet
All Ring's quarterly and annual balance sheet
| (NT$mn) | 1Q26 | 2Q26E | 3Q26E | 4Q26E | 1Q27E | 2Q27E | 3Q27E | 4Q27E | 2024 | 2025 | 2026E | 2027E |
|---|---|---|---|---|---|---|---|---|---|---|---|---|
| Cash &Cash Equivalents | $4,137 | $3,273 | $3,410 | $3,147 | $5,402 | $3,245 | $6,381 | $4,708 | $3,536 | $4,182 | $3,147 | $4,708 |
| Short-term Investments | $149 | $102 | $113 | $120 | $121 | $114 | $117 | $118 | $63 | $115 | $120 | $118 |
| Notes &Accounts Receivable | $1,230 | $1,988 | $1,911 | $2,456 | $1,922 | $3,784 | $1,707 | $3,055 | $1,552 | $806 | $2,456 | $3,055 |
| Inventory | $1,569 | $3,145 | $2,404 | $3,889 | $2,242 | $5,899 | $1,759 | $4,899 | $949 | $1,114 | $3,889 | $4,899 |
| Other current assets | $171 | $140 | $133 | $140 | $146 | $140 | $140 | $142 | $230 | $118 | $140 | $142 |
| Current Assets | $7,255 | $8,649 | $7,971 | $9,752 | $9,832 | $13,182 | $10,104 | $12,921 | $6,330 | $6,335 | $9,752 | $12,921 |
| Long-term Investments | $1,262 | $1,262 | $1,262 | $1,262 | $1,262 | $1,262 | $1,262 | $1,262 | $917 | $1,106 | $1,262 | $1,262 |
| Net Fixed Assets | $2,106 | $2,238 | $2,354 | $2,472 | $2,622 | $2,765 | $2,897 | $3,033 | $1,298 | $1,879 | $2,472 | $3,033 |
| Other Assets | $2,417 | $2,495 | $2,624 | $2,754 | $2,902 | $3,037 | $3,173 | $3,310 | $1,549 | $2,168 | $2,754 | $3,310 |
| Long-term Assets | $3,679 | $3,757 | $3,886 | $4,016 | $4,163 | $4,299 | $4,435 | $4,572 | $2,466 | $3,274 | $4,016 | $4,572 |
| Total Assets | $10,934 | $12,406 | $11,857 | $13,768 | $13,996 | $17,482 | $14,539 | $17,493 | $8,796 | $9,609 | $13,768 | $17,493 |
| Short-term Loans/Bills | $0 | $0 | $0 | $0 | $0 | $0 | $0 | $0 | $0 | $0 | $0 | $0 |
| Notes &Accounts Payable | $1,134 | $1,949 | $1,536 | $2,370 | $1,514 | $3,645 | $1,171 | $3,017 | $888 | $564 | $2,370 | $3,017 |
| Current Portion of Long-term Debt | $82 | $82 | $82 | $82 | $82 | $82 | $82 | $82 | $0 | $7 | $82 | $82 |
| Other Current Liabilities | $2,432 | $1,693 | $1,570 | $1,691 | $1,846 | $1,700 | $1,775 | $1,829 | $970 | $1,069 | $1,691 | $1,829 |
| Current Liabilities | $3,648 | $3,724 | $3,188 | $4,143 | $3,442 | $5,427 | $3,028 | $4,928 | $1,858 | $1,640 | $4,143 | $4,928 |
| Long-term Debt | $133 | $133 | $133 | $133 | $133 | $133 | $133 | $133 | $290 | $339 | $133 | $133 |
| Other Long-term Liabilities | $143 | $145 | $144 | $144 | $144 | $144 | $144 | $144 | $131 | $142 | $144 | $144 |
| Long-term Liabilities | $276 | $278 | $277 | $277 | $277 | $277 | $277 | $277 | $421 | $481 | $277 | $277 |
| Total Liabilities | $3,924 | $4,002 | $3,465 | $4,420 | $3,719 | $5,704 | $3,305 | $5,205 | $2,279 | $2,121 | $4,420 | $5,205 |
| Total Parent Shareholders' Equity | $6,825 | $8,217 | $8,203 | $9,157 | $10,085 | $11,584 | $11,039 | $12,091 | $6,517 | $7,299 | $9,157 | $12,091 |
| Minority Interest | $185 | $186 | $188 | $191 | $191 | $193 | $195 | $196 | $0 | $189 | $191 | $196 |
| Total Equity | $7,010 | $8,404 | $8,392 | $9,348 | $10,276 | $11,777 | $11,234 | $12,288 | $6,517 | $7,488 | $9,348 | $12,288 |
| Total Liabilities and Equity | $10,934 | $12,406 | $11,857 | $13,768 | $13,996 | $17,482 | $14,539 | $17,493 | $8,796 | $9,609 | $13,768 | $17,493 |
Source: BofA Global Research estimates, company data
BofA GLOBAL RESEARCH
Exhibit 51: Terms and definitions
Glossary for abbreviations/acronyms
| Term | Definition |
|---|---|
| ACF | Anisotropic Conductive Film |
| AI | Artificial Intelligence |
| AOI | Automated Optical Inspection |
| ASIC | Application-Specific Integrated Circuit |
| CoPoS | Chip-on-Panel-on-Substrate |
| CoWoS | Chip-on-Wafer-on-Substrate |
| CoWoS-L | Chip-on-Wafer-on-Substrate (Local Silicon Interconnect) |
| CoWoS-S | Chip-on-Wafer-on-Substrate (Silicon Interposer) |
| CPO | Co-Packaged Optics |
| CPU | Central Processing Unit |
| EMIB | Embedded Multi-die Interconnect Bridge |
| FAU | Fiber Array Unit |
| FoCoS | Fan-Out Chip-on-Substrate |
| FOPLP | Fan-Out Panel- Level Packaging |
| GPU | Graphics Processing Unit |
| HBM | High-Bandwidth Memory |
| IDM | Integrated Device Manufacturer |
| InFO | Integrated Fan-Out |
| IPD | Integrated Passive Device |
| LCD | Liquid Crystal Display |
| LED | Light-Emitting Diode |
| MLCC | Multilayer Ceramic Capacitor |
| OCA | Optically Clear Adhesive |
| OSAT | Outsourced Semiconductor Assembly and Test |
| PSA | Pressure-Sensitive Adhesive |
| SiP | System-in-Package |
| SoIC | System on Integrated Chips |
| SWIFT | Silicon Wafer Integrated Fan-Out Technology |
| TAM | Total Addressable Market |
| TIM | Thermal Interface Material |
| UV | Ultraviolet |
| WMCM | Wafer-Level Multi-Chip Module |
| WPM | Wafers Per Month |
Source: BofA Global Research
BofA GLOBAL RESEARCH
Price objective basis & risk
All Ring (XNQNF)
Our PO of NT$1,500 is based on 36x 2027 P/E, positioned at the upper half of its historical trading range of 8-41x. We believe P/E based valuation is appropriate given All Ring's robust top-line visibility, stable profitability profile, and structural earnings improvement on decent exposure to AI-driven advanced packaging upcycle. The valuation multiple is underpinned by
1) 34%/42% CAGR in sales and earnings over 2026-28E and 2) sustained ROE in the 3040% range
Downside risks are:
1) slowdown in advanced packaging capacity expansion and 2) mis-execution on equipment development