PDF 原檔:報告_ML_玉晶光3406_20260714_original.pdf
圖片清單(已驗證 2026-07-15)
| 檔名 | size | 分類 | 親眼所見內容 |
|---|---|---|---|
報告_ML_玉晶光3406_20260714_001.png |
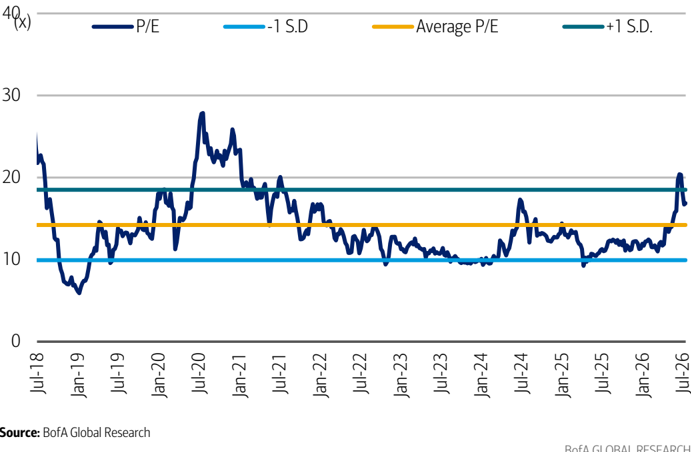
57KB | 真資料圖 | Exhibit 3:玉晶光 12 個月遠期本益比歷史走勢圖(2018/07–2026/07),標示 -1SD/平均/+1SD 三條水平線 |
報告_ML_玉晶光3406_20260714_002.png |
57KB | 真資料圖 | 玉晶光股價目標價(PO)沿革圖,標示歷次分析師調整目標價日期與金額(NT$275–540),2023/07–2026/03 |
分類只有三類:
真資料圖/裝飾·logo·banner/文字卡。<40KB 未 Read 者免列(預設 logo)。
原始內容
Genius Electronic Optical
Share gain could be capped by intensifying competition in high-end iPhone lens; U/P
Reiterate Rating: UNDERPERFORM | PO: 410.00 TWD | Price: 609.00 TWD
Reiterate Underperform on rising competition in high-end
We reiterate Underperform on Genius, given intensifying competition and thus potential slower share gains. Reported monthly sales during Apr-June reached NT$5.7bn, above our 2Q revenue estimates, supported by periscope share gains since 4Q25. We note that Apple remains a key driver for Genius, and we expect Genius to likely benefit from ASP expansion, owing to iPhone ' s multi-year spec upgrade cycle. However, looking into 202728, we expect competition in the high-end segment to intensify. We believe Largan will remain the leader in iPhone high-end lens, while Sunny Optical is finally making progress in the high-end as the company is expected to enter Apple ' s variable aperture main camera supply chain from 2H26. This could make Genius ' share gain into the high-end more difficult. Other than Apple, we note that the MR business (20% sales) remains challenging, given delays related to the Meta project.
Adjust earnings, PO to NT$410
We lift 2026-28E earnings by 11-14%, mainly reflecting better opex management and lower tax rate seen in the past 2-3 quarters. We raise our PO to NT$410 (12x 2H261H27E P/E) from NT$380 (12x 2026E P/E) after the valuation base rollover to 2H261H27E. We change our income rating to 7 (same/higher) from 8 (same/lower) to reflect higher dividend income in 2026E.
| Estimates (Dec) (NT$) | 2024A | 2025A | 2026E | 2027E | 2028E |
|---|---|---|---|---|---|
| Net Income (Adjusted - mn) | 4,323 | 3,702 | 4,110 | 4,111 | 3,987 |
| EPS | 38.3 | 32.8 | 36.5 | 36.5 | 35.4 |
| EPS Change (YoY) | 40.7% | -14.4% | 11.0% | 0% | -3.0% |
| Consensus EPS (Visible Alpha) | 32.09 | 32.95 | 31.93 | ||
| Dividend / Share | 18.0 | 15.4 | 17.1 | 17.1 | 16.6 |
| Free Cash Flow / Share | 82.1 | 50.6 | 44.9 | 40.0 | 39.9 |
| Valuation (Dec) | |||||
| P/E | 15.9x | 18.5x | 16.7x | 16.7x | 17.2x |
| Dividend Yield | 3.0% | 2.5% | 2.8% | 2.8% | 2.7% |
| EV / EBITDA* | 7.2x | 7.4x | 7.0x | 7.2x | 7.4x |
| Free Cash Flow Yield* | 13.5% | 8.3% | 7.4% | 6.6% | 6.6% |
| * For full definitions of iQ method SM measures, see page 7. |
This research report provides general information only. No part of this report may be used or reproduced or quoted in any manner whatsoever in Taiwan by the press or other persons without the express written consent of BofA Securities.
>> Employed by a non-US affiliate of BofAS and is not registered/qualified as a research analyst under the FINRA rules.
Refer to "Other Important Disclosures" for information on certain BofA Securities entities that take responsibility for the information herein in particular jurisdictions.
BofA Securities does and seeks to do business with issuers covered in its research reports. As a result, investors should be aware that the firm may have a conflict of interest that could affect the objectivity of this report. Investors should consider this report as only a single factor in making their investment decision.
Refer to important disclosures on page 8 to 10. Analyst Certification on page 5. Price
14 July 2026
Equity
| Key Changes (NT$) | Previous | Current |
|---|---|---|
| Inv. Opinion | B-3-8 | B-3-7 |
| Price Obj. | 380.00 | 410.00 |
| 2026E EPS | 32.09 | 36.45 |
| 2027E EPS | 32.95 | 36.47 |
| 2028E EPS | 31.93 | 35.37 |
| 2026E EBITDA (m) | 8,693.0 | 9,183.3 |
| 2027E EBITDA (m) | 8,669.7 | 9,025.9 |
| 2028E EBITDA (m) | 8,381.6 | 8,726.3 |
Robert Cheng >>
Research Analyst Merrill Lynch (Taiwan)
robert.cheng@bofa.com
Katherine Zhu >>
Research Analyst
Merrill Lynch (Hong Kong)
kexin.zhu@bofa.com
Doris Kao
>>
Research Analyst
Merrill Lynch (Taiwan)
doris.kao@bofa.com
Stock Data
| Price | 609.00 TWD |
|---|---|
| Price Objective | 410.00 TWD |
| Date Established | 14-Jul-2026 |
| Investment Opinion | B-3-7 |
| 52-Week Range | 386.00 TWD-796.00 |
| TWD | |
| Mrkt Val / Shares Out (mn) | 2,132 USD / 112.7 |
| Market Value (mn) | 68,661 TWD |
| Average Daily Value (mn) | 76.42 USD |
| Free Float | 76.7% |
| BofA Ticker / Exchange | GNSEF / TAI |
| Bloomberg / Reuters | 3406 TT / 3406.TW |
| ROE (2026E) | 14.9% |
| Net Dbt to Eqty (Dec-2025A) | -24.6% |
Acronym
ASP: average selling price
MR: mixed reality
iQ profile SM Genius Electronic Optical
| Key Income Statement Data (Dec) | 2024A | 2025A | 2026E | 2027E | 2028E |
|---|---|---|---|---|---|
| (NT$ Millions) | |||||
| Sales | 23,187 | 24,989 | 26,837 | 28,347 | 28,522 |
| Gross Profit | 8,057 | 8,125 | 9,049 | 9,425 | 9,512 |
| Sell General &Admin Expense | (1,337) | (1,263) | (1,421) | (1,608) | (1,685) |
| Operating Profit | 4,755 | 4,773 | 5,347 | 5,349 | 5,177 |
| Net Interest &Other Income | 1,169 | 217 | 342 | 340 | 340 |
| Associates | NA | NA | NA | NA | NA |
| Pretax Income | 5,925 | 4,990 | 5,689 | 5,689 | 5,517 |
| Tax (expense) / Benefit | (1,587) | (1,282) | (1,594) | (1,593) | (1,545) |
| Net Income (Adjusted) | 4,323 | 3,702 | 4,110 | 4,111 | 3,987 |
| Average Fully Diluted Shares Outstanding | 113 | 113 | 113 | 113 | 113 |
| Key Cash Flow Statement Data | |||||
| Net Income | 4,323 | 3,702 | 4,110 | 4,111 | 3,987 |
| Depreciation &Amortization | 4,187 | 4,009 | 3,836 | 3,677 | 3,549 |
| Change in Working Capital | 1,417 | (97) | 120 | (275) | (34) |
| Deferred Taxation Charge | NA | NA | NA | NA | NA |
| Other Adjustments, Net | 721 | (303) | 0 | 0 | 0 |
| Cash Flow from Operations | 10,649 | 7,312 | 8,065 | 7,513 | 7,503 |
| Capital Expenditure | (1,390) | (1,602) | (3,000) | (3,000) | (3,000) |
| (Acquisition) / Disposal of Investments | (510) | (1,481) | 0 | 0 | 0 |
| Other Cash Inflow / (Outflow) | (1,130) | 91 | 0 | 0 | 0 |
| Cash Flow from Investing | (3,030) | (2,992) | (3,000) | (3,000) | (3,000) |
| Shares Issue / (Repurchase) | 0 | 0 | 0 | 0 | 0 |
| Cost of Dividends Paid | (1,353) | (2,029) | (1,738) | (1,929) | (1,930) |
| Cash Flow from Financing | (5,376) | (4,816) | (1,738) | (1,929) | (1,930) |
| Free Cash Flow | 9,259 | 5,709 | 5,065 | 4,513 | 4,503 |
| Net Debt | (4,314) | (6,528) | (9,855) | (12,439) | (15,012) |
| Change in Net Debt | (3,511) | 384 | (3,327) | (2,584) | (2,573) |
| Key Balance Sheet Data | |||||
| Property, Plant &Equipment | 20,727 | 18,991 | 18,195 | 17,558 | 17,048 |
| Other Non-Current Assets | 3,522 | 3,271 | 3,232 | 3,192 | 3,153 |
| Trade Receivables | 3,981 | 5,640 | 5,882 | 6,213 | 6,251 |
| Cash &Equivalents | 11,173 | 10,795 | 14,122 | 16,706 | 19,279 |
| Other Current Assets | 3,632 | 4,943 | 5,752 | 5,938 | 5,953 |
| Total Assets | 43,035 | 43,641 | 47,183 | 49,608 | 51,684 |
| Long-Term Debt | 3,365 | 2,759 | 2,759 | 2,759 | 2,759 |
| Other Non-Current Liabilities | 6,030 | 5,752 | 5,752 | 5,752 | 5,752 |
| Short-Term Debt | 3,494 | 1,508 | 1,508 | 1,508 | 1,508 |
| Other Current Liabilities | 5,382 | 7,138 | 8,308 | 8,550 | 8,569 |
| Total Liabilities | 18,271 | 17,157 | 18,327 | 18,569 | 18,588 |
| Total Equity | 24,765 | 26,484 | 28,856 | 31,038 | 33,096 |
| Total Equity &Liabilities | 43,035 | 43,641 | 47,183 | 49,608 | 51,684 |
| iQ method SM - Bus Performance* | |||||
| Return On Capital Employed | 10.0% | 10.2% | 10.8% | 10.0% | 9.2% |
| Return On Equity | 18.9% | 14.4% | 14.9% | 13.7% | 12.4% |
| Operating Margin | 20.5% | 19.1% | 19.9% | 18.9% | 18.2% |
| EBITDA Margin | 38.6% | 35.1% | 34.2% | 31.8% | 30.6% |
| iQ method SM - Quality of Earnings* | |||||
| Cash Realization Ratio | 2.5x | 2.0x | 2.0x | 1.8x | 1.9x |
| Asset Replacement Ratio | 0.3x | 0.4x | 0.8x | 0.8x | 0.9x |
| Tax Rate (Reported) | 26.8% | 25.7% | 28.0% | 28.0% | 28.0% |
| Net Debt-to-Equity Ratio | -17.4% | -24.6% | -34.2% | -40.1% | -45.4% |
| Interest Cover | 26.4x | 39.1x | NM | NM | NM |
Key Metrics
- For full definitions of iQ method SM measures, see page 7.
Company Sector
Electronics
Company Description
Genius Electronic Optical was established in 1990 and listed in Taiwan Stock Exchange in 2005. The company is headquartered in Taichung, Taiwan, and is one of the major smartphone optical lens suppliers in Asia. Elsewhere, it is also involved in designing and manufacturing auto lens and light-emitting diode (LED) lighting products.
Investment Rationale
We have an Underperform rating on Genius, on slower share gain at iPhone high-end lens and likely rising pressure. For VR business, despite a recovery in 2024, we believe demand sustainability remains uncertain.
Stock Data
Price to Book Value
2.4x
Exhibit 1: We lift 2026-27E earnings by 10-14%
Earnings estimate change, 2026-28E
| (NT$mn) | BofA 2026E | BofA 2026E | BofA 2026E | BofA 2027E | BofA 2027E | BofA 2027E | BofA 2028E | BofA 2028E | BofA 2028E |
|---|---|---|---|---|---|---|---|---|---|
| New | Old | Diff (%) | New | Old | Diff (%) | New | Old | Diff (%) | |
| Total sales | 26,837 | 26,904 | -0.2 | 28,347 | 27,115 | 4.5 | 28,522 | 27,016 | 5.6 |
| Gross Profit | 9,049 | 8,743 | 3.5 | 9,425 | 9,003 | 4.7 | 9,512 | 8,963 | 6.1 |
| Gross margin | 33.7% | 32.5% | 1.2 | 33.2% | 33.2% | 0.0 | 33.4% | 33.2% | 0.2 |
| Operating income | 5,347 | 4,857 | 10.1 | 5,349 | 4,993 | 7.1 | 5,177 | 4,832 | 7.1 |
| Operating margin | 19.9% | 18.1% | 1.9 | 18.9% | 18.4% | 0.5 | 18.2% | 17.9% | 0.3 |
| Pretax income | 5,689 | 5,100 | 11.5 | 5,689 | 5,237 | 8.6 | 5,517 | 5,076 | 8.7 |
| Pretax margin | 21.2% | 19.0% | 2.2 | 20.1% | 19.3% | 0.8 | 19.3% | 18.8% | 0.6 |
| Net income | 4,110 | 3,618 | 13.6 | 4,111 | 3,714 | 10.7 | 3,987 | 3,600 | 10.8 |
| Net margin | 15.3% | 13.4% | 1.9 | 14.5% | 13.7% | 0.8 | 14.0% | 13.3% | 0.7 |
| EPS (NT$) | 36.5 | 32.1 | 13.6 | 36.5 | 32.9 | 10.7 | 35.4 | 31.9 | 10.8 |
Source: BofA Global Research estimates
Exhibit 2: Our 2026-28E earnings are 5-22% below consensus
BofAe vs. consensus, 2026-28E
| (NT$mn) | 2026E | 2026E | 2026E | 2027E | 2027E | 2027E | 2028E | 2028E | 2028E |
|---|---|---|---|---|---|---|---|---|---|
| BofAe | Consensus | Diff (%) | BofAe | Consensus | Diff (%) | BofAe | Consensus | Diff (%) | |
| Total sales | 26,837 | 26,844 | 0.0 | 28,347 | 28,607 | -0.9 | 28,522 | 29,729 | -4.1 |
| Gross profit | 9,049 | 9,082 | -0.4 | 9,425 | 9,636 | -2.2 | 9,512 | 10,334 | -8.0 |
| Gross margin | 33.7% | 33.8% | -0.1 | 33.2% | 33.7% | -0.4 | 33.4% | 34.8% | -1.4 |
| Operating profit | 5,347 | 5,345 | 0.0 | 5,349 | 5,850 | -8.6 | 5,177 | 6,143 | -15.7 |
| Operating margin | 19.9% | 19.9% | 0.0 | 18.9% | 20.5% | -1.6 | 18.2% | 20.7% | -2.5 |
| Pretax income | 5,689 | 5,786 | -1.7 | 5,689 | 6,354 | -10.5 | 5,517 | 6,839 | -19.3 |
| Pretax margin | 21.2% | 21.6% | -0.4 | 20.1% | 22.2% | -2.1 | 19.3% | 23.0% | -3.7 |
| Net income | 4,110 | 4,323 | -4.9 | 4,111 | 4,778 | -13.9 | 3,987 | 5,114 | -22.0 |
| Net margin | 15.3% | 16.1% | -0.8 | 14.5% | 16.7% | -2.2 | 14.0% | 17.2% | -3.2 |
| EPS (NT$) | 36.5 | 38.3 | -4.9 | 36.5 | 42.4 | -13.9 | 35.4 | 45.4 | -22.0 |
Source: BofA Global Research estimates, Bloomberg consensus
Exhibit 3: The stock trades at 17x forward P/E, above its historical average
Genius' 1-year forward P/E and -1/+1 standard deviation
Source: BofA Global Research
BofA GLOBAL RESEARCH
BofA GLOBAL RESEARCH
BofA GLOBAL RESEARCH
Exhibit 4: We expect -2% earnings CAGR during 2026-28E
Genius' quarterly income statement, 2025-28E
| NT$mn | 1Q25 | 2Q25 | 3Q25 | 4Q25 | 1Q26 | 2Q26E | 3Q26E | 4Q26E | 1Q27E | 2Q27E | 3Q27E | 4Q27E | 2025 | 2026E | 2027E | 2028E |
|---|---|---|---|---|---|---|---|---|---|---|---|---|---|---|---|---|
| Sales | 5,321 | 4,776 | 7,740 | 7,152 | 6,141 | 5,680 | 7,826 | 7,190 | 6,357 | 5,143 | 8,607 | 8,240 | 24,989 | 26,837 | 28,347 | 28,522 |
| COGS | 3,675 | 3,388 | 5,099 | 4,702 | 4,080 | 3,948 | 5,087 | 4,674 | 4,259 | 3,626 | 5,681 | 5,356 | 16,864 | 17,788 | 18,922 | 19,010 |
| Gross profit | 1,646 | 1,388 | 2,641 | 2,449 | 2,061 | 1,732 | 2,739 | 2,517 | 2,098 | 1,517 | 2,926 | 2,884 | 8,125 | 9,049 | 9,425 | 9,512 |
| Operating expenses | 749 | 792 | 827 | 983 | 860 | 937 | 869 | 1,035 | 947 | 988 | 947 | 1,195 | 3,352 | 3,702 | 4,076 | 4,335 |
| SG&A | 272 | 289 | 329 | 373 | 311 | 341 | 352 | 417 | 356 | 370 | 387 | 494 | 1,263 | 1,421 | 1,608 | 1,685 |
| R&D | 478 | 503 | 498 | 610 | 549 | 596 | 517 | 618 | 591 | 617 | 559 | 700 | 2,089 | 2,281 | 2,468 | 2,651 |
| Operating profit | 897 | 596 | 1,814 | 1,466 | 1,201 | 795 | 1,870 | 1,481 | 1,151 | 530 | 1,980 | 1,689 | 4,773 | 5,347 | 5,349 | 5,177 |
| Non-operating income | 267 | -304 | 119 | 135 | 39 | 133 | 85 | 85 | 86 | 85 | 85 | 85 | 217 | 342 | 340 | 340 |
| Pretax income | 1,164 | 292 | 1,933 | 1,602 | 1,239 | 928 | 1,955 | 1,566 | 1,236 | 614 | 2,065 | 1,774 | 4,990 | 5,689 | 5,689 | 5,517 |
| Net income | 872 | 240 | 1,414 | 1,176 | 891 | 668 | 1,408 | 1,143 | 890 | 442 | 1,487 | 1,292 | 3,702 | 4,110 | 4,111 | 3,987 |
| EPS (NT$) | 7.7 | 2.1 | 12.5 | 10.4 | 7.9 | 5.9 | 12.5 | 10.1 | 7.9 | 3.9 | 13.2 | 11.5 | 32.8 | 36.5 | 36.5 | 35.4 |
| Margin | ||||||||||||||||
| GPM (%) | 30.9% | 29.1% | 34.1% | 34.3% | 33.6% | 30.5% | 35.0% | 35.0% | 33.0% | 29.5% | 34.0% | 35.0% | 32.5% | 33.7% | 33.2% | 33.4% |
| Operating margin | 16.8% | 12.5% | 23.4% | 20.5% | 19.6% | 14.0% | 23.9% | 20.6% | 18.1% | 10.3% | 23.0% | 20.5% | 19.1% | 19.9% | 18.9% | 18.2% |
| Pretax margin | 21.9% | 6.1% | 25.0% | 22.4% | 20.2% | 16.3% | 25.0% | 21.8% | 19.4% | 11.9% | 24.0% | 21.5% | 20.0% | 21.2% | 20.1% | 19.3% |
| Net margin | 16.4% | 5.0% | 18.3% | 16.4% | 14.5% | 11.8% | 18.0% | 15.9% | 14.0% | 8.6% | 17.3% | 15.7% | 14.8% | 15.3% | 14.5% | 14.0% |
| QoQ growth | ||||||||||||||||
| Sales | -3% | -10% | 62% | -8% | -14% | -8% | 38% | -8% | -12% | -19% | 67% | -4% | ||||
| Gross profit | 11% | -16% | 90% | -7% | -16% | -16% | 58% | -8% | -17% | -28% | 93% | -1% | ||||
| Operating profit | 71% | -34% | NM | -19% | -18% | -34% | 135% | -21% | -22% | -54% | NM | -15% | ||||
| Pre-tax profit | 2% | -75% | NM | -17% | -23% | -25% | 111% | -20% | -21% | -50% | NM | -14% | ||||
| Net profit | 2% | -72% | NM | -17% | -24% | -25% | 111% | -19% | -22% | -50% | NM | -13% | ||||
| YoY growth | ||||||||||||||||
| Sales | 2% | -4% | 3% | 31% | 15% | 19% | 1% | 1% | 4% | -9% | 10% | 15% | 8% | 7% | 6% | 1% |
| Gross profit | -14% | -24% | -6% | 65% | 25% | 25% | 4% | 3% | 2% | -12% | 7% | 15% | 1% | 11% | 4% | 1% |
| Operating profit | -22% | -45% | -9% | 179% | 34% | 33% | 3% | 1% | -4% | -33% | 6% | 14% | 0% | 12% | 0% | -3% |
| Pre-tax profit | -23% | -79% | 2% | 41% | 7% | NM | 1% | -2% | 0% | -34% | 6% | 13% | -16% | 14% | 0% | -3% |
| Net profit | -20% | -76% | 3% | 37% | 2% | 178% | 0% | -3% | 0% | -34% | 6% | 13% | -14% | 11% | 0% | -3% |
Source:
Company data, BofA Global Research estimates
BofA GLOBAL RESEARCH
Price objective basis & risk
Genius Electronic Optical (GNSEF)
Our PO NT$410 is based on 12x 2H26-1H27E P/E, below Genius' past 5-year trading average. We believe 12x is justified by rising competition from peers like Largan/Sunny Optical, slower VR/AR sales and macro/tariff uncertainties.
Upside risks to our PO are
- 1) better-than-expected gross margin due to better yield/efficiency, especially for iPhone order
- 2) faster-than-expected ramp up of VR/AR-related products
- 3) stronger-than-expected end market demand for smartphone
- 4) eased competition from peers like Largan and Sunny Optical for iPhone
Downside risks to our PO are
- 1) slower learnings curve at iPhone pericope, hurting margin profile
- 2) slower-than-expected pull-in of VR/AR related products
- 3) slower-than-expected end market demand for smartphone
- 4) more intense competition from other optics players in Asia