PDF 原檔:報告_ML_台積電2330_20260713_original.pdf
圖片清單(已驗證 2026-07-15)
| 檔名 | size | 分類 | 親眼所見內容 |
|---|---|---|---|
報告_ML_台積電2330_20260713_001.png |
94KB | 真資料圖 | Exhibit 3:TSMC's wafer pricing(US$,12" equivalent)+ wafer pricing YoY,2015-2027E,先進節點 vs mature/specialty vs blended pricing |
報告_ML_台積電2330_20260713_002.png |
81KB | 真資料圖 | Exhibit 4:TSMC's wafer pricing 柱狀圖 + 先進節點對 mature node 溢價曲線,2015-2027E |
報告_ML_台積電2330_20260713_003.png |
34KB | 真資料圖 | Exhibit 6:Transistor density(MTr/mm²)比較柱狀圖,TSMC N3/N2P/A16/A12 vs Intel 3/18A/18A-P/14A |
報告_ML_台積電2330_20260713_004.png |
90KB | 真資料圖 | Exhibit 7:TSMC's capex(US$mn)柱狀圖 + wafer capacity growth/equipment capex per k WPM 折線,2010-2028 |
報告_ML_台積電2330_20260713_005.png |
123KB | 真資料圖 | Exhibit 8:TSMC's revenue & capex(US$mn)+ YoY/capital intensity 疊圖,2010-2028 |
報告_ML_台積電2330_20260713_006.png |
88KB | 真資料圖 | Exhibit 9:TSMC's capex breakdown(NT$mn)by technology(advanced/specialty/others)+ capex YoY,2010-2028 |
報告_ML_台積電2330_20260713_007.png |
85KB | 真資料圖 | Exhibit 10:TSMC's depreciation breakdown(NT$mn,office/buildings/equipment)+ YoY,2010-2028 |
報告_ML_台積電2330_20260713_008.png |
34KB | 真資料圖 | Exhibit 11:TSMC's year-end capacity by node(k WPM,mature/specialty vs advanced 7nm 以下)+ advanced node % of total capacity,2020-2028E |
報告_ML_台積電2330_20260713_009.png |
59KB | 真資料圖 | Exhibit 12:TSMC advanced node capacity(k WPM)柱狀圖 + advanced % of total capacity 折線,2020-2028E |
報告_ML_台積電2330_20260713_010.png |
75KB | 真資料圖 | Exhibit 13:TSMC 5nm and below wafer consumption/supply(k WPM)+ utilization,1Q22-3Q28 |
報告_ML_台積電2330_20260713_011.png |
83KB | 真資料圖 | Exhibit 15:Major advanced demand at TSMC(k WPY,依應用別堆疊:NB/PC CPU、Mobile SoC、AI accelerator 等)+ Server CPU YoY,2022-2028 |
報告_ML_台積電2330_20260713_012.png |
56KB | 真資料圖 | Exhibit 16:Major 5nm and below wafer demand mix at TSMC(% 堆疊圖,Server CPU/AI accelerator/Mobile SoC 等占比),2022-2028 |
報告_ML_台積電2330_20260713_013.png |
73KB | 真資料圖 | Exhibit 14:TSMC 3nm wafer consumption/supply(k WPM)+ utilization,3Q23-3Q28 |
報告_ML_台積電2330_20260713_014.png |
84KB | 真資料圖 | Exhibit 17:TSMC 3nm wafer consumption by customer(k WPM,Apple/Mediatek/Qualcomm/Nvidia/AMD/Broadcom 等堆疊),1Q23-4Q27 |
報告_ML_台積電2330_20260713_015.png |
72KB | 真資料圖 | Exhibit 18:Industry CoWoS-R/L wafer supply/demand(k WPQ)+ utilization,3Q24-4Q28 |
報告_ML_台積電2330_20260713_016.png |
97KB | 真資料圖 | Exhibit 19:Industry CoWoS demand(k WPY,依客戶別 Nvidia/AMD/Broadcom/Google/Amazon/Meta 等堆疊)+ demand YoY,2020-2028 |
報告_ML_台積電2330_20260713_017.png |
70KB | 真資料圖 | Exhibit 20:TSMC SoIC supply/demand(k WPQ ex-CPO)+ utilization,1Q23-4Q28 |
報告_ML_台積電2330_20260713_018.png |
57KB | 真資料圖 | Exhibit 21:TSMC's P/E valuation band(NT$ weekly closing price + 10x/12x/15x/20x/26x 倍數線),Jun16-Jun26 |
報告_ML_台積電2330_20260713_019.png |
58KB | 真資料圖 | Exhibit 22:TSMC's valuation based on BofA estimates,forward P/E 走勢 + Avg±1/2 std(Avg 16x,17x'27E 落於中段) |
報告_ML_台積電2330_20260713_020.png |
94KB | 真資料圖 | Exhibit 23:TSMC's P/E trend vs its customers(NTM forward P/E + customers' valuation premium vs TSMC,平均溢價 22%),Mar11-Mar25 |
報告_ML_台積電2330_20260713_021.png |
99KB | 真資料圖 | Exhibit 25:TSMC's consensus NTM EPS expectations + NTM P/E based on consensus(Avg 17x,AI 投資後均值 18x),Jan15-2026 |
報告_ML_台積電2330_20260713_022.png |
94KB | 真資料圖 | Exhibit 24:TSMC's P/E trend vs its HPC customers(平均溢價 52%,現階段偏高),Mar11-Mar25 |
報告_ML_台積電2330_20260713_023.png |
74KB | 真資料圖 | Exhibit 26:SOX Index 1-year forward P/E vs TSM ADR 1-yr forward P/E + SOX 溢價,Jan10-Jan26 |
報告_ML_台積電2330_20260713_024.png |
76KB | 真資料圖 | Exhibit 27:TSMC common vs ADR conversion price(NT$)+ ADR premium(平均 8%),Jan02-Jan26 |
報告_ML_台積電2330_20260713_025.png |
87KB | 真資料圖 | TSMWF(普通股)Price Objective 沿革圖:折線股價 + PO 區間帶,標註歷次分析師調整日期與新 PO(2023-07-12 NT$670 → 2026-06-24 NT$3,060) |
報告_ML_台積電2330_20260713_026.png |
85KB | 真資料圖 | TSM(ADR)Price Objective 沿革圖:折線股價 + PO 區間帶,標註歷次分析師調整日期與新 PO(2023-07-12 US$115 → 2026-06-24 US$590) |
原始內容
Taiwan Semiconductor Manufacturing Co.
2Q26 earnings preview: Robust demand and pricing underpin capex expansion
Reiterate Rating: BUY | PO: 3,100 TWD | Price: 2,415 TWD
Solid 2Q26/3Q26 demand; GM resilient through 2nm ramp
We expect TSMC ' s 2Q26 sales tracking to +12% QoQ and could grow 10-15% QoQ in 3Q26, on HPC product refreshes and benefit from price hike in early ' 26. With favorable FX, utilization and pricing partially offset by dilution from 2nm ramp skewed to 2H26 and higher summer electricity cost, its GMs could stay stable at ~67-68% in 3Q26 (vs street/buyside 68-70% expectations). VIS disposal gain could lift NT$1.95 EPS in 2Q26.
Stronger project visibility into 2027 drives capex upside
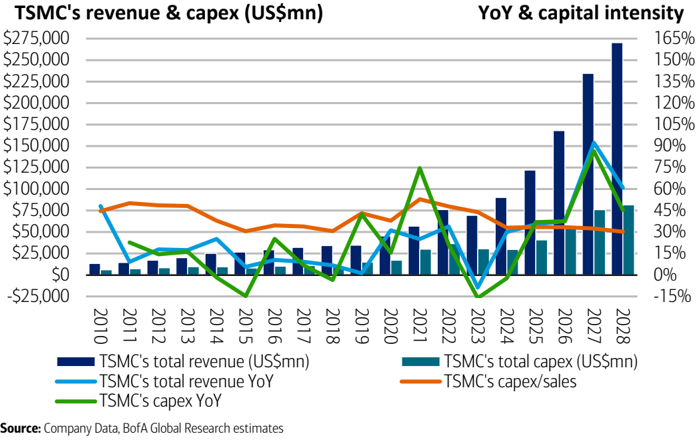
We expect TSMC ' s sales to grow by 39% YoY in US$ in ' 26 backed by the ramp for new gen GPUs and ASICs, stronger CPUs, Apple ' s product launches and now supplemented by firmer pricing outlook on mature nodes. On solid demand pipeline and tight equipment supply, we expect its capex to reach US$58bn in ' 26 (vs. US$56bn guide) and further grow to US$78bn/US$83bn in ' 27/28 for further clean room and capacity expansion.
Checkpoints: AI demand sustainability and competition
Amid hyperscalers ' need of fund raising for further spend on the AI infrastructure in a component cost inflation environment, TSMC ' s comment on AI investment sustainability and its capex commitment in the next few years could be a bellwether. Structurally, we would focus on its capacity expansion strategy balancing fulfilling customers ' demand due to back-end competition from Intel vs. the business cyclicality in the downturns.
Mid-cycle valuation compelling as EPS upgrades continue
We lift our 26/27/28E EPS from NT$103/NT$150/NT$177 to NT$107/NT$153/NT$178. We keep our Buy rating on TSMC and raise PO to NT$3,100 on 20x ' 27 P/E. While recent street could be aggressive on 2H26 GMs, we believe its current valuation is undemanding at 16x ' 27 P/E (vs. its long term 11-21x) backed by its dominant position in advanced technologies.
| Estimates (Dec) (NT$) | 2024A | 2025A | 2026E | 2027E | 2028E |
|---|---|---|---|---|---|
| Net Income (Adjusted - mn) | 1,173,268 | 1,717,886 | 2,769,055 | 3,967,763 | 4,619,453 |
| EPS | 45.24 | 66.24 | 106.78 | 153.00 | 178.13 |
| EPS Change (YoY) | 39.9% | 46.4% | 61.2% | 43.3% | 16.4% |
| Consensus EPS (Visible Alpha) | 95.21 | 127.32 | 159.20 | ||
| Dividend / Share | 18.00 | 24.00 | 24.00 | 24.00 | 24.00 |
| Free Cash Flow / Share | 33.55 | 38.66 | 69.89 | 92.94 | 120.88 |
| ADR EPS (US$) | 7.04 | 10.62 | 16.58 | 23.75 | 27.66 |
| ADR Dividend / Share (US$) | 2.80 | 3.85 | 3.73 | 3.73 | 3.73 |
| Valuation (Dec) | |||||
| P/E | 53.38x | 36.46x | 22.62x | 15.78x | 13.56x |
| Dividend Yield | 0.745% | 0.994% | 0.994% | 0.994% | 0.994% |
| EV / EBITDA* | 29.97x | 22.67x | 14.91x | 10.51x | 9.16x |
| Free Cash Flow Yield* | 1.39% | 1.60% | 2.89% | 3.85% | 5.01% |
| * For full definitions of iQ method SM measures, see page 19. |
This research report provides general information only. No part of this report may be used or reproduced or quoted in any manner whatsoever in Taiwan by the press or other persons without the express written consent of BofA Securities.
>> Employed by a non-US affiliate of BofAS and is not registered/qualified as a research analyst under the FINRA rules.
Refer to "Other Important Disclosures" for information on certain BofA Securities entities that take responsibility for the information herein in particular jurisdictions.
BofA Securities does and seeks to do business with issuers covered in its research reports. As a result, investors should be aware that the firm may have a conflict of interest that could affect the objectivity of this report. Investors should consider this report as only a single factor in making their investment decision.
Refer to important disclosures on page 20 to 23. Analyst Certification on page 17. Price
13 July 2026
Equity
| Key Changes (NT$) | Previous | Current |
|---|---|---|
| Price Obj. | 3,060.00 | 3,100.00 |
| 2026E EPS | 102.55 | 106.78 |
| 2027E EPS | 150.06 | 153.00 |
| 2028E EPS | 176.81 | 178.13 |
| 2026E EBITDA (m) | 3,915,419.5 | 3,989,367.9 |
| 2027E EBITDA (m) | 5,556,714.1 | 5,662,101.1 |
| 2028E EBITDA (m) | 6,431,146.3 | 6,495,806.6 |
Haas Liu >> Research Analyst Merrill Lynch (Taiwan) +886 2 2376 3727 haas.liu@bofa.com
Mike Yang >> Research Analyst Merrill Lynch (Taiwan) +886 2 2376 3729 mike.c.yang@bofa.com
Robert Cheng >> Research Analyst Merrill Lynch (Taiwan) +886 2 2376 3731 robert.cheng@bofa.com
Cathy Hsu >> Research Analyst Merrill Lynch (Taiwan) +886 2 2376 3726 cathy.hsu3@bofa.com
| Stock Data | |
|---|---|
| Price (Common / ADR) | 2,415TWD/434.11USD |
| Price Objective | 3,100TWD/590.00USD |
| Date Established | 13-Jul-2026/24-Jun-2026 |
| Investment Opinion | B-1-7 / B-1-7 |
| 52-WeekRange | 1,085TWD-2,535TWD |
| Market Value (mn) | 1,944,596 USD |
| Market Value (mn) | 62,626,674 TWD |
| Shares Outstanding (mn) | 25,932.4 / 5,186.5 |
| Average Daily Value (mn) | 3,179 USD |
| Free Float | 92.1% |
| BofA Ticker / Exchange | TSMWF/ TAI |
| BofA Ticker / Exchange | TSM / NYS |
| Bloomberg / Reuters | 2330 TT / 2330.TW |
| ROE (2026E) | 42.1% |
| Net Dbt to Eqty (Dec-2025A) | -37.3% |
See Exhibit 31 for glossary
iQ profile SM Taiwan Semiconductor Manufacturing Co.
| Key Income Statement Data (Dec) | 2024A | 2025A | 2026E | 2027E | 2028E |
|---|---|---|---|---|---|
| (NT$ Millions) | |||||
| Sales | 2,894,308 | 3,809,054 | 5,361,248 | 7,537,870 | 8,811,967 |
| Gross Profit | 1,624,354 | 2,281,294 | 3,611,271 | 5,191,707 | 5,973,990 |
| Sell General &Admin Expense | (96,888) | (99,222) | (125,130) | (157,121) | (177,284) |
| Operating Profit | 1,322,053 | 1,936,092 | 3,164,820 | 4,629,010 | 5,339,083 |
| Net Interest &Other Income | 83,786 | 105,574 | 193,753 | 179,437 | 259,769 |
| Associates | NA | NA | NA | NA | NA |
| Pretax Income | 1,405,839 | 2,041,666 | 3,358,573 | 4,808,447 | 5,598,852 |
| Tax (expense) / Benefit | (233,407) | (326,266) | (590,761) | (843,511) | (982,690) |
| Net Income (Adjusted) | 1,173,268 | 1,717,886 | 2,769,055 | 3,967,763 | 4,619,453 |
| Average Fully Diluted Shares Outstanding | 25,932 | 25,933 | 25,933 | 25,933 | 25,933 |
| Key Cash Flow Statement Data | |||||
| Net Income | 1,173,268 | 1,717,886 | 2,769,055 | 3,967,763 | 4,619,453 |
| Depreciation &Amortization | 662,797 | 688,096 | 824,548 | 1,033,091 | 1,156,724 |
| Change in Working Capital | (143,010) | (72,100) | (59,953) | (154,359) | (70,063) |
| Deferred Taxation Charge | NA | NA | NA | NA | NA |
| Other Adjustments, Net | 133,123 | (58,907) | 125,266 | 59,461 | 73,313 |
| Cash Flow from Operations | 1,826,177 | 2,274,976 | 3,658,916 | 4,905,957 | 5,779,427 |
| Capital Expenditure | (956,007) | (1,272,411) | (1,846,462) | (2,495,826) | (2,644,790) |
| (Acquisition) / Disposal of Investments | (58,000) | (37,014) | (14,597) | (1,618) | (101) |
| Other Cash Inflow / (Outflow) | 149,164 | 165,031 | 40,141 | 3,074 | 3,595 |
| Cash Flow from Investing | (864,843) | (1,144,393) | (1,820,917) | (2,494,370) | (2,641,296) |
| Shares Issue / (Repurchase) | (9) | (2) | (2) | 0 | 0 |
| Cost of Dividends Paid | (337,129) | (440,855) | (596,447) | (622,381) | (622,381) |
| Cash Flow from Financing | (346,301) | (440,345) | (609,851) | (624,652) | (623,019) |
| Free Cash Flow | 870,171 | 1,002,565 | 1,812,454 | 2,410,131 | 3,134,637 |
| Net Debt | (1,403,733) | (2,035,607) | (3,337,723) | (5,128,773) | (7,644,639) |
| Change in Net Debt | (556,872) | (647,079) | (1,236,900) | (1,789,206) | (2,515,751) |
| Key Balance Sheet Data | |||||
| Property, Plant &Equipment | 3,234,980 | 3,691,841 | 4,894,701 | 6,431,920 | 7,838,117 |
| Other Non-Current Assets | 368,606 | 424,052 | 429,115 | 429,453 | 429,429 |
| Trade Receivables | 272,088 | 281,791 | 329,503 | 416,202 | 439,725 |
| Cash &Equivalents | 2,422,020 | 3,068,595 | 4,371,827 | 6,160,606 | 8,675,833 |
| Other Current Assets | 394,245 | 466,745 | 493,099 | 594,904 | 674,530 |
| Total Assets | 6,691,938 | 7,933,024 | 10,518,245 | 14,033,084 | 18,057,635 |
| Long-Term Debt | 958,429 | 896,062 | 901,506 | 902,547 | 902,764 |
| Other Non-Current Liabilities | 145,408 | 118,147 | 153,342 | 176,339 | 198,762 |
| Short-Term Debt | 59,858 | 136,926 | 132,598 | 129,286 | 128,430 |
| Other Current Liabilities | 1,204,667 | 1,321,094 | 1,556,599 | 1,605,325 | 1,653,139 |
| Total Liabilities | 2,368,362 | 2,472,229 | 2,744,045 | 2,813,496 | 2,883,095 |
| Total Equity | 4,323,576 | 5,460,795 | 7,774,200 | 11,219,588 | 15,174,540 |
| Total Equity &Liabilities | 6,691,938 | 7,933,024 | 10,518,245 | 14,033,084 | 18,057,635 |
| iQ method SM - Bus Performance* | |||||
| Return On Capital Employed | 23.2% | 28.4% | 34.9% | 37.1% | 32.1% |
| Return On Equity | 30.3% | 35.4% | 42.1% | 42.0% | 35.1% |
| Operating Margin | 45.7% | 50.8% | 59.0% | 61.4% | 60.6% |
| EBITDA Margin | 68.6% | 68.9% | 74.4% | 75.1% | 73.7% |
| iQ method SM - Quality of Earnings* | |||||
| Cash Realization Ratio | 1.6x | 1.3x | 1.3x | 1.2x | 1.3x |
| Asset Replacement Ratio | 1.4x | 1.8x | 2.2x | 2.4x | 2.3x |
| Tax Rate (Reported) | 16.6% | 16.0% | 17.6% | 17.5% | 17.6% |
| Net Debt-to-Equity Ratio | -32.5% | -37.3% | -42.9% | -45.7% | -50.4% |
| Interest Cover | NM | NM | NM | NM | NM |
Key Metrics
- For full definitions of iQ method SM measures, see page 19.
Company Sector
Semiconductors
Company Description
TSMC was founded in 1987 and is listed in Taiwan (2330TT) and the US (TSM/NYS).TSMC is the largest and global leader in integrated circuit (IC) manufacturing. As a build-to-order foundry, it provides a wide range of valueadd activities: IC manufacturing, mask-making, IC design services, turnkey solutions, and process development. We attribute its success to its proven, winning business model, unparalleled scale advantage, optimized execution, and technology scope and depth. 5 shares = 1 ADR.
Investment Rationale
The ongoing semi content growth in mobile, rise of artificial intelligence (AI), and proliferation of Internet of Things (IoT) should result in sustainable upside in aggregate computing power globally. TSMC, as the leading contract manufacturer of semiconductor chips, is in a good position to capitalize. We are structurally positive on TSMC and expect it to sustain over 15% growth with rising FCF from 2026 onwards.
| Stock Data | |
|---|---|
| Shares / ADR | 5.00 |
| Price to Book Value | 8.1x |
| Key Changes (US$) | Previous | Current |
|---|---|---|
| 2026E EPS | 15.92 | 16.58 |
| 2027E EPS | 23.3 | 23.75 |
| 2028E EPS | 27.45 | 27.66 |
2Q26 sales/GMs tracking to top its guide; Vanguard disposal gains another EPS lift
We profile our expectations for TSMC ' s 2Q26 earnings on July 16 th . 2Q26 sales are on track to +12% QoQ, at the high-end of its guidance, which we believe is led by continued HPC/AI build strength especially with multiple product upgrades from 5nm/4nm to 3nm and inventory pre-builds on 2nm. Notably, the advanced node supply tightness should be backed by the drivers including 1) accelerators (GPUs and ASICs): NVidia ' s surging demand for Rubin GPU and Blackwell staying high along with AMD ' s MI400 and AWS ' s Trainium3 ramp more than offsetting Google ' s Ironwood TPU mild winddown, 2) CPUs: solid demand for general purpose servers and AI data centers across x86 (AMD ' s Turin and Venice CPUs) and ARM based CPUs (e.g. Nvidia ' s Vera CPU and Google ' s Axion CPU) and 3) networking switch : from Nvidia/Mellanox, Broadcom and Marvell.
On top of the solid advanced node demand and resilient orders from consumer applications ex-smartphones, we see the above seasonal 2Q26 sales also backed by more favorable pricing on better mix and modest benefit from the price hike in the beginning of the year. With sales tracking to the top end of its guidance, we expect its 2Q26 GMs to also reach the high-end its guidance for 65.5-67.5% (BofAe 67.7%).
Exhibit 1: TSMC 2Q26-3Q26 and 2026-27 estimates BofAe vs. street
We lift our EPS estimates for '26/27 to NT$107/153
| 2Q26E | 2Q26E | 2Q26E | 3Q26E | 3Q26E | 3Q26E | 2026E | 2026E | 2026E | 2027E | 2027E | 2027E | |
|---|---|---|---|---|---|---|---|---|---|---|---|---|
| BofAe | Old | Street | BofAe | Old | Street | BofAe | Old | Street | BofAe | Old | Street | |
| Sales (NT$mn) Sales QoQ / YoY (%) | $1,274,425 $1,273,016 $1,264,538 $1,418,786 $1,403,357 $1,375,834 $5,361,248 $5,331,236 $5,207,731 $7,537,870 $7,418,637 $6,694,347 12.4% | $1,274,425 $1,273,016 $1,264,538 $1,418,786 $1,403,357 $1,375,834 $5,361,248 $5,331,236 $5,207,731 $7,537,870 $7,418,637 $6,694,347 12.4% | $1,274,425 $1,273,016 $1,264,538 $1,418,786 $1,403,357 $1,375,834 $5,361,248 $5,331,236 $5,207,731 $7,537,870 $7,418,637 $6,694,347 12.4% | $1,274,425 $1,273,016 $1,264,538 $1,418,786 $1,403,357 $1,375,834 $5,361,248 $5,331,236 $5,207,731 $7,537,870 $7,418,637 $6,694,347 12.4% | $1,274,425 $1,273,016 $1,264,538 $1,418,786 $1,403,357 $1,375,834 $5,361,248 $5,331,236 $5,207,731 $7,537,870 $7,418,637 $6,694,347 12.4% | $1,274,425 $1,273,016 $1,264,538 $1,418,786 $1,403,357 $1,375,834 $5,361,248 $5,331,236 $5,207,731 $7,537,870 $7,418,637 $6,694,347 12.4% | $1,274,425 $1,273,016 $1,264,538 $1,418,786 $1,403,357 $1,375,834 $5,361,248 $5,331,236 $5,207,731 $7,537,870 $7,418,637 $6,694,347 12.4% | $1,274,425 $1,273,016 $1,264,538 $1,418,786 $1,403,357 $1,375,834 $5,361,248 $5,331,236 $5,207,731 $7,537,870 $7,418,637 $6,694,347 12.4% | $1,274,425 $1,273,016 $1,264,538 $1,418,786 $1,403,357 $1,375,834 $5,361,248 $5,331,236 $5,207,731 $7,537,870 $7,418,637 $6,694,347 12.4% | $1,274,425 $1,273,016 $1,264,538 $1,418,786 $1,403,357 $1,375,834 $5,361,248 $5,331,236 $5,207,731 $7,537,870 $7,418,637 $6,694,347 12.4% | $1,274,425 $1,273,016 $1,264,538 $1,418,786 $1,403,357 $1,375,834 $5,361,248 $5,331,236 $5,207,731 $7,537,870 $7,418,637 $6,694,347 12.4% | $1,274,425 $1,273,016 $1,264,538 $1,418,786 $1,403,357 $1,375,834 $5,361,248 $5,331,236 $5,207,731 $7,537,870 $7,418,637 $6,694,347 12.4% |
| Gross profit (NT$mn) GMs (%) | $863,158 67.7% | 12.2% $852,138 66.9% | 11.5% $846,140 66.9% | 11.3% $962,286 67.8% | 10.2% $929,297 66.2% | 8.8% $902,134 65.6% | 40.8% $3,611,271 67.4% | 40.0% $3,534,378 66.3% | 36.7% $3,429,760 65.9% | 40.6% $5,191,707 68.9% | 39.2% $5,090,004 68.6% | 28.5% $4,376,764 65.4% |
| Operating profit (NT$mn) OpMs (%) | $752,231 59.0% | $741,212 58.2% | $740,699 58.6% | $842,485 59.4% | $812,824 57.9% | $786,801 57.2% | $3,164,820 59.0% | $3,094,449 58.0% | $2,993,904 57.5% | $4,629,010 61.4% | $4,537,873 61.2% | $3,834,012 57.3% |
| Pretax profit (NT$mn) Pretax margins (%) | $846,056 66.4% | $771,834 60.6% | $766,018 60.6% | $876,903 61.8% | $846,815 60.3% | $815,482 59.3% | $3,358,573 62.6% | $3,224,053 60.5% | $3,106,700 59.7% | $4,808,447 63.8% | $4,715,574 63.6% | $3,967,679 59.3% |
| Tax expense (NT$mn) Tax rate (%) | -$168,729 19.9% | -$153,927 19.9% | -$146,921 19.2% $619,096 | -$146,799 16.7% | -$141,763 16.7% | -$135,907 16.7% $679,575 49.4% | -$589,518 17.6% $2,769,055 51.6% | -$564,622 17.5% $2,659,432 | -$544,233 17.5% $2,562,467 49.2% | -$840,684 17.5% $3,967,763 52.6% | -$824,129 17.5% $3,891,445 52.5% | -$686,682 17.3% $3,280,998 |
| Net profit (NT$mn) Net margins (%) | $677,327 53.1% | $617,908 48.5% | 49.0% | $730,103 51.5% | $705,053 50.2% | 49.9% | 49.0% $126.15 | |||||
| EPS (NT$) | $26.12 | $23.83 | $23.91 | $28.15 | $27.19 | $26.25 | $106.78 | $102.55 | $99.20 | $153.00 | $150.06 |
Source: BofA Global Research estimates, Bloomberg
HPC/Apple lifting 3Q26 sales outlook; resilient GM expectation but below street
For 3Q26, we expect TSMC ' s sales to grow in line with seasonality for +11-15% QoQ (BofAe +11%) even off a high base through 1H26. We model a mild growth in its wafer shipment (BofAe +10%/-18% QoQ for advanced/mature nodes), balancing HPC demand strength and Apple ' s chipset builds for its new product launches and its gradual retirement of 6 ' and 8 ' capacity and effective capacity loss due to equipment movement for the node conversion. The blended ASPs strength (BofAe +9% QoQ) should be the key driver for 3Q26 as shipment mix continues to shift toward advanced nodes and more meaningful benefit from the like-for-like price hike effective from the beginning of 2026 considering 5-6+ months production lead time.
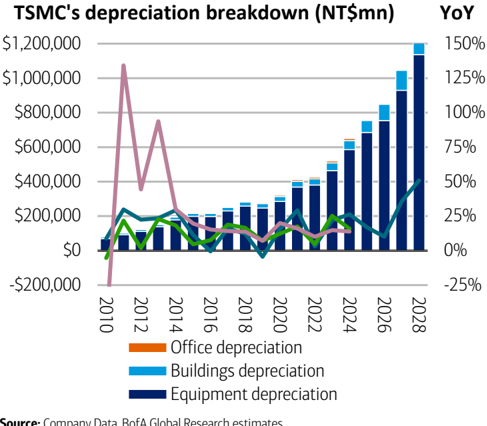
While utilization is trending higher, FX is modestly positive, and pricing environment is turning even more favorable with mature node capacity seeing potential cost inflation, supplemented by the already rising price on the advanced nodes, we model a relatively stable GMs only up 10bps QoQ to 67.8% in 3Q26 (vs. recent street and investors ' expectations at 68-70%). The key factors we consider as mildly negative offset would be 1) higher depreciation: +30-35% HoH in 2H26 due to more overseas and 2nm capacity
BofA GLOBAL RESEARCH
ramp and 2) growing contribution from 2nm still going through yield learning curve. Specifically, the management guided 2-3% margins dilution from 2nm ramp for 2026 and the impact could be concentrated in 2H26 as the volume grows. That said, TSMC ' s GMs in 2H26 could have reached low-70% levels without 2nm ramp, an encouraging milestone reflecting the company ' s structurally higher value to its customers through its strong technology leadership.
Exhibit 2: Our 2026-28E earnings are 8-21% above consensus as we model a higher sales growth and margins
TSMC 2026-28 estimates BofAe vs. Street
| 2026E | 2026E | 2026E | 2027E | 2027E | 2027E | 2027E | 2028E | 2028E | 2028E | 2028E | |
|---|---|---|---|---|---|---|---|---|---|---|---|
| BofAe | Old | Street | vs. street | BofAe | Old | Street | vs. street | BofAe Old | Street | vs. street | |
| Sales (NT$mn) | $5,361,248 $5,331,236 $5,207,731 | $5,361,248 $5,331,236 $5,207,731 | $5,361,248 $5,331,236 $5,207,731 | 3% | $7,537,870 | $7,418,637 | $6,694,347 | 13% | $8,811,967 $8,710,259 | $8,249,461 | 7% |
| Sales QoQ / YoY (%) | 40.8% | 40.0% | 36.7% | 40.6% | 39.2% | 28.5% | 16.9% 17.4% | 23.2% | |||
| Gross profit (NT$mn) | $3,611,271 | $3,534,378 | $3,429,760 | 5% | $5,191,707 | $5,090,004 | $4,376,764 | 19% | $5,973,990 $5,918,900 | $5,378,566 | 11% |
| GMs (%) | 67.4% | 66.3% | 65.9% | 1% | 68.9% | 68.6% | 65.4% | 3% | 67.8% 68.0% | 65.2% | 3% |
| Operating profit (NT$mn) | $3,164,820 | $3,094,449 | $2,993,904 | 6% | $4,629,010 | $4,537,873 | $3,834,012 | 21% | $5,339,083 $5,298,995 | $4,727,071 | 13% |
| OpMs (%) | 59.0% | 58.0% | 57.5% | 2% | 61.4% | 61.2% | 57.3% | 4% | 60.6% 60.8% | 57.3% | 3% |
| Pretax profit (NT$mn) | $3,358,573 | $3,224,053 | $3,106,700 | 8% | $4,808,447 | $4,715,574 | $3,967,679 | 21% | $5,598,852 $5,557,209 | $4,921,126 | 14% |
| Pretax margins (%) | 62.6% | 60.5% | 59.7% | 3% | 63.8% | 63.6% | 59.3% | 5% | 63.5% 63.8% | 59.7% | 4% |
| Tax expense (NT$mn) | -$589,518 | -$564,622 | -$544,233 | 8% | -$840,684 | -$824,129 | -$686,682 | 22% | -$979,399 -$971,979 | -$854,040 | 15% |
| Tax rate (%) | 17.6% | 17.5% | 17.5% | 0% | 17.5% | 17.5% | 17.3% | 0% | 17.5% 17.5% | 17.4% | 0% |
| Net profit (NT$mn) | $2,769,055 $2,659,432 $2,562,467 | $2,769,055 $2,659,432 $2,562,467 | $2,769,055 $2,659,432 $2,562,467 | 8% | $3,967,763 | $3,891,445 | $3,280,998 | 21% | $4,619,453 $4,585,230 | $4,067,086 | 14% |
| Net margins (%) | 51.6% | 49.9% | 49.2% | 2% | 52.6% | 52.5% | 49.0% | 4% | 52.4% 52.6% | 49.3% | 3% |
| EPS (NT$) | $106.78 | $102.55 | $99.20 | 8% | $153.00 | $150.06 | $126.15 | 21% | $178.13 $176.81 | $155.72 | 14% |
Source: BofA Global Research estimates, Bloomberg
2026 sales and margins outlook intact despite weakening consumer demand
Factoring in stronger CPU and AI GPU/ASIC demand outlook, we are lifting our sales expectation for TSMC in ' 26/ ' 27 to +41%/+40% YoY respectively (vs. BofA prior +40%/+39% YoY). More importantly, with utilization staying tighter for longer along with inflationary cost pass through, TSMC should raise its advanced node and packaging pricing by another 5-10% in the beginning of 2027, lifting its GMs to 67%/69% in 2026/27 (vs. BofA prior 66%/68%).
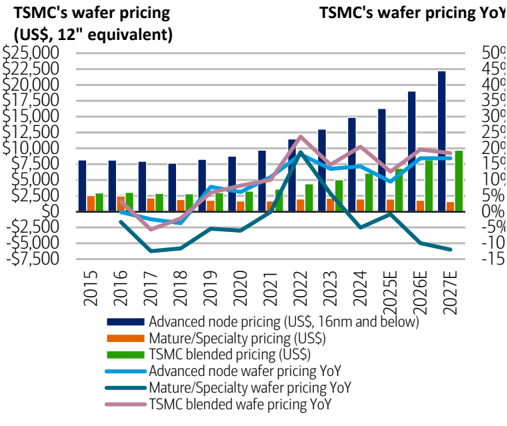
Exhibit 3: TSMC's wafer pricing by advanced vs. mature nodes TSMC's wafer pricing by advanced vs. mature nodes
Source: BofA Global Research estimates
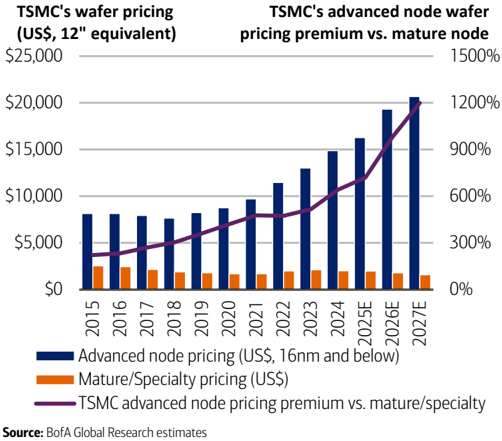
Exhibit 4: TSMC's wafer pricing gap for advanced vs. mature nodes TSMC's advanced node pricing is now 9x higher than mature ones
Source: BofA Global Research estimates
BofA GLOBAL RESEARCH
50%
40%
45%
35%
25%
30%
20%
10%
15%
BofA GLOBAL RESEARCH
BofA GLOBAL RESEARCH
Importantly, we believe the company ' s front-end manufacturing sales growth this year will be largely driven by the blended price hike (BofAe +31% YoY), factoring in 1) 1015% like-for-like price uplift on 5nm and 3nm, 2) the ramp of 2nm through the year, 3) 5-10% like-for-like pricing decline on the mature nodes. In addition, the wafer shipment mix skewed toward advanced nodes plays an important role, with TSMC ' s advanced wafer pricing is now 12x higher than the ones on the mature nodes, accelerating the blended price improvement in the past couple of years.
The wafer shipment will grow mildly YoY in 2026, with advanced node demand mostly offset by the decline in the mature nodes (BofAe -8% YoY shipment) due to its capacity retirement on 6 ' and 8 ' processes. The consumer chipset order cut from March could also affect the wafer output in 2H26, offsetting the fully loaded advanced nodes (BofAe +23% YoY shipment) led by high performance computing applications and high-end mobile chipsets.
Although N2 is the 1 st node using nanosheet technology, it has reached the targeted defect density levels 2 quarters ahead of 3nm. While it still takes a few years for N2 to reach corporate GMs which is trending higher (vs. ~11 quarters for N3), we expect N2/A16 to enjoy a better margin profile vs. 3nm on better yield curve.
Solid technology roadmap and execution easing competition concern
TSMC is pursuing a dual track strategy for its front-end manufacturing, advancing the solution for both its consumer and HPC customers. The nodes targeted for consumer chipsets requiring cost power efficiency and IP reuse will be introduced on an annual basis to match its customers ' yearly product launch schedule. For the HPC applications, the company targets to roll out a new node with biennial cadence, supporting major leaps in performance, transistor density and power density.
Exhibit 5: TSMC/ Intel/Samsung's technology roadmap
TSMC targets to roll out a new node for HPC with biennial cadence, supporting major leaps in performance
| Company | End Market / Segment | 2023 | 2024 | 2025 | 2026 | 2027 | 2028 | 2029 |
|---|---|---|---|---|---|---|---|---|
| TSMC | Data Center | N4P & N4X | N3X & N2 | N2P & A16 | N2X | A12 | ||
| TSMC | High-end consumer/mobile | N3 | N3E | N3P & N2 | N2P | N2U & A14 | A13 | |
| TSMC | Automotive | N5A | N3A | |||||
| TSMC | Mainstream | N4P | N4C | N3C | N2U | |||
| Intel Foundry | Data center and high-end client | 3 | 3 | 3 & 18A | 18A-P | 14A & 14A-E | ||
| Intel Foundry | Mature | 16 | 16-E | Intel/UMC 12 | ||||
| Samsung Foundry | Data Center | SF4P | SF4X | SF2X | SF2Z | |||
| Samsung Foundry | High-end consumer/mobile | SF4P | SF3 | SF2 | SF2P | SF2P+ | SF1.4 | |
| Samsung Foundry | Automotive | SF5A | SF4A | SF2A | ||||
| Samsung Foundry | Mainstream | SF4U |
Source: BofA Global Research
This is evidenced in its N2 family and below nodes, with N2U ramping in ' 28 for mobile applications and A13 node in ' 29 which will be backward compatible to A14. It will also have A12 node in ' 29 integrated SPR to address power integrity and current delivery constraint suitable for AI/HPC systems. The strategy along with the continued expansion of the derivative offerings for main nodes should position TSMC well to defend its market share with its competitors claiming their progress on the advanced manufacturing.
Specifically, Intel ' s 18A has been in mass production since 4Q25 for its Panther Lake and Clearwater Forest chipsets though yield will not be fully fine tuned until 1Q27 at 2530k WPM capacity scale in its Oregon and Arizona fabs. The follow on derivative technology, 18A-P, has recently started risk production featuring 9% performance gains though may not enter into mass production until 2027 at the earliest.
BofA GLOBAL RESEARCH
Longer term, Intel ' s next major upgrade will be on 14A which is guided to start risk production in 2028 for commercialization in 2029. It is important to note A14 will be the first major node Intel provides with its external foundry customers and 0.9 PDK is targeted to be shipped in 4Q26.
For Samsung, at its recent SAFE Forum in 2Q26, the company reaffirmed four generations of 2nm roadmap, including SF2 which has been in production since 0225, SF2P in 2026, SF2P+ in 2027-28 and SF2X (no firm date). Notably, the previously announced derivative technologies, including SF2Z featuring backside power for HPC applications and SF2A for automotive applications, were not included in its latest roadmap which should be folded as part of its SF2P+ offerings. With a modest delay for its 2nm progress, the company also pushed out its SF1.4 mass production to 2029 (vs. original 2027).
On the capacity and yield planning for its advanced nodes, Samsung noted its SF2 yield is still at 50-60% levels but confirmed its SF2P+ tooling has been in installation through 2026 for mass production in 2027 in its Taylor fab. Its capacity expansion in the US along with the existing 20k WPM capacity on SF2 in Korea put the company ' s capacity installed base on the node at 35k WPM by the end of 2027.
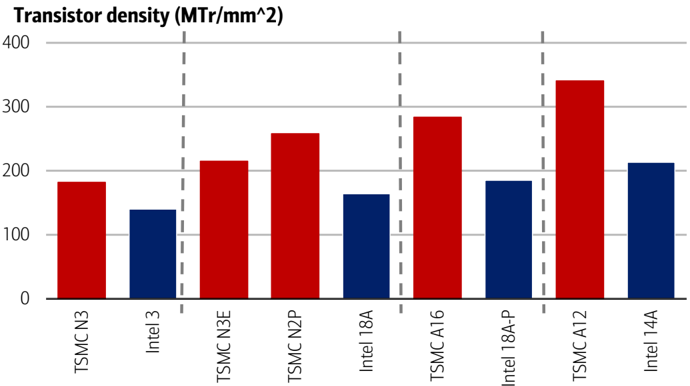
Exhibit 6: TSMC & Intel's transistor density comparison
Transistor density gap could be even widened to ~50%/~60% for TSMC's upcoming A16/A12 nodes when comparing with Intel 18A-P/14A
Source: BofA Global Research
BofA GLOBAL RESEARCH
Based on the capacity planning and technology roadmap, we believe TSMC retains the leadership through its roadmap and yield execution and scale. Specifically, the company ' s transistor density has been outperforming by ~30% for its N3/N3E vs. Intel 3/18A. With similar production timing and targeted applications, we estimate the transistor density gap could be even widened to ~50%/~60% for TSMC ' s upcoming A16/A12 nodes when comparing with Intel 18A-P/14A.
In addition to delivering superior specs on the power, performance and area, TSMC ' s execution reliability has become self-reinforcing: superior yield and on-time delivery on the leading edge technologies win customer trust. The profitable business opportunity then translates cash flow funds to the next leg of capex cycle required for further technology and capacity lead. In contrast to TSMC ' s 150-200k+ WPM capacity scale on every major node at mature yield, Samsung and Intel running their business at 15-20% of the company ' s scale at 60-70% yield is not sufficient to meet their own demand nor the stringent requirement from the external customers especially as the opportunity cost gets higher on the advanced manufacturing.
On the back-end packaging and testing solutions, TSMC provides its customers with higher complexity of the system level integration across advanced logic dies, CPO components and HBM through its CoWoS and SoIC technologies for the compute density and efficiency optimization. To accommodate larger size package, it is rolling out 5.5-reticle CoWoS in ' 26 with yield reaching 98%+ and will push the technology to 9.5x/14x reticle limit in ' 27/ ' 28
Longer term, the company develops SoW for up to 40-reticle packaging and CoPoS potentially for late ' 28 / early ' 29 mass deployment. The company is also upgrading CPO with COUPE solutions from PCB and substrate to interposer for 10x power efficiency uplift and 20x latency reduction though the contribution would still be limited based on our estimate at least through ' 27 before accelerating to 1% of its sales in ' 28 with more scale up switch adoption.
While CoPoS mass ramp is toward ' 29, the CoWoS upgrade at good yield should keep its position vs. Intel ' s EMIB-T currently at 80-85% pilot yield seeing risk of losing business if it fails to deliver 95% mass production yield by mid-' 27.
Capex track slightly ahead of its guide for 2026 and will stay aggressive in '27-28
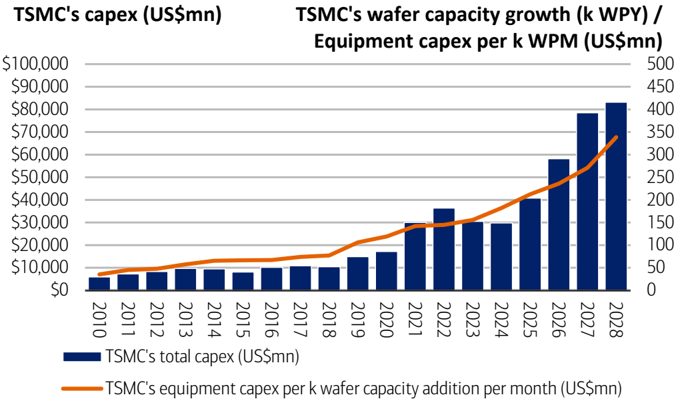
Based on our bottom up capacity analysis across front-end manufacturing and back-end packaging, TSMC ' s capex spending is tracking to US$58bn for 2026 (vs. its narrowed guidance of US$56bn). In addition to the earlier tool pull-in schedule due to tighter equipment supply with memory makers expanding, the fast-growing capex should reflect the rising cost per 1k WPM on the advanced nodes vs. mature nodes, with the equipment cost per 1k WPM advanced wafer capacity expansion has grown from US$156mn in 2023 to US$241mn in 2025. Even factoring in more common use of equipment on the advanced nodes, the capex/1k WPM advanced capacity could further rise by 20% to US$289mn in 2027 with the technology architecture upgrade.
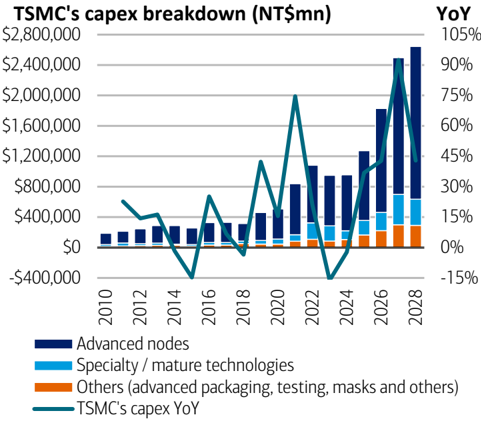
On top of the investment in the core front-end manufacturing, we expect the company to slightly outspend in the back-end packaging and estimate it is at the upper half of its guidance for 10-20% total capex, mainly for more aggressive capacity expansion to meet its customers ' demand amid growing competition from Intel ' s EMIB-T solution and technology innovation. On the other hand, the maintenance capex could be reduced for specialty technologies as the company gradually retires the equipment.
Exhibit 7: TSMC's total Capex vs. equipment spending per k WPM capacity addition
TSMC spend 1-2x more on 1k WPM expansion due to its shift to advanced nodes in recent years
Source: Company Data, BofA Global Research estimates
BofA GLOBAL RESEARCH
Considering the capex required for further 3nm capacity expansion in the additional phases in its Tainan megafab, Arizona and the recently announced 2 nd fab in Kumamoto on strong AI/HPC/automotive demand, ramping scale for 2nm family including A16, R&D on A14 supplemented by multiple back-end packaging technologies in progress (e.g. CoWoS, CoPoS, SoIC, WMCM) and lower capex efficiency in its US operation, our bottom up model shows TSMC ' s capex could be US$78bn/US$83bn in 2027/28 at a CAGR of 23% CAGR from 2026-28.
Exhibit 8: TSMC's revenue and Capex trend
TSMC's sales should still outgrow Capex to keep its capital intensity manageable
Source:
Company Data, BofA Global Research estimates
BofA GLOBAL RESEARCH
While the surge in headline capex hikes could lead to concern on accelerating depreciation, we estimate it will only grow at 17% CAGR from 2026-28 due to modestly higher portion of the spending towards facility and clean room with much longer depreciation cycle than equipment. This should keep the depreciation still undergrowing its sales of +28% CAGR, sustaining GMs expansion to 68% levels by 2028.
Exhibit 9: TSMC Capex spending breakdown by technology TSMC spends the most on advanced front-end but packaging is outgrowing
Source: Company Data, BofA Global Research estimates
Exhibit 10: TSMC's depreciation trend
TSMC's depreciation growth will be led by equipment
BofA GLOBAL RESEARCH
Source: Company Data, BofA Global Research estimates
BofA GLOBAL RESEARCH
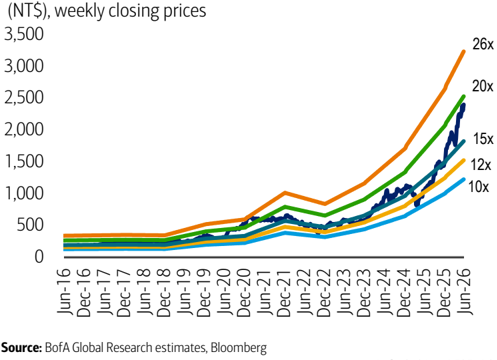
We keep our Buy rating on TSMC and lift PO from NT$3,060 to NT$3,100 on 20x '27E P/E (unchanged); our US$ADR PO remains $590. Our EPS for 2026/27/28 are now NT$107/153/178 (vs. NT$103/150/177 prior) as we factor in stronger CPU and AI GPU/ASIC demand outlook. Its current valuation seems undemanding at 17x '27E P/E (vs. its long term P/E average of 11-21x).
Capacity expansion accelerates across advanced front-end and back-end
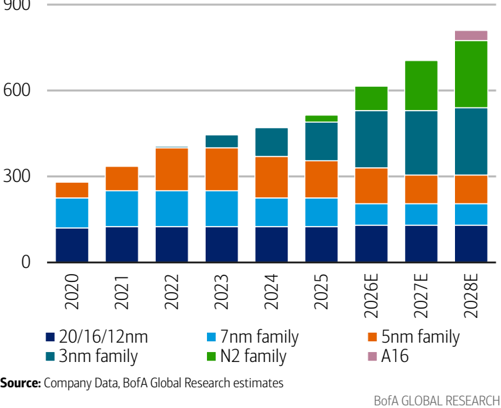
As TSMC is in the process to retire a portion of its equipment on 6 ' , 8 ' and mature 12 ' processes while still adding the capacity on the advanced nodes, we estimate the company ' s total front-end manufacturing capacity will drop by 1% YoY in 2026.
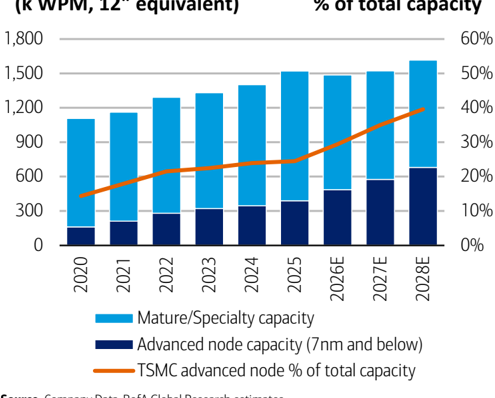
Exhibit 11: TSMC's year-end capacity by node for 20nm and below TSMC will expand aggressively on 3nm and 2nm through 2027
TSMC's year-end capacity by node 20nm and below (k WPM, 12" equivalent)
Exhibit 12: TSMC's advanced node capacity as % of its installed base TSMC's advanced nodes will reach 40% of its total capacity
TSMC's capacity (k WPM, 12" equivalent) TSMC's 7nm and below nodes % of total capacity
Source: Company Data, BofA Global Research estimates
The trend could be more stable into 2027-28 as TSMC strives to optimize its capacity mix and across node conversion to accommodate its customers ' demand especially on the leading edge technologies, with its advanced capacity set to grow by 10% CAGR from 2025-28 balanced by the mature capacity reduction at -8% CAGR.
Based on our estimate, TSMC ' s capacity for 7nm and below nodes will grow from 320k WPM per month in 2023 to ~680k WPM by 2028 at a 16% CAGR, through organic expansion and efficient conversion from higher equipment commonality, cross technology planning and AI productivity gains (e.g. tool idle time and chamber cleaning schedule optimization). This will also support the mix of 7nm and below capacity climb toward 40-45% of its total capacity (vs. 24% in 2023). By region, we expect the capacity expansion through 2027 to enable its overseas fabs to account for 17% of TSMC ' s total capacity by 2028 (vs. 7% in 2020) and similarly for the advanced node capacity (vs. ~0% in 2023), mainly in Arizona and Kumamoto.
Specifically, we believe the company is on track to target on 25% CAGR capacity expansion for its 5nm and 3nm from ' 22-27. We model its 3nm capacity will reach 190k/230k WPM by 4Q26/27. On N2 family, TSMC plans to grow capacity by 70% CAGR from ' 26-28, with 1 st year ramp delivering 45% more capacity vs. 3nm as it rolls out 5 fabs at once.
BofA GLOBAL RESEARCH
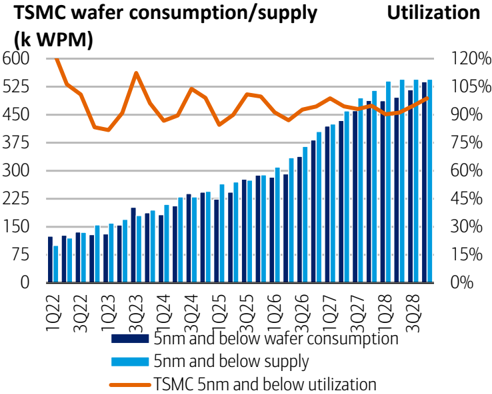
Exhibit 13: TSMC 5nm and below wafer consumption/supply/utilization
Utilization of 5nm and blow to remain high
Source: BofA Global Research estimates
BofA GLOBAL RESEARCH
On the demand, with 5nm and 3nm generating ~50% of TSMC ' s revenue in 2025, we analyze the supply and demand landscape through our bottom-up capacity model and wafer consumption by the company ' s major customers for their major products on these nodes. Based on our estimate, the utilization for 5nm and below nodes could stay high at least 90% if we only consider the effective capacity which is especially important during the period of frequent capacity conversion and new node ramp in the next few years.
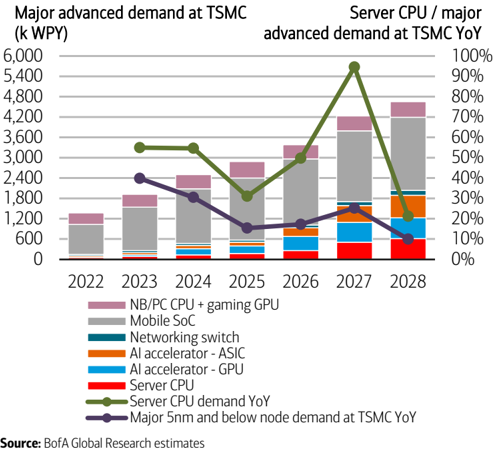
Exhibit 15: Major 5nm and below wafer demand at TSMC
Server CPU demand outgrows overall major advanced chipsets
BofA GLOBAL RESEARCH
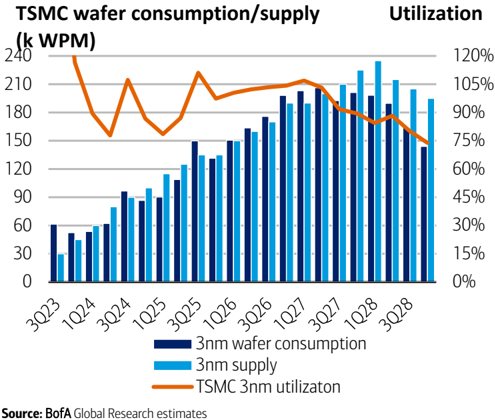
We would note 3nm, as a sweet spot for high performance computing, networking and flagship smartphone chipsets, could see the utilization staying close to full even with continued expansion on strong project pipeline, sustaining continued price hikes even in 2027 following the price surge in 2025-26. The node could be even more profitable from 2028-29 when the fixed cost starts rolling off following 5 year depreciation cycle.
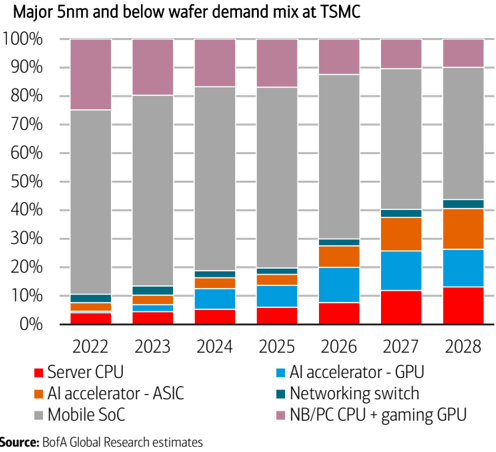
Exhibit 16: Major 5nm and below wafer demand mix at TSMC Server CPU accounts for 13% in 2028
Source: BofA Global Research estimates
BofA GLOBAL RESEARCH
Exhibit 14: TSMC 3nm wafer consumption/supply/utilization
TSMC 3nm to see utilization staying close to full
BofA GLOBAL RESEARCH
Source: BofA Global Research estimates
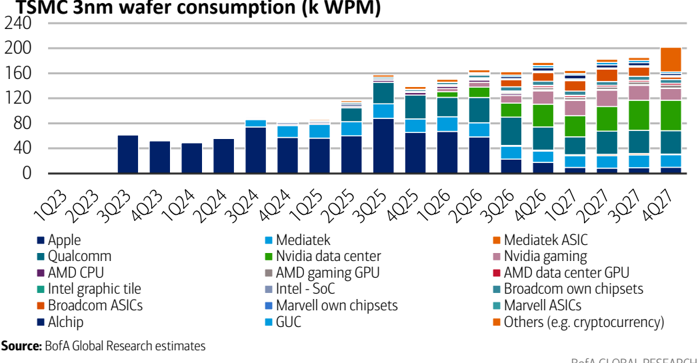
Exhibit 17: TSMC 3nm wafer consumption by customers
Mediatek and Qualcomm should remain the largest customers following Apple's migration to 2nm
Source:
BofA Global Research estimates
BofA GLOBAL RESEARCH
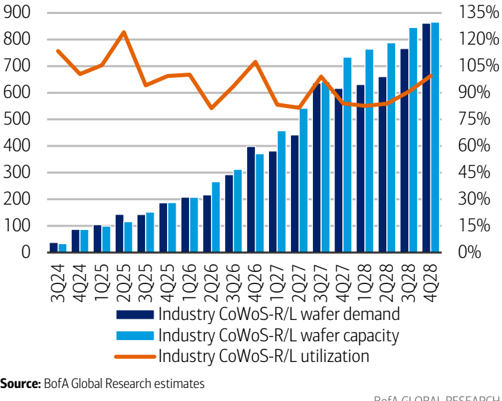
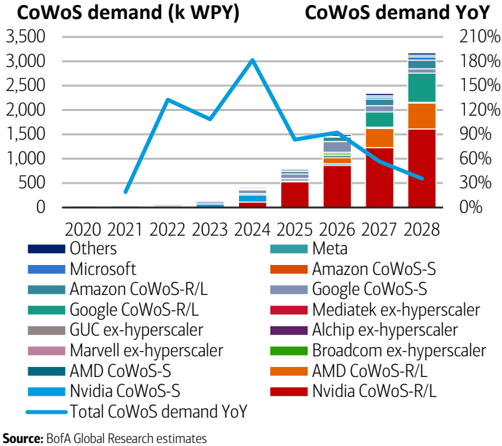
On the back-end packaging, with surging server CPU demand on top of the already strong order backlog for GPUs and ASICs, we estimate the industry ' s CoWoS supply will need to grow by 52% CAGR from 2026-28. TSMC will still lead the capacity expansion from 120k WPM in 4Q26 to 180k WPM in 4Q27, while the OSATs will also grow their portion of the supply with ASE and Amkor adding capacity to 70-75k WPM (vs. 30-35k in 4Q26) and 25-30k WPM (vs. 15-20k by 4Q26) in 4Q27 respectively. Specifically, while TSMC should still lead the supply for complex GPU and ASIC packaging, ASE grows as a major 2 nd source with its capacity share growing from 18% of the industry in ' 26 to 29% in ' 27 and proven track record with as the major CoWoS full process server provider for AMD ' s Venice server CPU.
Exhibit 18: Industry CoWoS-R/L supply/demand CoWoS-R/L utilization should stay at high levels
Industry CoWoS-R/L wafer supply/demand (k WPQ) CoWoS-R/L utilization
Source:
BofA Global Research estimates
BofA GLOBAL RESEARCH
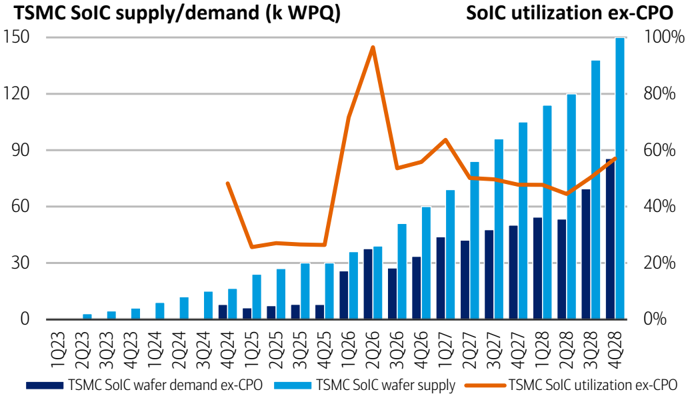
We estimate TSMC ' s SoIC capacity will reach 20k WPM by 4Q26 and will need to grow to 35k WPM by 4Q27 and further to 50k WPM by 4Q28 with the applications proliferating from AMD ' s GPUs to Apple ' s M-series CPUs in 2026, hyperscalers ' customized ARM based server CPUs in 2027 and adoption by Nvidia for its Feynman GPU along with the inflection of CPO penetration in 2028.
Exhibit 19: Industry CoWoS demand CoWoS demand should remain strong through 2028
BofA GLOBAL RESEARCH
Similar to CoWoS, the SoIC technology could be even more important for TSMC going forward and the capacity ramp could be steep given much faster data transmission required for the HPC chipsets across CPUs, GPUs, AI accelerators and networking switches. At full utilization, we estimate SoIC could contribute US$2516mn annually to TSMC in 2028 (1% of the company ' s total sales)
Exhibit 20: TSMC SoIC supply/demand trend
TSMC's SoIC capacity will reach 20k WPM by 4Q26 and will need to grow to 35k WPM by 4Q27
Source: Company Data, BofA Global Research estimates
BofA GLOBAL RESEARCH
TSMC valuation reasonable and has room to re-rate with its HPC customers
Exhibit 21: TSMC's P/E valuation band
TSMC's share at 17x '27E P/E is undemanding
Source: BofA Global Research estimates, Bloomberg
BofA GLOBAL RESEARCH
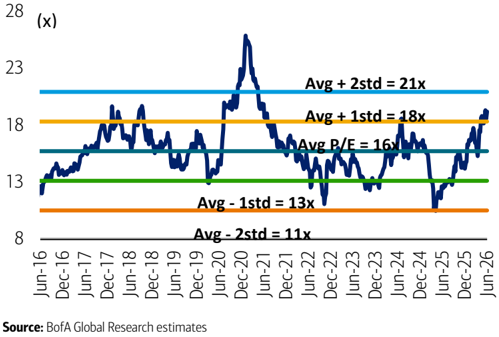
TSMC ' s current valuation remains well supported when viewed through both its historical context and its relative positioning vs. its customers. In the past decade, TSMC ' s forward P/E has averaged ~16x with a range of 11-21x through the cycles.
Exhibit 22: TSMC's valuation based on BofA estimates
TSMC's valuation of 17x '27E P/E is at the middle of its historical 11-21x range
BofA GLOBAL RESEARCH
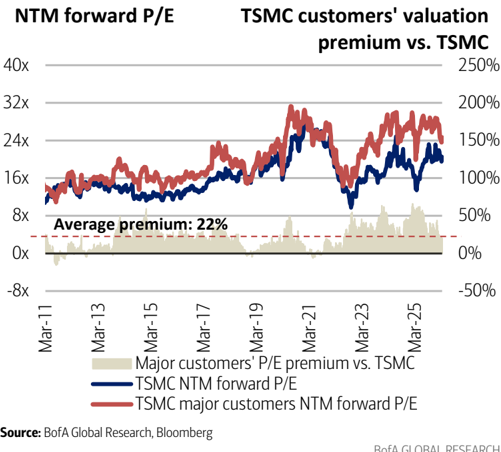
Exhibit 23: TSMC's P/E trend vs. its customers
TSMC customers' P/E is now at 50% premium to TSMC vs. 22% average
Source: BofA Global Research, Bloomberg
BofA GLOBAL RESEARCH
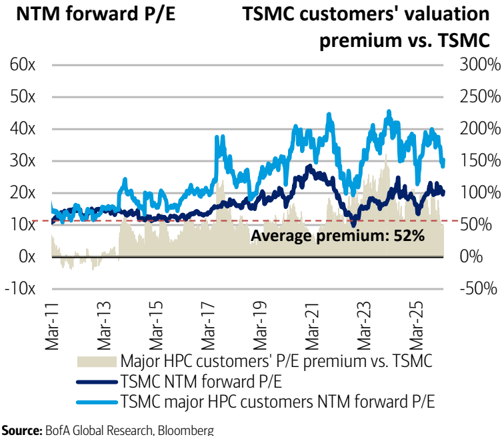
The relatively more modest valuation improvement for TSMC also contrasts with its customers ' more pronounced re-ratings. Based on our analysis of forward P/E spreads, TSMC ' s major customers usually have a 22% average premium vs. TSMC in the long term though the current level is at 45%, suggesting TSMC ' s valuation has been lagging.
Specifically, the valuation deviation for TSMC ' s HPC customers vs. the company has widened with 100-150% valuation premium vs. TSMC at this stage (vs. historical average of 52%). We believe this is driven by a surge in valuation for the direct beneficiaries from AI data center deployment, including the companies designing GPUs, ASICs and networking chipsets.
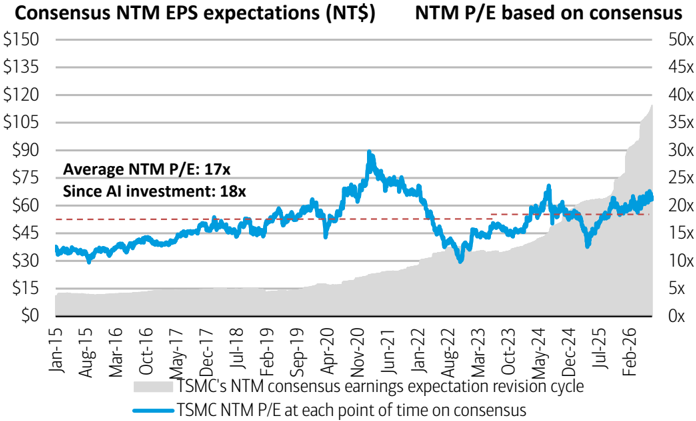
Exhibit 25: TSMC's consensus earnings vs. P/E trend
TSMC's share price strength only driven by earnings upgrade so far
Source: BofA Global Research, Bloomberg
Exhibit 24: TSMC's P/E trend vs. its HPC customers
HPC fabless are the main driver for valuation premium at 100%
BofA GLOBAL RESEARCH
Source: BofA Global Research, Bloomberg
BofA GLOBAL RESEARCH
It is also noteworthy that, while TSMC ' s share performance since 2H23 has been solid, it is predominantly driven by the earnings upward revisions rather than multiple expansion.
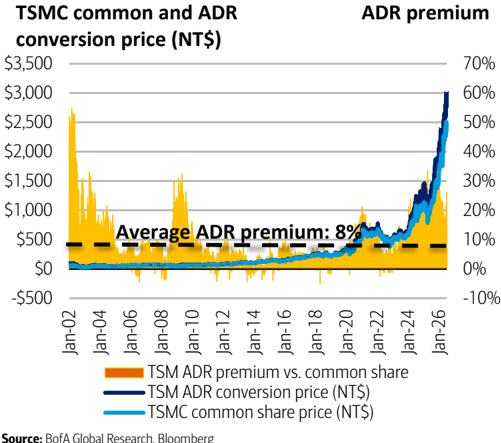
The company ' s NTM P/E has remained largely stable, only lifted to 18x in the past 2 years vs. its long-term ~17x levels. The company ' s ADR though has been performing better as it attracts a broader investor base vs. common share, with its premium still at 19% (vs. the long term average 8%) and at 21x 2027E consensus P/E.
With its firmer technology leadership, this should bode well for the company ' s earnings upgrade cycle and its share should also be re-rated at least 20x NTM P/E (24x P/E for ADR factoring the premium), back closer to its customers and the broader ecosystem.
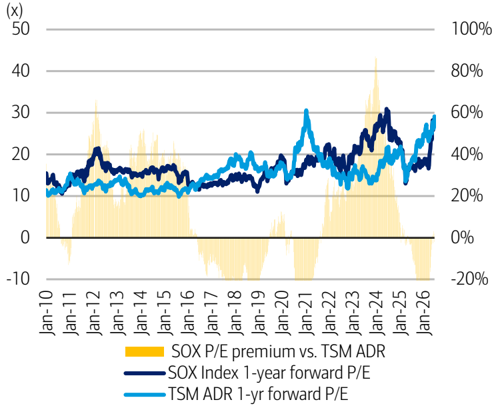
Exhibit 26: TSM ADR 1-year forward P/E vs. SOX premium
SOX index P/E following recent rally is back to 3% premium vs. TSM ADR, in line with long term average
Source: BofA Global Research, Bloomberg
Exhibit 27: TSM ADR conversion price vs. common share and premium TSM ADR premium is higher than common historical level at 15%
BofA GLOBAL RESEARCH
Source: BofA Global Research, Bloomberg
BofA GLOBAL RESEARCH
Exhibit 28: TSMC's quarterly and annual income statement TSMC's quarterly and annual income statement
| (NT$bn, %) | 1Q26 | 2Q26E | 3Q26E | 4Q26E | 1Q27E | 2Q27E | 3Q27E | 4Q27E | 2025 | 2026E | 2027E | 2028E |
|---|---|---|---|---|---|---|---|---|---|---|---|---|
| Revenues | $1,134 | $1,274 | $1,419 | $1,534 | $1,652 | $1,793 | $2,000 | $2,094 | $3,809 | $5,361 | $7,538 | $8,812 |
| Cost of Sales | -$383 | -$411 | -$457 | -$499 | -$511 | -$559 | -$615 | -$661 | -$1,528 | -$1,750 | -$2,346 | -$2,838 |
| Gross Profit | $751 | $863 | $962 | $1,035 | $1,141 | $1,234 | $1,385 | $1,432 | $2,281 | $3,611 | $5,192 | $5,974 |
| Operating Expenses | -$92 | -$111 | -$120 | -$123 | -$128 | -$134 | -$147 | -$154 | -$345 | -$446 | -$563 | -$635 |
| Operating Income | $659 | $752 | $842 | $911 | $1,013 | $1,100 | $1,238 | $1,278 | $1,936 | $3,165 | $4,629 | $5,339 |
| Non-operating Income (Exp) | $29 | $94 | $34 | $37 | $40 | $42 | $46 | $51 | $106 | $194 | $179 | $260 |
| Pretax Income | $688 | $846 | $877 | $948 | $1,053 | $1,142 | $1,285 | $1,329 | $2,042 | $3,359 | $4,808 | $5,599 |
| Net tax | -$115 | -$169 | -$147 | -$159 | -$176 | -$228 | -$216 | -$223 | -$326 | -$591 | -$844 | -$983 |
| Net Income | $573 | $677 | $730 | $789 | $877 | $913 | $1,069 | $1,106 | $1,718 | $2,769 | $3,968 | $4,619 |
| Fully Diluted EPS - Local (NT$) | $22.08 | $26.12 | $28.15 | $30.43 | $33.84 | $35.25 | $41.24 | $42.67 | $66.24 | $106.78 | $153.00 | $178.13 |
| %of Revenue | ||||||||||||
| Gross Profit | 66.2 | 67.7 | 67.8 | 67.4 | 69.1 | 68.8 | 69.3 | 68.4 | 59.9 | 67.4 | 68.9 | 67.8 |
| Operating Expenses | -8.1 | -8.7 | -8.4 | -8.0 | -7.7 | -7.5 | -7.3 | -7.4 | -9.1 | -8.3 | -7.5 | -7.2 |
| Operating Income | 58.1 | 59.0 | 59.4 | 59.4 | 61.3 | 61.3 | 61.9 | 61.1 | 50.8 | 59.0 | 61.4 | 60.6 |
| Pretax Income | 60.6 | 66.4 | 61.8 | 61.8 | 63.8 | 63.7 | 64.2 | 63.5 | 53.6 | 62.6 | 63.8 | 63.5 |
| Net Income | 50.5 | 53.1 | 51.4 | 51.4 | 53.1 | 50.9 | 53.4 | 52.8 | 45.1 | 51.6 | 52.6 | 52.4 |
| QoQ Growth% | ||||||||||||
| Revenues | 8.4 | 12.4 | 11.3 | 8.1 | 7.7 | 8.6 | 11.5 | 4.7 | ||||
| Gross Profit | 15.2 | 14.9 | 11.5 | 7.5 | 10.3 | 8.2 | 12.2 | 3.4 | ||||
| Operating Income | 16.7 | 14.2 | 12.0 | 8.1 | 11.2 | 8.6 | 12.6 | 3.2 | ||||
| Net Income | 13.3 | 18.2 | 7.8 | 8.1 | 11.2 | 4.2 | 17.0 | 3.5 | ||||
| YoY Growth% | ||||||||||||
| Revenues | 35.1 | 36.5 | 43.3 | 46.6 | 45.6 | 40.7 | 40.9 | 36.5 | 31.6 | 40.8 | 40.6 | 16.9 |
| Gross Profit | 52.3 | 57.7 | 63.5 | 58.7 | 51.8 | 43.0 | 43.9 | 38.4 | 40.4 | 58.3 | 43.8 | 15.1 |
| Operating Income | 61.9 | 62.3 | 68.3 | 61.3 | 53.7 | 46.2 | 47.0 | 40.3 | 46.4 | 63.5 | 46.3 | 15.3 |
| Net Income | 58.8 | 70.3 | 61.5 | 56.0 | 53.1 | 35.0 | 46.5 | 40.2 | 46.4 | 61.2 | 43.3 | 16.4 |
| EPS | 58.3 | 70.1 | 61.4 | 56.0 | 53.3 | 35.0 | 46.5 | 40.2 | 46.4 | 61.2 | 43.3 | 16.4 |
Source: Company data, BofA Global Research
BofA GLOBAL RESEARCH
Exhibit 29: TSMC's quarterly and annual balance sheet
TSMC's quarterly and annual balance sheet
| (NT$bn) | 1Q26 | 2Q26E | 3Q26E | 4Q26E | 1Q27E | 2Q27E | 3Q27E | 4Q27E | 2025 | 2026E | 2027E | 2028E |
|---|---|---|---|---|---|---|---|---|---|---|---|---|
| Cash | $3,036 | $3,381 | $3,676 | $4,042 | $4,248 | $4,622 | $5,130 | $5,829 | $2,768 | $4,042 | $5,829 | $8,344 |
| Short Term Investment | $348 | $324 | $336 | $330 | $333 | $332 | $332 | $332 | $301 | $330 | $332 | $332 |
| Accounts receivable | $363 | $305 | $349 | $330 | $411 | $402 | $452 | $416 | $282 | $330 | $416 | $440 |
| Inventory | $311 | $351 | $358 | $343 | $400 | $424 | $454 | $443 | $288 | $343 | $443 | $522 |
| Other current assets | $207 | $134 | $140 | $150 | $162 | $159 | $149 | $152 | $179 | $150 | $152 | $153 |
| Current Assets | $4,266 | $4,495 | $4,860 | $5,194 | $5,554 | $5,938 | $6,517 | $7,172 | $3,817 | $5,194 | $7,172 | $9,790 |
| Long Term Investments | $167 | $169 | $168 | $169 | $168 | $169 | $168 | $169 | $172 | $169 | $169 | $169 |
| Fixed Assets | $3,955 | $4,242 | $4,516 | $4,895 | $5,291 | $5,687 | $6,068 | $6,432 | $3,692 | $4,895 | $6,432 | $7,838 |
| Other Assets | $274 | $253 | $262 | $260 | $263 | $260 | $261 | $261 | $252 | $260 | $261 | $261 |
| Long-term Assets | $4,395 | $4,665 | $4,946 | $5,324 | $5,722 | $6,116 | $6,498 | $6,861 | $4,116 | $5,324 | $6,861 | $8,268 |
| Total Assets | $8,661 | $9,160 | $9,806 | ##### | $11,276 | $12,053 | $13,015 | $14,033 | $7,933 | $10,518 | $14,033 | $18,058 |
| Short term loans | $0 | $0 | $0 | $0 | $0 | $0 | $0 | $0 | $0 | $0 | $0 | $0 |
| Notes &Accounts Payable | $100 | $90 | $95 | $98 | $115 | $117 | $131 | $133 | $84 | $98 | $133 | $166 |
| Current portion of long term debt | $156 | $116 | $121 | $133 | $132 | $125 | $128 | $129 | $137 | $133 | $129 | $128 |
| Other current Liabilities | $1,458 | $1,458 | $1,458 | $1,458 | $1,473 | $1,473 | $1,473 | $1,473 | $1,237 | $1,458 | $1,473 | $1,487 |
| Current Liabilities | $1,714 | $1,664 | $1,674 | $1,689 | $1,719 | $1,715 | $1,731 | $1,735 | $1,458 | $1,689 | $1,735 | $1,782 |
| Long term debt | $901 | $902 | $905 | $902 | $903 | $903 | $903 | $903 | $896 | $902 | $903 | $903 |
| Other non-current liabilities | $113 | $121 | $119 | $153 | $127 | $130 | $132 | $176 | $118 | $153 | $176 | $199 |
| Long-term Liabilities | $1,014 | $1,023 | $1,025 | $1,055 | $1,029 | $1,033 | $1,035 | $1,079 | $1,014 | $1,055 | $1,079 | $1,102 |
| Total Liabilities | $2,729 | $2,688 | $2,699 | $2,744 | $2,748 | $2,748 | $2,767 | $2,813 | $2,472 | $2,744 | $2,813 | $2,883 |
| Total parent shareholders' equity | $5,891 | $6,434 | $7,067 | $7,734 | $8,487 | $9,266 | $10,209 | $11,180 | $5,420 | $7,734 | $11,180 | $15,135 |
| Minority Interest | $41 | $39 | $40 | $40 | $40 | $40 | $40 | $40 | $41 | $40 | $40 | $40 |
| Total Liabilities and Equity | $8,661 | $9,160 | $9,806 | ##### | $11,276 | $12,053 | $13,015 | $14,033 | $7,933 | $10,518 | $14,033 | $18,058 |
BofA GLOBAL RESEARCH
Source: Company data, BofA Global Research
Exhibit 30: TSMC's quarterly and annual cash flow
TSMC's quarterly and annual cash flow
| (NT$bn) | 1Q26 | 2Q26E | 3Q26E | 4Q26E | 1Q27E | 2Q27E | 3Q27E | 4Q27E | 2025 | 2026E | 2027E | 2028E |
|---|---|---|---|---|---|---|---|---|---|---|---|---|
| Net Profit | $572 | $677 | $730 | $789 | $878 | $914 | $1,070 | $1,107 | $1,718 | $2,769 | $3,968 | $4,619 |
| Depreciation &Amortization | $165 | $190 | $231 | $239 | $238 | $248 | $258 | $289 | $688 | $825 | $1,033 | $1,157 |
| Change in Working Capital | -$118 | $82 | -$53 | $28 | -$134 | -$9 | -$56 | $45 | -$72 | -$60 | -$154 | -$70 |
| Other adjustment | $79 | $10 | $15 | $22 | $8 | $2 | $15 | $34 | -$59 | $125 | $59 | $73 |
| Operating Cash Flow | $699 | $959 | $923 | $1,078 | $989 | $1,154 | $1,287 | $1,475 | $2,275 | $3,659 | $4,906 | $5,779 |
| Capital Expenditure | -$351 | -$462 | -$462 | -$572 | -$624 | -$624 | -$624 | -$624 | -$1,272 | -$1,846 | -$2,496 | -$2,645 |
| Proceeds from sale of non-current assets | $2 | $1 | $1 | $1 | $1 | $1 | $1 | $1 | $1 | $4 | $4 | $4 |
| Acquisitions/Disposals of investments | -$30 | $21 | -$10 | $5 | -$3 | $1 | -$1 | $0 | -$37 | -$15 | -$2 | $0 |
| Other investment items | $22 | $21 | -$9 | $2 | -$2 | $3 | -$2 | $0 | $164 | $36 | -$1 | $0 |
| Investing Cash Flow | -$357 | -$419 | -$480 | -$564 | -$628 | -$619 | -$625 | -$622 | -$1,144 | -$1,821 | -$2,494 | -$2,641 |
| Net Share issue/repurchase | $0 | $0 | $0 | $0 | $0 | $0 | $0 | $0 | $0 | $0 | $0 | $0 |
| Dividends paid | -$130 | -$156 | -$156 | -$156 | -$156 | -$156 | -$156 | -$156 | -$467 | -$596 | -$622 | -$622 |
| Change in debt | $14 | -$39 | $9 | $7 | $0 | -$6 | $3 | $1 | $43 | -$9 | -$2 | -$1 |
| Other financing cash flow | -$5 | $0 | $0 | $0 | $0 | $0 | $0 | $0 | -$17 | -$5 | $0 | $0 |
| Financing Cash Flow | -$120 | -$195 | -$147 | -$148 | -$156 | -$161 | -$153 | -$155 | -$440 | -$610 | -$625 | -$623 |
| Net Change in Cash | $222 | $345 | $296 | $365 | $206 | $374 | $509 | $698 | $690 | $1,228 | $1,787 | $2,515 |
| Exchange effect | $46 | $0 | $0 | $0 | $0 | $0 | $0 | $0 | -$50 | $46 | $0 | $0 |
| Cash, Beginning of Year | $2,768 | $3,036 | $3,381 | $3,676 | $4,042 | $4,248 | $4,622 | $5,130 | $2,128 | $2,768 | $4,042 | $5,829 |
| Cash, End of Year | $3,036 | $3,381 | $3,676 | $4,042 | $4,248 | $4,622 | $5,130 | $5,829 | $2,768 | $4,042 | $5,829 | $8,344 |
Source: Company data, BofA Global Research
BofA GLOBAL RESEARCH
Exhibit 31: Terms and definitions
Glossary of abbreviations/acronyms
| Term | Definition |
|---|---|
| AI | Artificial Intelligence |
| AMD | Advanced Micro Devices |
| ASIC | Application Specific Integrated Circuit |
| CoPoS | Chip-on-Panel-on-Substrate |
| COUPE | Compact Universal Photonic Engine |
| CoWoS | Chip-on-Wafer-on-Substrate |
| CoWoS-L | Chip-on-Wafer-on-Substrate-Local Silicon Bridge |
| CPO | Co-Packaged Optics |
| CPU | Central Processing Unit |
| EMIB | Embedded Multi-die Interconnect Bridge |
| GPU | Graphic Processing Unit |
| HBM | High Bandwidth Memory |
| HPC | High-Performance Computing |
| PCB | Printed Circuit Board |
| PDK | Process design kit |
| SoIC | System on Integrated Chips |
| TPU | Tensor Processing Unit |
| VIS | Vanguard |
| WMCM | Wafer-level-multi-chip-module |
| WPM | Wafer per month |
Source:
BofA Global Research
BofA GLOBAL RESEARCH
Price objective basis & risk
Taiwan Semiconductor Manufacturing Co. (TSMWF / TSM)
Our PO for TSMC is NT$3,100 per share (US$590 per ADR), based on 20x 2027E P/E. TSMC's valuation has traded in the range of 10-26x PE from 2017. 20x is in the mid to high end of the historical range, above the average P/E of 18x. We think a PE above the average is justified given TSMC's enhanced industry position and mid-40% 5-year CAGR in AI should underpin a rerating
Downside risks to our price objective are: (1) greater-than-expected slowdown in global smartphone/consumer electronics demand, (2) Intel's potential insourcing strategy and ambitions in foundry service, (3) execution risks on advanced nodes, and (4) higher than expected tariffs.