PDF 原檔:報告_GS_聯亞光電3081_20260728_original.pdf
圖片清單(已驗證 2026-07-29)
| 檔名 | size | 分類 | 親眼所見內容 |
|---|---|---|---|
報告_GS_聯亞光電3081_20260728_003.png |
96KB | 文字卡 | 封面資訊卡:「3081.TWO」「Buy」「GS Forecast」標題+市值/EV/ADTV 文字+ 12/25-12/28E 營收/EBITDA/EPS/PE/PB/殖利率/CROCI 數字表 |
報告_GS_聯亞光電3081_20260728_004.png |
77KB | 真資料圖 | 「Goldman Sachs rating and stock price target history」股價走勢折線圖(灰=Taiwan SE Weighted Index,淺藍=股價)疊加歷次目標價數字標籤(434/505/589/686/654/449/762/867/1403/1603/1830/2081)與評等區間色帶(NA/B),2023-2026 |
報告_GS_聯亞光電3081_20260728_002.png |
47KB | 真資料圖 | 12M forward P/E 走勢折線圖,Y軸 0-200x,Jan-17 至 2026,含 +1stv 82x / avg 56x / -1stv 30x 三條虛線水平參考線 |
報告_GS_聯亞光電3081_20260728_001.png |
26KB | 文字卡 | 「2029E target P/E」「Target multiple x EPS」「Discounted back to 2027; TP(NTD)」「Implied 2027 P/E」估值推導表,下方「COE assumption」表(Beta/Risk free/Market risk premium/COE) |
原始內容
For the exclusive use of KEVINLU@LENOVO.COM
LandMark (3081.TWO): 3Q26 QoQ growth on 800G / 1.6T SiPh ramp up; Capacity expansion to capture the strong demand; Buy
Landmark June revenues were up 128% YoY / 4% MoM to NT$421m, or 1% higher than our previous estimates, resulting in strong 2Q26 revenues at NT$1.2bn (+121% YoY, +35% QoQ), re fl ecting strong demand on 800G / 1.6T SiPh optical modules, better InP substrate supply, and Landmark's capacity expansion. With continuous capex spending and rising penetration of Silicon Photonics (SiPh), we expect to see sequential MoM growth in Jul to Sep at 5% / 5% / 7% MoM to NT$442m / 464m / 498m. Maintain Buy.
Capacity expansion: In mid June, Landmark announced the company has obtained equipment from Aixtron with total value at ~NT$837m, supporting its capacity expansion across InP epiwafer and CW lasers. The company also notes its plan of equipment procurement at NT$3bn is approved by the board, supporting the company to further capture the strong demand on SiPh optical modules.
Allen Chang
+852-2978-2930 | allen.k.chang@gs.com Goldman Sachs (Asia) L.L.C.
Verena Jeng
+852-2978-1681 | verena.jeng@gs.com Goldman Sachs (Asia) L.L.C.
Ting Song
+852-2978-6466 | ting.song@gs.com Goldman Sachs (Asia) L.L.C.
e92c7a75ab8b4efbba794e6b187208c8
For the exclusive use of KEVINLU@LENOVO.COM
Exhibit 1: We expect Landmark July 2026E revenues to grow 144% YoY to NT$442m Landmark monthly/ quarterly revenues
| Apr 2026 | May 2026 | Jun 2026 | Jul 2026E | Aug 2026E | Sep 2026E | 4Q25 | 1Q26 | 2Q26 | 3Q26E | |
|---|---|---|---|---|---|---|---|---|---|---|
| Revenues (NT$m) | 395 | 405 | 421 | 442 | 464 | 498 | 642 | 904 | 1,221 | 1,403 |
| YoY | 115% | 119% | 128% | 144% | 150% | 167% | 122% | 99% | 121% | 154% |
| MoM/QoQ | 15% | 3% | 4% | 5% | 5% | 7% | 16% | 41% | 35% | 15% |
| GS estimates (NT$m) | 347 | 361 | 416 | 629 | 875 | 1,123 | ||||
| Actual vs. GS | 14% | 12% | 1% | 2% | 3% | 9% |
Source: Company data, Goldman Sachs Global Investment Research
Earnings revision: We factor in Landmark 2Q26 revenues and revise up 2026E earnings by 1% mainly on higher revenues of 800G/ 1.6T SiPh CW laser, supported by strong demand and improving supply. We keep 2027-29E unchanged.
Exhibit 2: Earnings revision
| 2026E | 2026E | 2026E | 2027E | 2027E | 2027E | 2028E | 2028E | 2028E | 2029E | 2029E | 2029E | |
|---|---|---|---|---|---|---|---|---|---|---|---|---|
| NT$m | Old | New | Diff% | Old | New | Diff% | Old | New | Diff% | Old | New | Diff% |
| Revenues | 4,992 | 5,047 | 1% | 9,370 | 9,365 | 0% | 14,719 | 14,713 | 0% | 22,078 | 22,080 | 0% |
| GP | 2,746 | 2,778 | 1% | 5,234 | 5,232 | 0% | 8,387 | 8,384 | 0% | 12,580 | 12,582 | 0% |
| OP | 2,043 | 2,075 | 2% | 4,370 | 4,367 | 0% | 7,211 | 7,209 | 0% | 10,839 | 10,840 | 0% |
| Pre-tax income | 2,138 | 2,169 | 1% | 4,467 | 4,464 | 0% | 7,342 | 7,340 | 0% | 10,970 | 10,971 | 0% |
| Net income | 1,710 | 1,736 | 1% | 3,573 | 3,571 | 0% | 5,873 | 5,872 | 0% | 8,776 | 8,777 | 0% |
| Margins | ||||||||||||
| GM | 55.0% | 55.0% | 0ppts | 55.9% | 55.9% | 0ppts | 57.0% | 57.0% | 0ppts | 57.0% | 57.0% | 0ppts |
| OPM | 40.9% | 41.1% | 0.2ppts | 46.6% | 46.6% | 0ppts | 49.0% | 49.0% | 0ppts | 49.1% | 49.1% | 0ppts |
| NM | 34.3% | 34.4% | 0.1ppts | 38.1% | 38.1% | 0ppts | 39.9% | 39.9% | 0ppts | 39.7% | 39.8% | 0ppts |
Source: Company data, Goldman Sachs Global Investment Research
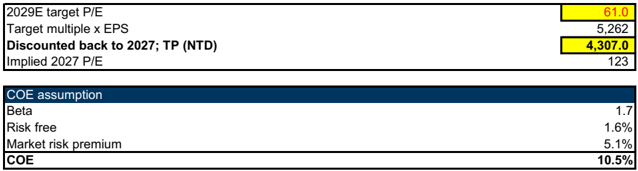
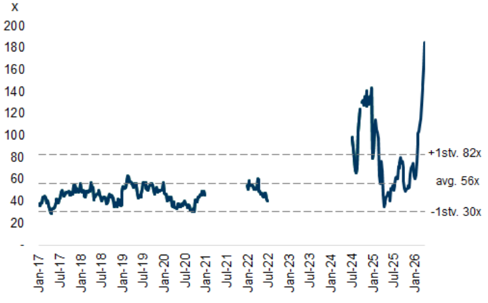
Valuation: We employ a discounted P/E methodology (unchanged) and apply a 61.0x (unchanged) target P/E multiple on our 2029E EPS, discounted back to 2027E, at a COE of 10.5% (beta 1.7x, risk free rate 1.6%, and market risk premium at 5.1% - unchanged). Our target P/E multiple of 61.0x is derived from the PEG&M ratio of peers (unchanged) in the photonics supply chain, re fl ecting an industry re-rating of product mix upgrade and rising demand on optical solution. Consequently, our 12-month target price is now NT$4,307.00 (vs. previously at NT$4,307.27). The implied 2028E P/E at 75x is between company's avg. P/E at 56x and avg. +1 P/E at 82x. Maintain Buy.
e92c7a75ab8b4efbba794e6b187208c8
X
200
180
160
140
120
100
80
60
20
Jan-17
For the exclusive use of KEVINLU@LENOVO.COM
Jul-17
Exhibit 3: Landmark discounted P/E
Jan-18
| (NT$ mn) | 2022 | 2023 | 2024 | 2025 | 2026E | 2027E | 2028E | 2029E | 2030E | 2031E | 2032E |
|---|---|---|---|---|---|---|---|---|---|---|---|
| Milestones | 5G infrastructure cycle | 5G infrastructure cycle | 5G infrastructure cycle | SiPh in AI data center | SiPh in AI data center | SiPh in AI data center | CPO | CPO | CPO | CPO | CPO |
| SiPh Rev contribution | 13% | 35% | 42% | 70% | 87% | 93% | 96% | 96% | 96% | 96% | 96% |
| SiPh GP contribution | 15% | 25% | 41% | 71% | 90% | 95% | 97% | 97% | 97% | 97% | 97% |
| Revenue | 2,381 | 1,056 | 1,208 | 2,203 | 5,047 | 9,365 | 14,713 | 22,080 | 32,915 | 46,081 | 63,592 |
| YoY | 27% | -56% | 14% | 82% | 129% | 86% | 57% | 50% | 49% | 40% | 38% |
| Gross profit | 759 | 138 | 239 | 941 | 2,778 | 5,232 | 8,384 | 12,582 | 18,756 | 26,258 | 36,300 |
| Gross margin | 31.9% | 13.1% | 19.8% | 42.7% | 55.0% | 55.9% | 57.0% | 57.0% | 57.0% | 57.0% | 57.1% |
| Operating profit | 335 | -280 | -112 | 508 | 2,075 | 4,367 | 7,209 | 10,840 | 16,193 | 22,762 | 31,666 |
| YoY | -18% | -184% | -60% | -555% | 308% | 111% | 65% | 50% | 49% | 41% | 39% |
| Operating margin | 14% | -27% | -9% | 23% | 41% | 47% | 49% | 49% | 49% | 49% | 50% |
| Pre-tax profit | 378 | -264 | -68 | 525 | 2,169 | 4,464 | 7,340 | 10,971 | 16,323 | 22,893 | 31,797 |
| Net profit | 330 | -212 | -55 | 411 | 1,736 | 3,571 | 5,872 | 8,777 | 13,059 | 18,314 | 25,437 |
| EPS (NT$, diluted) | 3.26 | -2.10 | -0.54 | 4.21 | 17.06 | 35.10 | 57.71 | 86.26 | 128.34 | 180.00 | 250.00 |
| YoY | -2% | n.a. | n.a. | n.a. | 322% | 106% | 64% | 49% | 49% | 40% | 39% |
| TP implied P/E | 253 | 123 | 75 | 50 | 34 | 24 | 17 |
Source: Company data, Goldman Sachs Global Investment Research
Exhibit 4: Landmark 12M forward P/E
Source: Eikon Datastream
Exhibit 5: The target P/E is derived from peers correlation between P/E to sum of NI YoY and OPM
| Valuatoin | 2029E P/E | 2030 NI YoY | 2030 OPM | PEG&M |
|---|---|---|---|---|
| Landmark | 61 | 49% | 49% | 0.62 |
| Peers | 2026E P/E | 2027 NI YoY | 2027 OPM | PEG&M |
| Mitac | 11 | 16% | 5% | 0.5 |
| HG Tech | 34 | 31% | 14% | 0.8 |
| Shennan | 35 | 47% | 19% | 0.5 |
| Avg. | 34 | 32% | 25% | 0.62 |
e92c7a75ab8b4efbba794e6b187208c8
For the exclusive use of KEVINLU@LENOVO.COM
Exhibit 6: Landmark P&L Summary
| NT$ mn | 2023 | 2024 | 2025 | 2026E | 2027E | 2028E | 1Q25 | 2Q25 | 3Q25 | 4Q25 | 1Q26 | 2Q26E | 3Q26E | 4Q26E |
|---|---|---|---|---|---|---|---|---|---|---|---|---|---|---|
| Income statement | ||||||||||||||
| Revenue | 1,056 | 1,208 | 2,203 | 5,047 | 9,365 | 14,713 | 455 | 553 | 553 | 642 | 904 | 1,221 | 1,403 | 1,518 |
| Gross profit | 138 | 239 | 941 | 2,778 | 5,232 | 8,384 | 147 | 240 | 241 | 313 | 495 | 670 | 773 | 839 |
| OP income | (280) | (112) | 508 | 2,075 | 4,367 | 7,209 | 45 | 150 | 105 | 209 | 373 | 516 | 529 | 657 |
| Pretax income | (264) | (68) | 525 | 2,169 | 4,464 | 7,340 | 53 | 121 | 124 | 227 | 397 | 539 | 553 | 681 |
| Net income | (212) | (55) | 411 | 1,736 | 3,571 | 5,872 | 42 | 97 | 99 | 190 | 318 | 432 | 442 | 544 |
| EPS (NT$) | (2.10) | (0.54) | 4.21 | 17.06 | 35.10 | 57.71 | 0.42 | 0.95 | 0.97 | 1.87 | 3.12 | 4.24 | 4.34 | 5.35 |
| Margins | ||||||||||||||
| Gross margin | 13.1% | 19.8% | 42.7% | 55.0% | 55.9% | 57.0% | 32.3% | 43.3% | 43.6% | 48.7% | 54.8% | 54.9% | 55.1% | 55.3% |
| Operating margin | -26.5% | -9.3% | 23.1% | 41.1% | 46.6% | 49.0% | 9.8% | 27.0% | 19.0% | 32.5% | 41.3% | 42.2% | 37.7% | 43.3% |
| Net margin | -20.0% | -4.5% | 18.7% | 34.4% | 38.1% | 39.9% | 9.3% | 17.5% | 17.9% | 29.6% | 35.1% | 35.3% | 31.5% | 35.9% |
| YoY | ||||||||||||||
| Revenue | -56% | 14% | 82% | 129% | 86% | 57% | 40% | 103% | 71% | 122% | 99% | 121% | 154% | 136% |
| Gross profit | -82% | 73% | 294% | 195% | 88% | 60% | 638% | 503% | 171% | 247% | 237% | 180% | 221% | 168% |
| OP income | na | na | na | 308% | 111% | 65% | 18% | na | 1176% | na | 734% | 245% | 404% | 214% |
| Net income | na | na | na | 322% | 106% | 64% | 20% | na | 1139% | 2233% | 651% | 346% | 346% | 186% |
| QoQ | ||||||||||||||
| Revenue | 57% | 22% | 0% | 16% | 41% | 35% | 15% | 8% | ||||||
| Gross profit | 63% | 63% | 1% | 30% | 58% | 35% | 15% | 8% | ||||||
| OP income | -849% | 234% | -30% | 99% | 79% | 38% | 3% | 24% | ||||||
| Net income | 418% | 129% | 2% | 92% | 67% | 36% | 2% | 23% | ||||||
| EBITDA | 55% | 81% | -21% | 69% | 52% | 31% | 2% | 21% |
Source: Company data, Goldman Sachs Global Investment Research
Price Target Risks and Methodology - LandMark Optoelectronics Corp.
Valuation: We employ a discounted P/E methodology, applying a 61x target P/E multiple on our 2029E EPS, then discount it back to 2027E at a COE of 10.5% (beta 1.7x, risk free rate 1.6% and market risk premium at 5.1%), to derive our 12-month target price of NT$4,307. Our target P/E multiple is based on the same PEG&M ratio as peers in the photonics supply chain. We are Buy-rated on LandMark.
Key risk: Slower-than-expected SiPh penetration; stronger-than-expected competition; Integrated Device Manufacturers (IDMs) o ff ering Epitaxial (EPI) wafers in-house.
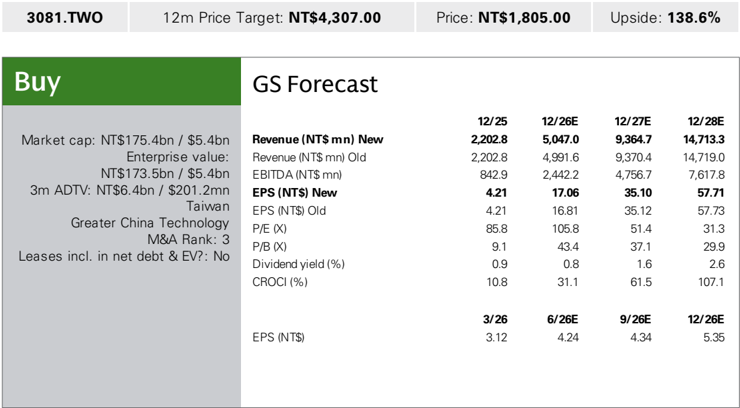
| 3081.TWO | 12m Price Target: NT$4,307.00 | 12m Price Target: NT$4,307.00 | Price: NT$1,805.00 | Upside: 138.6% | Upside: 138.6% | |
|---|---|---|---|---|---|---|
| Buy | Buy | GS Forecast | GS Forecast | GS Forecast | GS Forecast | GS Forecast |
| Revenue (N T$m n ) Ne w | 12/25 12/26E 5 ,04 7 .0 | 12/27E | 12/28E | |||
| Market c ap: NT$175.4 bn / $5.4 bn En terpr is e v a lu e: NT$17 3 .5 bn / $5.4 bn 3m AD T V : NT$ 6 .4 bn / $ 20 1. 2mn Ta iw a n G reater Chin a Te chnology | 2 , 2 0 2 . 8 | 9,3 6 4. 7 | 1 4, 71 3.3 | |||
| Revenue (NT$ mn) Old | 2,202.8 | 4,991.6 | 9,370.4 | 14,719.0 | ||
| EBITDA (NT$ mn) | 842.9 | 2,442.2 | 4,756.7 | 7,617.8 | ||
| E PS (N T$) Ne w | 4. 21 | 17 .0 6 | 3 5 . 1 0 | 57 . 71 | ||
| EPS (NT$) Old | 4.21 | 16.81 | 35.12 | 57.73 | ||
| P/E (X) | 85.8 | 105.8 | 51.4 | 31.3 | ||
| M &A R a n k: 3 | P/B (X) | 9.1 | 43.4 | 37.1 | 29.9 | |
| L ea s e s incl . in n et d e b t & EV? : N o | Dividend yield (%) | 0.9 | 0.8 | 1.6 | 2.6 | |
| CROCI (%) | 10.8 | 31.1 | 61.5 | 107.1 | ||
| 3 /26 | 6/26E | 9 /26E | 12/26E | |||
| EPS (NT$) | 3.12 | 4.24 | 4.34 | 5.35 |
Source: Company data, Goldman Sachs Research estimates, FactSet. Price as of 27 Jul 2026 close.
e92c7a75ab8b4efbba794e6b187208c8
For the exclusive use of KEVINLU@LENOVO.COM