PDF 原檔:報告_GS_緯穎6669_20260809_original.pdf
圖片清單(已驗證 2026-08-10)
| 檔名 | size | 分類 | 親眼所見內容 |
|---|---|---|---|
報告_GS_緯穎6669_20260809_001.png |
45.5KB | 真資料圖 | Exhibit 1:月營收長條圖(NT$m,左軸)+YoY 折線(右軸),Jan-19 至 Jul-26 |
報告_GS_緯穎6669_20260809_002.png |
22KB | (未 Read,<40KB 預設 logo) | — |
報告_GS_緯穎6669_20260809_003.png |
49KB | 真資料圖 | Exhibit 7:12M forward PE ratio 走勢圖,Jan-20 至 2026,標示 +1stv 16.4x/avg 13.2x/-1stv 9.9x 三條水平線 |
報告_GS_緯穎6669_20260809_004.png |
43KB | 真資料圖 | Exhibit 8:緯穎營收依產品別堆疊長條圖(一般伺服器/Amazon ASIC AI server/GPU AI server racks/其他 ASIC AI servers)+GM 折線(右軸),2021-2028E |
報告_GS_緯穎6669_20260809_005.png |
48KB | 真資料圖 | Exhibit 9:Wiwynn QFII 持股比例走勢圖,2017-11 至 2026-08,標示高點 41%(2024)與近期 28% |
報告_GS_緯穎6669_20260809_006.png |
89.5KB | 真資料圖 | Goldman Sachs rating and stock price target history:股價(灰線)與歷次目標價(藍點)沿革圖,2023-2026,評等自 2023-10-03 起維持 Buy |
原始內容
For the exclusive use of KEVINLU@LENOVO.COM
Wiwynn (6669.TW): July revenues sequentially increase; Capex strong increase shows strong AI demand; 2Q26 in line; Buy
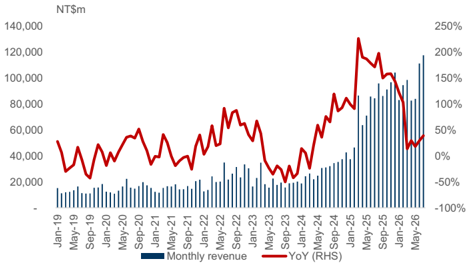
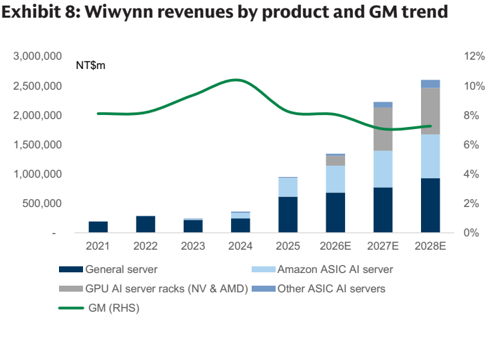
Wiwynn July revenues were in line with our estimates at NT$118bn, driven by solid general servers growth and its major ASIC customers' new generation of ASIC AI servers (air-cooling) entering mass production since June 2026. Looking ahead, we model sequential revenues decline in Aug and Sep, considering the high-base of general servers, while liquid-cooled ASIC AI servers of its major customer, and GPU AI server racks ramp up is in 4Q26E. Nevertheless, the 3Q26 revenues growth would be much stronger than 1Q26 (-5% QoQ), and 2Q26 (+1% QoQ), up to +22% QoQ, and we expect further acceleration to +32% QoQ in 4Q26, driven by AI servers new models ramp up, AI servers expansion from ASIC to GPU, potential ASIC AI servers SKU expansion, and less impact of business model transition from Buy & Sell to Consign for general servers. Wiwynn also announced: (1) 2H26 capex budget of US$942m, implying 2026 capex could be up to NT$40bn (US$1.3bn), (2) CB at NT$15bn (US$500m), and (3) 3-year banks loan of US$1,500m, re fl ecting the strong AI demand that Wiwynn would continue to expand capacity across US, Mexico, and Malaysia, invest in R&D and supplement their working capital. Maintain Buy with TP unchanged at NT$10,000 (20x 2027E PE vs. +34% EPS YoY in 2027-28E).
Exhibit 1: Wiwynn monthly revenues and YoY trend
Source: Company data, Goldman Sachs Global Investment Research
Goldman Sachs does and seeks to do business with companies covered in its research reports. As a result, investors should be aware that the fi rm may have a con fl ict of interest that could a ff ect the objectivity of this report. Investors should consider this report as only a single factor in making their investment decision. For Reg AC certi fi cation and other important disclosures, see the Disclosure Appendix, or go to ed as research
Allen Chang
+852-2978-2930 | allen.k.chang@gs.com Goldman Sachs (Asia) L.L.C.
Verena Jeng
+852-2978-1681 | verena.jeng@gs.com Goldman Sachs (Asia) L.L.C.
Yifan Hu +852-2978-0996 | yifan.hu@gs.com Goldman Sachs (Asia) L.L.C.
e92c7a75ab8b4efbba794e6b187208c8
For the exclusive use of KEVINLU@LENOVO.COM
Exhibit 2: Wiwynn monthly revenues preview
| Jul-26 | Aug-26(E) | Sep-26(E) | Oct-26(E) | Nov-26(E) | Dec-26(E) | 2Q26 | 3Q26E | 4Q26E | |
|---|---|---|---|---|---|---|---|---|---|
| Rev (NT$m) | 117,686 | 113,567 | 109,150 | 118,974 | 136,820 | 194,362 | 278,153 | 340,402 | 450,156 |
| YoY | 39% | 18% | 26% | 30% | 41% | 86% | 26% | 28% | 54% |
| MoM/ QoQ | 6% | -4% | -4% | 9% | 15% | 42% | 1% | 22% | 32% |
| GS estimates (NT$m) | 114,056 | 278,153 | |||||||
| Act vs. GS | 3% | 0% |
Source: Company data, Goldman Sachs Global Investment Research
2Q26 results in line: Revenues is pre-announced; GM increased to 9.3%, better than our and Bloomberg consensus of 8.5% / 8.4%, leading GP to +23% QoQ, 9% / 10% ahead of our / Bloomberg consensus. We attribute the higher GM to (1) general servers turning to consign business models from Buy & Sell, (2) better product mix, with general servers revenues contribution over 50%, and (3) more NRE fees given major customer's new ASIC AI servers. Nevertheless, opex ratio up to 2%, higher than our / Bloomberg consensus of 1.3% / 1.5%, leading OP income to +16% QoQ, or 1% / 4% ahead of our / Bloomberg consensus, largely in line. The higher opex ratio is mainly on R&D investments, as the company's expansion toward AI servers, with potential ASIC AI servers SKUs expansion, and AI servers expanding from ASIC-powered to GPU-powered.
Exhibit 3: Wiwynn 2Q26 results snapshot
| NT m | 2Q25 | 1Q26 | 2Q26 | QoQ | YoY | GSe | Act / | GS BBG | Act/Cons. |
|---|---|---|---|---|---|---|---|---|---|
| Revenue | 220,744 | 276,508 | 278,153 | 1% | 26% | 278,153 | 0% | 281,009 | -1% |
| GP | 18,943 | 20,881 | 25,763 | 23% | 36% | 23,607 | 9% | 23,504 | 10% |
| OP | 15,899 | 17,458 | 20,218 | 16% | 27% | 19,958 | 1% | 19,354 | 4% |
| Net income | 12,122 | 14,114 | 14,969 | 6% | 23% | 14,742 | 2% | 14,718 | 2% |
| Margins | |||||||||
| GM | 8.6% | 7.6% | 9.3% | 8.5% | 8.4% | ||||
| OPM | 7.2% | 6.3% | 7.3% | 7.2% | 6.9% | ||||
| NM | 5.5% | 5.1% | 5.4% | 5.3% | 5.2% | ||||
| Opex ratio | 1.4% | 1.2% | 2.0% | 1.3% | 1.5% |
Source: Company data, Goldman Sachs Global Investment Research
Earnings revision: We factor in 2Q26 results and July revenues, and change our net income by -2% / +0% / +4% in 2026-28E. The change is mainly on revenues: (1) we cut 2026E revenues by 6%, re fl ecting the general servers turning to consign business model, general servers strong pull in in 1H26, and most new products (e.g. GPU AI server racks, the new liquid-cooled ASIC AI servers) are in 4Q26, (2) we raise 2027-28E revenues by 2% / 5%, re fl ecting the ramp up of new AI server products, and the company's potential of new ASIC AI servers customers expansion.
Exhibit 4: Earnings revision
| 2026E | 2026E | 2026E | 2027E | 2027E | 2027E | 2028E | 2028E | 2028E | |
|---|---|---|---|---|---|---|---|---|---|
| NT m | Old | New | Chg | Old | New | Chg | Old | New | Chg |
| Revenue | 1,424,274 | 1,345,219 | -6% | 2,173,318 | 2,225,997 | 2% | 2,477,005 | 2,602,185 | 5% |
| GP | 109,766 | 108,262 | -1% | 153,893 | 157,326 | 2% | 178,316 | 188,908 | 6% |
| OP | 89,209 | 87,927 | -1% | 126,022 | 130,347 | 3% | 149,720 | 160,271 | 7% |
| Net income | 67,519 | 66,155 | -2% | 96,418 | 96,461 | 0% | 113,531 | 117,637 | 4% |
| Margins | |||||||||
| GM | 7.7% | 8.0% | 7.1% | 7.1% | 7.2% | 7.3% | |||
| OPM | 6.3% | 6.5% | 5.8% | 5.9% | 6.0% | 6.2% | |||
| NM | 4.7% | 4.9% | 4.4% | 4.3% | 4.6% | 4.5% |
Source: Company data, Goldman Sachs Global Investment Research
e92c7a75ab8b4efbba794e6b187208c8
For the exclusive use of KEVINLU@LENOVO.COM
Exhibit 5: Wiwynn P&L
| (NT$ m) | 1Q25 | 2Q25 | 3Q25 | 4Q25 | 1Q26 | 2Q26 | 3Q26E | 4Q26E | 2023 | 2024 | 2025 | 2026E | 2027E | 2028E |
|---|---|---|---|---|---|---|---|---|---|---|---|---|---|---|
| Revenue | 170,655 | 220,744 | 266,824 | 292,440 | 276,508 | 278,153 | 340,402 | 450,156 | 241,901 | 360,541 | 950,663 | 1,345,219 | 2,225,997 | 2,602,185 |
| Gross profit | 14,849 | 18,943 | 23,532 | 21,129 | 20,881 | 25,763 | 32,228 | 29,390 | 22,657 | 37,400 | 78,454 | 108,262 | 157,326 | 188,908 |
| Operating expense | (1,290) | (1,195) | (1,134) | (1,499) | (1,375) | (1,465) | (1,498) | (1,688) | (6,787) | (9,301) | (14,537) | (20,335) | (26,978) | (28,637) |
| Operating income | 11,981 | 15,899 | 19,572 | 16,466 | 17,458 | 20,218 | 26,645 | 23,605 | 15,871 | 28,099 | 63,918 | 87,927 | 130,347 | 160,271 |
| Pre tax profit | 12,523 | 15,720 | 20,351 | 17,458 | 17,934 | 18,974 | 25,818 | 22,763 | 15,444 | 28,830 | 66,052 | 85,489 | 126,923 | 156,850 |
| Net income | 9,793 | 12,122 | 15,411 | 13,792 | 14,114 | 14,969 | 19,544 | 17,528 | 12,044 | 22,776 | 51,118 | 66,155 | 96,461 | 117,637 |
| EPS (NT$) | 52.70 | 65.23 | 82.93 | 74.21 | 75.95 | 80.43 | 105.01 | 94.18 | 68.88 | 127.29 | 275.06 | 355.57 | 518.29 | 632.07 |
| Margins / ratio | ||||||||||||||
| Gross margin | 8.7% | 8.6% | 8.8% | 7.2% | 7.6% | 9.3% | 9.5% | 6.5% | 9.4% | 10.4% | 8.3% | 8.0% | 7.1% | 7.3% |
| Opex ratio | -1.7% | -1.4% | -1.5% | -1.6% | -1.2% | -2.0% | -1.6% | -1.3% | -2.8% | -2.6% | -1.5% | -1.5% | -1.2% | -1.1% |
| Operating margin | 7.0% | 7.2% | 7.3% | 5.6% | 6.3% | 7.3% | 7.8% | 5.2% | 6.6% | 7.8% | 6.7% | 6.5% | 5.9% | 6.2% |
| Net margin | 5.7% | 5.5% | 5.8% | 4.7% | 5.1% | 5.4% | 5.7% | 3.9% | 5.0% | 6.3% | 5.4% | 4.9% | 4.3% | 4.5% |
| QoQ | ||||||||||||||
| Revenue | 48% | 29% | 21% | 10% | -5% | 1% | 22% | 32% | ||||||
| Gross profit | 37% | 28% | 24% | -10% | -1% | 23% | 25% | -9% | ||||||
| Operating income | 47% | 33% | 23% | -16% | 6% | 16% | 32% | -11% | ||||||
| Pre tax profit | 43% | 26% | 29% | -14% | 3% | 6% | 36% | -12% | ||||||
| Net income | 39% | 24% | 27% | -11% | 2% | 6% | 31% | -10% | ||||||
| EPS | 35% | 24% | 27% | -11% | 2% | 6% | 31% | -10% | ||||||
| YoY | ||||||||||||||
| Revenue | 145% | 185% | 173% | 153% | 62% | 26% | 28% | 54% | -17% | 49% | 164% | 42% | 65% | 17% |
| Gross profit | 93% | 126% | 126% | 94% | 41% | 36% | 37% | 39% | -6% | 65% | 110% | 38% | 45% | 20% |
| Operating income | 105% | 156% | 148% | 103% | 46% | 27% | 36% | 43% | -14% | 77% | 127% | 38% | 48% | 23% |
| Pre tax profit | 112% | 153% | 156% | 99% | 43% | 21% | 27% | 30% | -14% | 87% | 129% | 29% | 48% | 24% |
| Net income | 108% | 158% | 144% | 96% | 44% | 23% | 27% | 27% | -15% | 89% | 124% | 29% | 46% | 22% |
| EPS | 96% | 143% | 141% | 89% | 44% | 23% | 27% | 27% | -15% | 85% | 116% | 29% | 46% | 22% |
Source: Company data, Goldman Sachs Global Investment Research
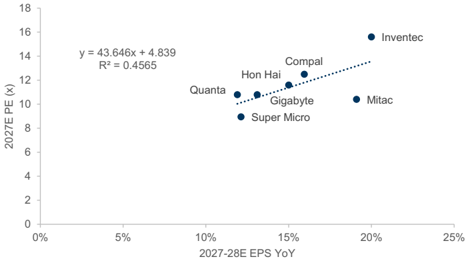
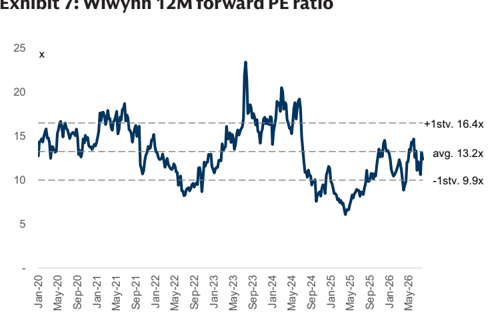
Valuation: We continue to derive our 12M TP based on near-term P/E, and our 2027E target P/E is unchanged at 20.0x, which is still derived from the peers' correlation of forward trading P/E and EPS growth. Our 12M TP is unchanged at NT$10,000. Our target P/E of 20x is above the company's historical avg.+1stv. forward trading P/E, re fl ecting our positive view on Wiwynn's leading position in ASIC AI server ODM along with product expansion (from ASIC to GPU AI servers) and customers expansion. Maintain Buy.
Exhibit 6: Wiwynn peers 2027E PE vs. 2027-28E EPS YoY
Source: Company data, Goldman Sachs Global Investment Research
Source: Company data, Goldman Sachs Global Investment Research, Bloomberg
e92c7a75ab8b4efbba794e6b187208c8
For the exclusive use of KEVINLU@LENOVO.COM
Source: Company data, Goldman Sachs Global Investment Research
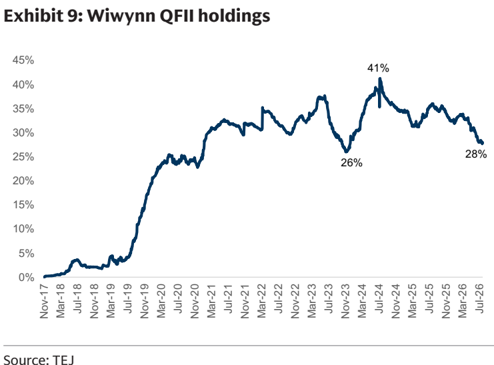
Source: TEJ
Price Target Risks and Methodology - Wiwynn
We are Buy-rated on Wiwynn with a 12-month TP of NT$10,000. Our target price is based on 20x 2027E P/E, which is derived from PC/server peers' EPS growth vs. P/E multiple correlation. We see EPS growth as a major factor for the stock's performance.
Key downside risks: 1) weaker-than-expected AI server demand growth; 2) slower-than-expected recovery in general server demand; and 3) more severe competition in the server ODM market.
| 6669.TW 12m Price Target: | NT$10,000.00 | Price: NT$6,100.00 | Price: NT$6,100.00 | Upside: 63.9% | Upside: 63.9% |
|---|---|---|---|---|---|
| Buy | GS Forecast | ||||
| Market c ap: NT$1.2tr / $3 6 . 4bn | Reven u e (NT$m n ) N e w Revenue (NT$ mn) Old EBITDA (NT$ mn) E PS(NT$) N e w EPS (NT$) Old P/E (X) P/B (X) Dividend yield (%) CROCI (%) | 12/25 9 5 0, 66 3.3 950,663.3 66,607.9 275 .0 6 275.06 10.5 4.1 5.3 60.3 | 12/26E 1 ,34 5 , 218 . 8 1,424,274.3 91,824.5 3 55 . 57 363.32 17.2 6.9 3.3 50.8 | 12/27E 2 , 225 ,99 7 .4 2,173,318.1 140,591.9 518 . 2 9 518.82 11.8 5.3 4.8 57.9 12/26E | 12/28E 2 , 6 0 2 , 185 .3 2,477,005.3 175,718.2 6 3 2 .0 7 610.90 9.7 4.2 5.8 53.8 |
| NT$1.2tr / $3 6 . 7bn 3 m AD T V : NT$1 0 . 6bn / $33 4 .1 mn n | |||||
| En terpr is e v a lu e: | |||||
| Ta iw a | |||||
| G reater Chin a Te chnology | |||||
| M &A R a n k: 3 | |||||
| L ea s e s incl . in n et d e b t & EV? : Y e s | |||||
| 6/26 | 9 /26E | 3 /27E | |||
| EPS (NT$) 80.43 | 105.01 | 94.18 | 120.68 |
Source: Company data, Goldman Sachs Research estimates, FactSet. Price as of 7 Aug 2026 close.
e92c7a75ab8b4efbba794e6b187208c8
For the exclusive use of KEVINLU@LENOVO.COM