PDF 原檔:報告_GS_穎崴6515_20260715_original.pdf
重複來源提醒
inbox 同時收到 Winway_Technology_Co_6515_TW_June_earnings_miss_driven_by_product.pdf,經比對內容(同分析師 Evelyn Yu / Ryan Huang、同日期 2026-07-15、同標題、同 EPS/TP 數字)判定為同一份 Goldman Sachs 報告的重複檔案(PDF 匯出品質不同、頁面順序略異),非獨立報告。已將該重複檔移至 backups/2026-07-17_inbox_dup/,不另建 Raw_data 頁。
圖片清單(已驗證 2026-07-17)
| 檔名 | size | 分類 | 親眼所見內容 |
|---|---|---|---|
260715_gs_winway_009.png |
76KB | 真資料圖 | Goldman Sachs 對穎崴(6515.TW)歷次評等與目標價沿革圖:股價(左軸)自 2023 起自 NT$2,000 以下升破 NT$14,000;目標價序列標示 1465→1480→1500→2550→2600→4500→6300→(2026 年中新高點,未標數字,對應本次下修前 TP 15,000);評等自 NA 轉為 B(Buy,May 25 起);資料來源標註 as of 6/30/2026、分析師 Evelyn Yu |
260715_gs_winway_003.png |
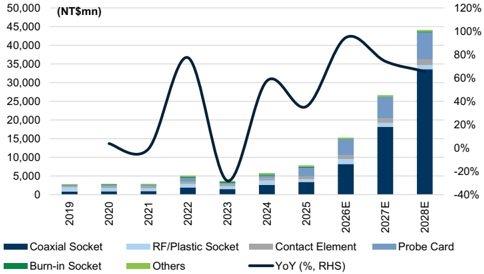
46KB | 真資料圖 | Exhibit 1:Winway 營收成長展望,堆疊柱狀圖分 Coaxial Socket/RF-Plastic Socket/Contact Element/Probe Card/Burn-in Socket/Others,2019-2028E,右軸 YoY% 折線 2026E-2028E 明顯上揚 |
260715_gs_winway_007.png |
43KB | 真資料圖 | Exhibit 7:Forward P/B 帶狀圖,NT$股價 2020/07-2026/07,標示 15x/20x/24x(原文序列另含 6x/11x)本益比帶,2026 年股價急升穿越最高倍數帶 |
260715_gs_winway_006.png |
43KB | 真資料圖 | Exhibit 6:Forward P/E 帶狀圖,同期間股價與 40x/50x/60x/70x/80x 本益比帶對照 |
260715_gs_winway_008.png |
33KB | 真資料圖 | Exhibit 8:P/B(右軸柱狀)vs ROE(左軸折線)2020/07-2026/07,2026 年 ROE 與 P/B 同步急升 |
260715_gs_winway_005.png |
39KB | 真資料圖 | Exhibit 5:Taiex(左軸,灰線)vs Winway 股價(右軸 NT$,深藍線)2020/07-2026/07,Winway 2025 下半年起明顯跑贏大盤 |
260715_gs_winway_002.png |
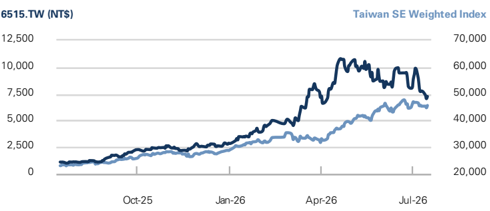
30KB | 真資料圖 | Price Performance:6515.TW(NT$,左軸深藍線)vs Taiwan SE Weighted Index(右軸淺藍線)2025/09-2026/07 走勢對照 |
260715_gs_winway_004.png |
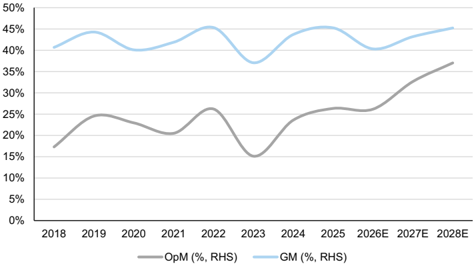
27KB | 真資料圖 | Exhibit 2:Winway 毛利率趨勢,GM%(淺藍線,右軸)與 OpM%(灰線)2018-2028E,2023 年為谷底、2026E 起緩步回升 |
260715_gs_winway_001.png |
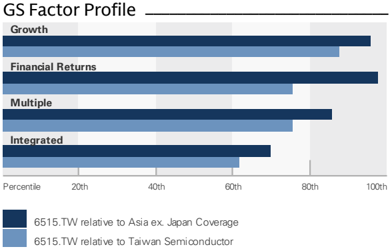
21KB | 真資料圖 | GS Factor Profile:Growth/Financial Returns/Multiple/Integrated 四項百分位橫條圖,對比 Asia ex Japan Coverage(深藍)與 Taiwan Semiconductor(淺藍)分組 |
分類只有三類:
真資料圖/裝飾·logo·banner/文字卡。<40KB 未 Read 者免列(本報告全數 9 張皆 ≥21KB 且已逐張 Read)。
原始內容
For the exclusive use of KEVINLU@LENOVO.COM
Winway Technology Co. (6515.TW)
June earnings miss driven by product mix; favorable long term TAM expansion intact; reiterate Buy
6515.TW
12m Pri c e Target:
NT$13,000.00
Pri
c
e:
NT$7,255.00
Upside:
79.2%
June preliminary numbers implied 2Q26 earnings miss
WinWay reported June preliminary EPS of NT$8.61; based on the April-June revenue allocation, we estimate this likely implies c.12% of 2Q26E EPS miss to our forecast, which we believe is mainly due to lower GM driven by weaker product mix. We now revise down our 2Q26E GM to 38.6% (vs. 43.7% previously) to re fl ect the higher contribution from lower-GM MEMS probe card business. While MEMS continues to represent an important long-term growth driver, we believe its current GM remains below the corporate average, creating near-term margin dilution.
Nevertheless, we now expect 2Q26E to be its GM trough, and expect pro fi tability to improve sequentially from 3Q26 onward as higher-margin coaxial socket shipments gradually increase driven by new project ramp. We now model GM to recover to 39.3%/40.8% in 3Q26E/4Q26E, before further improving to 43.2%/45.2% in 2027E/2028E. Overall, we now lower our 2026-28E EPS by 8-13% to NT$95.94/197.73/369.29, mainly re fl ecting lower GM assumptions. Net net, we lower our 12m TP to NT$13,000 from NT$15,000 (based on 40x of 2028E discounted P/E); with c.79% implied upside, we reiterate our Buy rating.
Next gen AI platform migration continues to drive structural content growth
Despite the near-term earnings adjustment, our positive view towards its long-term investment thesis remains unchanged. We continue to view WinWay as one of the most bene fi ted AI plays and an underappreciated CPU play within the semiconductor supply chain, with meaningful exposure to AI GPU/AI ASIC, and both x86 and Arm-based CPUs. To recall, management previously guided to a 50-60% annual TAM expansion, which may still be too conservative when considering both content growth and volume growth.
BUY
Evelyn Yu
+886(2)2730-4187 | evelyn.yu@gs.com Goldman Sachs (Asia) L.L.C., Taipei Branch
Ryan Huang, CFA
+886(2)2730-4084 | ryan.huang@gs.com Goldman Sachs (Asia) L.L.C., Taipei Branch
Key Data _____________________________________
Market cap: NT$248.8bn / $7.7bn
Enterprise value: NT$249.4bn / $7.7bn
3m ADTV: NT$3.8bn / $118.8mn
Taiwan
Taiwan Semiconductor
M&A Rank: 3
Leases incl. in net debt & EV?: Yes
| GS Forecast | 12/25 | __________ 12/26E | 12/27E | 12/28E |
|---|---|---|---|---|
| Revenue(NT$mn) New | 7,857.2 | 15,288.8 | 26,645.8 | 44,122.1 |
| Revenue (NT$ mn) Old | 7,857.2 | 14,910.2 | 26,733.5 | 44,524.3 |
| EBITDA (NT$ mn) | 2,327.7 | 4,292.7 | 9,098.5 | 16,860.2 |
| EPS(NT$) New | 46.96 | 95.94 | 197.73 | 369.29 |
| EPS (NT$) Old | 46.96 | 103.68 | 224.10 | 426.09 |
| P/E (X) | 32.5 | 75.6 | 36.7 | 19.6 |
| P/B (X) | 8.5 | 32.8 | 21.0 | 12.8 |
| Dividend yield (%) | 2.3 | 1.0 | 2.0 | 3.8 |
| CROCI (%) | 31.8 | 26.1 | 70.1 | 102.7 |
| 3/26 | 6/26E | 9/26E | 12/26E | |
| EPS (NT$) | 19.54 | 19.74 | 26.16 | 30.50 |
Source: Company data, Goldman Sachs Research estimates. See disclosures for details.
Goldman Sachs does and seeks to do business with companies covered in its research reports. As a result, investors should be aware that the fi rm may have a con fl ict of interest that could a ff ect the objectivity of this report. Investors should consider this report as only a single factor in making their investment decision. For Reg AC certi fi cation and other important disclosures, see the Disclosure Appendix, or go to www.gs.com/research/hedge.html. Analysts employed by non-US a ffi liates are not registered/quali fi ed as research analysts with FINRA in the U.S.
e92c7a75ab8b4efbba794e6b187208c8
For the exclusive use of KEVINLU@LENOVO.COM
BUY
Winway Technology Co. (6515.TW)
Rating since May 25, 2025
Ratios & Valuation __________________________________________
| 12/25 | 12/26E | 12/27E | 12/28E | |
|---|---|---|---|---|
| P/E (X) | 32.5 | 75.6 | 36.7 | 19.6 |
| P/B (X) | 8.5 | 32.8 | 21.0 | 12.8 |
| FCF yield (%) | 2.8 | 0.1 | 2.0 | 4.1 |
| EV/EBITDAR (X) | 22.3 | 60.6 | 28.3 | 15.0 |
| EV/EBITDA (excl. leases) (X) | 22.3 | 60.6 | 28.3 | 15.0 |
| CROCI (%) | 31.8 | 26.1 | 70.1 | 102.7 |
| ROE (%) | 27.9 | 47.6 | 69.2 | 80.4 |
| Net debt/equity (%) | (40.2) | 7.3 | (16.5) | (35.7) |
| Net debt/equity (excl. leases) (%) | (40.2) | 7.3 | (16.5) | (35.7) |
| I n te r est c ov e r (X) | 781.0 | 185.9 | 478.9 | 882.9 |
| Days i nv e n t or y o utst , sales | 37.2 | 27.4 | 25.5 | 25.7 |
| Recei v able days | 92.7 | 74.1 | 73.9 | 77.3 |
| Days p ayable o utsta n di ng | 138.4 | 116.0 | 125.9 | 139.9 |
| DuP on t ROE (%) | 26.0 | 43.0 | 56.7 | 64.8 |
| Tu rnov e r (X) | 0.9 | 1.0 | 1.2 | 1.2 |
| L e v e r a g e (X) | 1.4 | 2.0 | 1.8 | 1.8 |
| Gro ss cas h i nv ested (ex cas h ) (NT $ ) | 4 , 744.2 | 9 , 469.3 | 11 , 721.7 | 14 , 935.3 |
| A v e r a g e ca p ital e mp l o yed (NT $ ) | 4 , 207.2 | 6 , 205.4 | 9 , 486.9 | 11 , 759.5 |
| BVP S (NT $ ) | 178.83 | 221.25 | 346.01 | 565.24 |
Growth & Margins (%) ______________________________________
| 12/25 | 12/26E | 12/27E | 12/28E | |
|---|---|---|---|---|
| Total revenue growth | 35 . 5 | 94 . 6 | 7 4 . 3 | 65 . 6 |
| E BITDA growth | 45 . 0 | 84 . 4 | 112 . 0 | 85 . 3 |
| E PS growth | 36 . 5 | 104 . 3 | 106 . 1 | 86 . 8 |
| DPS growth | 36 . 4 | 104 . 3 | 106 . 1 | 86 . 8 |
| E BIT margin | 26 . 3 | 26 . 2 | 32 .7 | 3 7. 0 |
| E BITDA margin | 29 . 6 | 28 . 1 | 34 . 1 | 38 . 2 |
| Net income margin | 21 . 3 | 22 . 4 | 26 . 5 | 29 . 9 |
Price Performance __________________________________________
3m
(20.0)%
(35.6)%
6m
110.3%
1
2m
553.6%
42.0%
227.1%
Source: FactSet. Price as of 15 Jul 2026 close.
Absolute
Rel. to the Taiwan SE Weighted Index
| Income Statement (NT$ mn) | 12/26E | 12/27E | ________ 12/28E | |
|---|---|---|---|---|
| To t a l r e v e nu e | 12/25 7 ,857.2 | 15,288.8 | 26,645.8 | 44,122.1 |
| Cost of goods sold | (4,300.7) | (9,125.0) | (15,136.2) | (24,165.0) |
| SG&A | (1,070.8) | (1,493.6) | (1,898.8) | (2,424.8) |
| R&D | (416.1) | (670.0) | (909.6) | (1,195.7) |
| Other operating inc./(exp.) | -- | -- | -- | -- |
| E BITDA | 2 ,3 27 . 7 | 4, 2 9 2 . 7 | 9,09 8 . 5 | 16 , 86 0. 2 |
| Depreciation& amortization | (258.1) | (292.5) | (397.3) | (523.6) |
| E BIT | 2 ,0 6 9. 6 | 4,000. 2 | 8 , 7 0 1 . 2 | 16 ,33 6 . 6 |
| Net interest inc./(exp.) | 45.1 | 39.3 | 41.7 | 41.5 |
| Income/(loss) from associates Pre-tax pr ofi t | -- 2 ,0 61 . 2 | -- 4, 2 39.0 | -- 8 , 7 4 2 .9 | -- 16 ,3 78 . 1 |
| Provision for taxes | (388.3) | (809.2) | (1,674.3) | (3,176.3) |
| Minority interest | -- | -- | -- | -- |
| Preferred dividends | -- | -- | -- | -- |
| N et inc . ( pre-ex c ept ion a ls) | , 672 .9 | 3,4 2 9. 8 | 7 ,0 68 . 5 | 1 3, 2 0 1 .9 |
| Post-tax exceptionals | 1 -- | -- | -- | -- |
| N et inc . ( p os t-ex c ept ion a ls) | 1 , 672 .9 | 3,4 2 9. 8 | 7 ,0 68 . 5 | 1 3, 2 0 1 .9 |
| E P S(b a sic , pre-ex c ept ) (N T $) | 4 6 .9 6 | 9 5 .94 | 1 9 7 . 7 3 | 3 6 9. 2 9 |
| E P S(dilu te d , pre-ex c ept ) (N T $) | 4 6 .9 6 | 9 5 .94 | 1 9 7 . 7 3 | 3 6 9. 2 9 |
| E P S(b a sic , p os t-ex c ept ) (N T $) | 4 6 .9 6 | 9 5 .94 | 1 9 7 . 7 3 | 3 6 9. 2 9 |
| E P S(dilu te d , p os t-ex c ept ) (N T $) | 4 6 .9 6 | 9 5 .94 | 1 9 7 . 7 3 | 3 6 9. 2 9 |
| DPS (NT$) | 35.22 | 71.96 | 148.29 | 276.97 |
| Div. payout ratio (%) | 75.0 | 75.0 | 75.0 | 75.0 |
| Balance Sheet (NT$ mn) | 12/25 2,593.9 | ______ 12/26E 2,240.9 | 12/27E 4,881.9 | 12/28E 10,092.3 |
| C a sh& c a sh equiv a lents ble | 2,151.9 | 6,727.2 | 11,952.0 | |
| Accounts receiv a | 4,058.0 | 3,937.2 | ||
| Inventory Other current a ssets | 842.5 838.2 | 1,449.1 4,170.9 | 2,274.2 4,170.9 | 4,170.9 |
| Total current assets | 6 ,4 26. 3 | 11 ,9 18. 9 | 18 ,0 5 4 .2 | 30, 152.5 |
| Net PP&E | 2,206.0 | 2,933.1 | 3,991.4 | 5,214.8 |
| Net int a ngibles | 51.1 | 66.3 | 87.6 | 104.9 |
| Tot a l investments | 5.0 | 47.3 | 47.3 | 47.3 |
| Other long-term a ssets | 355.7 | 636.7 | 636.7 22 , 817.2 | 636.7 3 6 , 156.2 |
| Total assets Accounts p a y a ble | 9,044 .2 1,914.2 | 15 , 6 0 2.2 3,883.3 | 6,562.1 | 11,960.7 -- |
| Short-term debt | -- | -- | ||
| Short-term le a se li a bilities | -- | -- | -- | |
| Other current li a bilities | -- 610.0 | -- 838.3 | 878.3 | 918.3 |
| Total current liabilities | 2 , 52 4 .2 | 4, 721.6 | 7 ,440 . 4 | 12 , 878. 9 |
| Long-term debt | 0.0 | 2,826.9 | 2,826.9 | 2,826.9 |
| Long-term le a se li a bilities | -- | -- | -- | -- |
| Other long-term li a bilities | 74.7 | 80.4 | 80.4 | 80.4 2 ,90 7. 3 |
| Total long-term liabilities | 7 4 .7 | 2 ,90 7. 3 | 2 ,90 7. 3 | |
| Total liabilities Preferred sh a res | 2 , 5 9 8. 9 -- | 7 , 628. 9 -- | 1 0,34 7.7 -- | 15 , 786.2 -- |
| Tot a l commonequity Minority interest | 6,445.3 -- | 7,973.4 -- | 12,469.5 -- 22 , 817.2 | 20,370.0 -- |
| Total liabilities &equity Net debt, a djusted | 9,044 .2 | 15 , 6 0 2.2 | 3 6 , 156.2 (7,265.4) | |
| (2,593.9) | 586.0 | (2,055.0) | ||
| Cash Flow (NT$ mn) | __________ 12/25 | 12/26E | 12/27E | 12/28E 13, 2 |
| Net income D&Aadd-back | 1,67 2 .9 2 58.1 | 3,4 2 9.8 2 9 2 | 7,068.5 397.3 | 01.9 5 2 |
| Minority interest add-back | -- | .5 -- | -- | 3.6 -- |
| Net (inc)/dec working capital | 166.1 ( 2 | (543.6) (1,837.0) | (815.5) -- | (1,489.3) -- |
| Other operating cash flow Cash flow fro m operations | 94.3) 1 , 8 0 2 . 8 | 1 , 3 4 1 . | 6 , 65 0. | 12 , 236 . 1 |
| 6 | 3 (1,436.9) | (1,7 2 4.3) | ||
| Capital expenditures Acquisitions | ( 2 80.0) -- | (1,197.4) -- | -- | -- |
| Divestitures | -- | -- | -- | |
| 2 . 2 | -- 2 | -- | ||
| Others | 1,00 722 . 2 | (3,140. ) (4, 337 . 6 ) | -- 36 | 4. 3 ) |
| Cash flow fro m investing | ( 1 ,4 .9) | ( 1 , 72 | ||
| Repayment of lease liabilities | -- | -- 54.7) | -- ( 2 ,57 2 .4) | -- (5,301.4) -- |
| Dividends paid(common& pref) | (890.0) (150.7) | (1, 2 | ||
| Inc/(dec) in debt Other financing flows | (14.3) | 3,896.0 1.7 | -- 0.0 | 0.0 |
| cash Cash flow fro m financing | 1 ,0 55 . 1 ) | 2 , 6 4 3 .0 | ( 2 , 572 .4) | 5 , 3 0 1 .4) |
| Total cash flow | ( 1 ,4 6 9.9 | ( 352 .9) | 2 , 6 4 1 | ( 5 , 21 0.4 |
| Free cash flow | 1,5 22 .8 | 144. 2 | .0 5, 2 13.4 | 10,511.8 |
Source: Company data, Goldman Sachs Research estimates.
e92c7a75ab8b4efbba794e6b187208c8
For the exclusive use of KEVINLU@LENOVO.COM
We believe the key driver remains continued AI platform migration, which is translating into signi fi cantly higher socket content through increasing pin counts. Across several major next-generation CPU, AI GPU and AI ASIC projects that we monitor , we are already seeing pin-count increases of at least 30% for one of its key AI GPU customers and with potentially doubling pin counts for another AI ASIC project.
Meanwhile, we believe HyperSocket adoption is progressing well during the current NPI (new product introduction) cycle, with 50%+ of new customer programs expected to adopt the new architecture . Given HyperSocket carries c.20-30% higher ASP vs. coaxial sockets, we believe this should provide another structural content expansion opportunity over the next several years.
Capacity expansion plan intact to support long-term AI demand
WinWay is on track to grow its capacity aggressively as current customer demand continues to signi fi cantly exceed available industry supply while AI/HPC testing complexity continues to increase. Speci fi cally, WinWay is aiming to increase its spring-probe pin capacity from 3.5mn pins per month by end-2025, to 9mn by end-2026, and further expand to 14mn pins in 1H27, representing 157% YoY capacity growth in 2026E followed by another 56% increase into 1H27. We now forecast 94.6%/74.3%/65.6% revenue YoY growth in 2026-28E , supported by continued AI/HPC socket content expansion, stronger CPU demand driven by agentic AI, increasing HyperSocket adoption, and ongoing capacity expansion. We therefore continue to view the current earnings reset as temporary rather than structural and remain constructive on the company's long-term earnings trajectory.
Recent share price correction has created a more attractive risk-reward
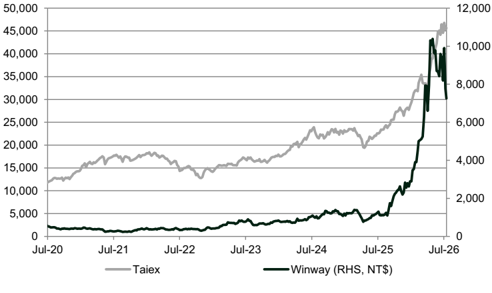
We believe the recent share price weakness has created an opportunity to add to positions. WinWay's share price has corrected by c.24% (vs TAIEX +3%) over the past 1 month. We believe the correction has been driven primarily by two factors, including 1) investor sentiment has weakened following concerns over a potential delay in US AI GPU customer's upcoming AI platform, given our estimate that the customer contributes c.40-50% of WinWay's total revenue, and 2) heightened market volatility has led investors to reduce exposure to high-beta, high-multiple AI names, a trend we have also observed across several of our preferred growth stocks, including Aspeed (-25%) and Hon Precision (-7%), etc.
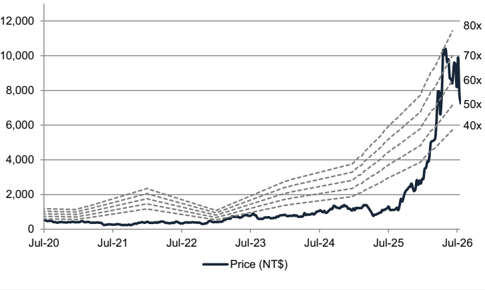
Following the recent correction, the stock is now trading at only 36.6x 2027E P/E and 19.6x 2028E P/E, vs. an average of 50x over the past 1 year, and an average of 40x since the AI boom starting 2024. With an even stronger revenue CAGR of 70% from 2026-2028E vs. an avg growth of 47% during 2024-2025E, we believe the current valuation does not fully re fl ect the company's multi-year growth outlook potential. We therefore view the current valuation as continuing to o ff er an attractive risk-reward pro fi le.
e92c7a75ab8b4efbba794e6b187208c8
For the exclusive use of KEVINLU@LENOVO.COM
Exhibit 1: Winway's revenue growth outlook
Source: Company data, Goldman Sachs Global Investment Research
Exhibit 2: WinWay's margin trend
Source: Company data, Goldman Sachs Global Investment Research
e92c7a75ab8b4efbba794e6b187208c8
For the exclusive use of KEVINLU@LENOVO.COM
Earnings changes, valuation and risks
Forecast changes
We incorporate the June preliminary results into our model and revise down our 2026E/2027E/2028E EPS by 7.5%/11.8%/13.3% mainly as we factor in 1) lower June preliminary results implied 2Q26 earnings, and 2) lower GM assumptions to re fl ect lower-GM MEMS product ramp.
Exhibit 3: Earnings revisions
| 2026E | 2026E | 2026E | 2027E | 2027E | 2027E | 2028E | 2028E | 2028E | |
|---|---|---|---|---|---|---|---|---|---|
| (NT$mn) | Old | New | Diff (%) | Old | New | Diff (%) | Old | New | Diff (%) |
| Revenue | 14,910 | 15,289 | 2.5% | 26,733 | 26,646 | -0.3% | 44,524 | 44,122 | -0.9% |
| Gross profit | 6,544 | 6,164 | -5.8% | 12,667 | 11,510 | -9.1% | 22,499 | 19,957 | -11.3% |
| Op. income | 4,431 | 4,000 | -9.7% | 9,863 | 8,701 | -11.8% | 18,847 | 16,337 | -13.3% |
| Net income | 3,706 | 3,430 | -7.5% | 8,012 | 7,069 | -11.8% | 15,233 | 13,202 | -13.3% |
| EPS (NT$) | 103.68 | 95.94 | -7.5% | 224.10 | 197.73 | -11.8% | 426.09 | 369.29 | -13.3% |
| GM | 43.9% | 40.3% | -3.6% | 47.4% | 43.2% | -4.2% | 50.5% | 45.2% | -5.3% |
| OpM | 29.7% | 26.2% | -3.6% | 36.9% | 32.7% | -4.2% | 42.3% | 37.0% | -5.3% |
| NM | 24.9% | 22.4% | -2.4% | 30.0% | 26.5% | -3.4% | 34.2% | 29.9% | -4.3% |
| 2Q26E | 2Q26E | 2Q26E | 3Q26E | 3Q26E | 3Q26E | 1Q26E | 1Q26E | 1Q26E | |
|---|---|---|---|---|---|---|---|---|---|
| (NT$mn) | Old | New | Diff (%) | Old | New | Diff (%) | Old | New | Diff (%) |
| Revenue | 3,640 | 3,523 | -3.2% | 4,038 | 4,262 | 5.5% | 2,980 | 2,980 | 0.0% |
| Gross profit | 1,589 | 1,358 | -14.5% | 1,783 | 1,676 | -6.0% | 1,282 | 1,282 | 0.0% |
| Op. income | 1,062 | 834 | -21.4% | 1,244 | 1,117 | -10.2% | 777 | 777 | 0.0% |
| Net income | 844 | 706 | -16.4% | 1,015 | 935 | -7.9% | 699 | 699 | 0.0% |
| EPS (NT$) | 23.61 | 19.74 | -16.4% | 28.39 | 26.16 | -7.9% | 19.54 | 19.54 | 0.0% |
| GM | 43.7% | 38.6% | -5.1% | 44.1% | 39.3% | -4.8% | 43.0% | 43.0% | 0.0% |
| OpM | 29.2% | 23.7% | -5.5% | 30.8% | 26.2% | -4.6% | 26.1% | 26.1% | 0.0% |
| NM | 23.2% | 20.0% | -3.2% | 25.1% | 21.9% | -3.2% | 23.4% | 23.4% | 0.0% |
Source: Company data, Goldman Sachs Global Investment Research
Maintain Buy with TP raised to NT$13,000 from NT$13,000
As a result of our downward earnings revisions, we lower our 12-month TP to NT$13,000 from NT$15,000. Our 12-month TP is still based on 40x 2028E discounted P/E. We apply this to our 2028E EPS, and discount it back to 2027E at a 13.6% CoE to arrive at our TP. Our key assumptions for CoE include: (1) 1.5x beta (sourcing Bloomberg), (2) a 4.25% risk-free rate (inline with GS house-view), and (3) a market risk premium of 6.25% (in line with our GS house view).
Our 40x of target P/E is derived by applying a 1.26x multiple to the 3-year average forward P/E of 31.5x, representing a 26% premium to historical averages. This valuation is supported by a sharp in fl ection in earnings power, with the CAGR expected to accelerate to 99% over the 2025-2028E period, compared to 86% in 2023-2025. Overall, our new TP implies c.79% upside from the current share price, and we maintain our Buy rating on WinWay.
e92c7a75ab8b4efbba794e6b187208c8
For the exclusive use of KEVINLU@LENOVO.COM
Exhibit 4: WinWay's P&L overview
| 1Q26 | 2Q26E | 3Q26E | 4Q26E | 1Q27E | 2Q27E | 3Q27E | 4Q27E | 2026E | 2027E | 2028E | |
|---|---|---|---|---|---|---|---|---|---|---|---|
| P&L | |||||||||||
| Revenue | 2,980 | 3,523 | 4,262 | 4,523 | 4,600 | 5,861 | 7,994 | 8,190 | 15,289 | 26,646 | 44,122 |
| Gross profit | 1,282 | 1,358 | 1,676 | 1,848 | 1,919 | 2,490 | 3,486 | 3,615 | 6,164 | 11,510 | 19,957 |
| Operating profit | 777 | 834 | 1,117 | 1,272 | 1,334 | 1,822 | 2,715 | 2,830 | 4,000 | 8,701 | 16,337 |
| Net income | 699 | 706 | 935 | 1,090 | 1,072 | 1,410 | 2,195 | 2,391 | 3,430 | 7,069 | 13,202 |
| EPS (NT$) | 19.54 | 19.74 | 26.16 | 30.50 | 29.99 | 39.44 | 61.41 | 66.89 | 95.94 | 197.73 | 369.29 |
| Margins (%) | |||||||||||
| GM | 43.0% | 38.6% | 39.3% | 40.8% | 41.7% | 42.5% | 43.6% | 44.1% | 40.3% | 43.2% | 45.2% |
| OpM | 26.1% | 23.7% | 26.2% | 28.1% | 29.0% | 31.1% | 34.0% | 34.6% | 26.2% | 32.7% | 37.0% |
| NM | 23.4% | 20.0% | 21.9% | 24.1% | 23.3% | 24.1% | 27.5% | 29.2% | 22.4% | 26.5% | 29.9% |
| YoY (%) | |||||||||||
| Revenue | 29.7% | 131.4% | 136.2% | 102.5% | 54.3% | 66.4% | 87.6% | 81.1% | 94.6% | 74.3% | 65.6% |
| Gross profit | 14.4% | 82.2% | 120.8% | 98.4% | 49.7% | 83.3% | 108.0% | 95.6% | 73.3% | 86.7% | 73.4% |
| Operating profit | 6.8% | 81.4% | 174.2% | 168.0% | 71.8% | 118.4% | 143.1% | 122.5% | 93.3% | 117.5% | 87.8% |
| Net income | 14.0% | 244.4% | 151.6% | 125.6% | 53.5% | 99.8% | 134.8% | 119.3% | 105.0% | 106.1% | 86.8% |
| EPS | 13.5% | 242.8% | 150.8% | 124.9% | 53.5% | 99.8% | 134.8% | 119.3% | 104.3% | 106.1% | 86.8% |
| QoQ (%) | |||||||||||
| Revenue | 33.4% | 18.2% | 21.0% | 6.1% | 1.7% | 27.4% | 36.4% | 2.4% | |||
| Gross profit | 37.6% | 6.0% | 23.4% | 10.3% | 3.8% | 29.8% | 40.0% | 3.7% | |||
| Operating profit | 63.6% | 7.4% | 33.9% | 13.9% | 4.9% | 36.5% | 49.0% | 4.2% | |||
| Net income | 44.5% | 1.0% | 32.5% | 16.6% | -1.7% | 31.5% | 55.7% | 8.9% | |||
| EPS | 44.1% | 1.0% | 32.5% | 16.6% | -1.7% | 31.5% | 55.7% | 8.9% |
Source: Company data, Goldman Sachs Global Investment Research
Exhibit 5: Taiex vs. WinWay
Source: Bloomberg
Exhibit 6: Forward P/E
Source: Bloomberg
e92c7a75ab8b4efbba794e6b187208c8
For the exclusive use of KEVINLU@LENOVO.COM
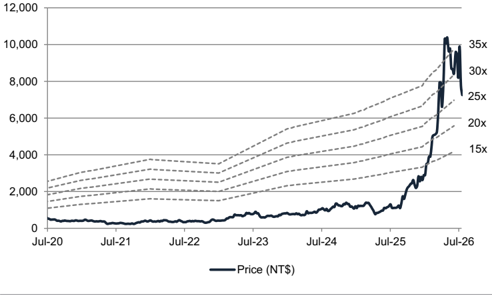
Exhibit 7: Forward P/B
Source: Bloomberg
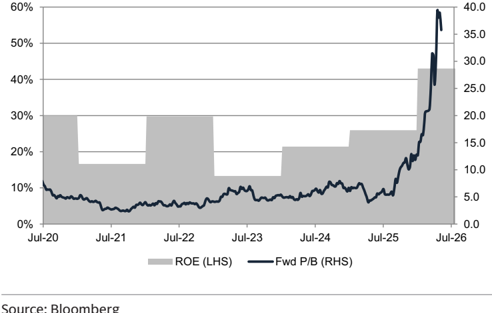
Exhibit 8: P/B vs. ROE
Source: Bloomberg
Investment Thesis, Price Target Risks and Methodology
Investment Thesis - WinWay (6515.TW)
WinWay is a leading Taiwan-based socket provider specializing in test sockets and burn-in sockets, which are used in Final Test (FT), System-Level Test (SLT), and burn-in test. The company is the 2nd largest socket supplier globally in terms of revenue, with c.8% of market share (in 2024). 56% of its total revenue comes from the socket segment.
We like WinWay as we expect its revenue/earnings to further accelerate at 70%/99% CAGRs in 2025-28E, mainly driven by 1) continued dollar content expansion in next-gen AI chips, 2) ongoing share gains as shipment volumes ramp following its new penetration into its US AI GPU customer's SLT market beyond the FT market, and 3) even stronger volume growth from its US AI ASIC customers across both AI accelerators and CPUs, 4) robust CPU socket demand, driven by agentic AI demand to general server CPU, and 5) stronger revenue contribution from MEMS probe cards supported by CPU and networking demand. The company is now trading below its 1-yr. average forward P/E of 50x and the 40x since the AI boom started in 2024; we therefore view the current valuation as o ff ering an attractive risk-reward pro fi le and have a Buy rating on the name.
Price Target Risks and Methodology - WinWay (6515.TW)
Valuation: We are Buy rated on WinWay. Our 12-month TP of NT$13,000 is based on a target P/E of 40x (1.26x of 3-year average forward P/E of 31.5x) applied to our 2028E EPS, and discounted back to 2027E at 13.6% CoE. Our key assumptions for CoE include: (1) 1.5x beta (sourcing Bloomberg), (2) a 4.25% risk-free rate, and (3) a market risk premium at 6.25% (in line with GS house view).
Key risks to our views: 1) softer AI/HPC demand, 2) slower penetration into new TAM, and 3) intensifying competition.
e92c7a75ab8b4efbba794e6b187208c8
For the exclusive use of KEVINLU@LENOVO.COM