PDF 原檔:報告_GS_景碩3189_20260803_original.pdf
已驗證圖片清單(Step 2.5,2026-08-04 逐張 Read)
| 檔名 | 分類 | 內容(親眼所見) |
|---|---|---|
260803_gs_kinsus_001.png |
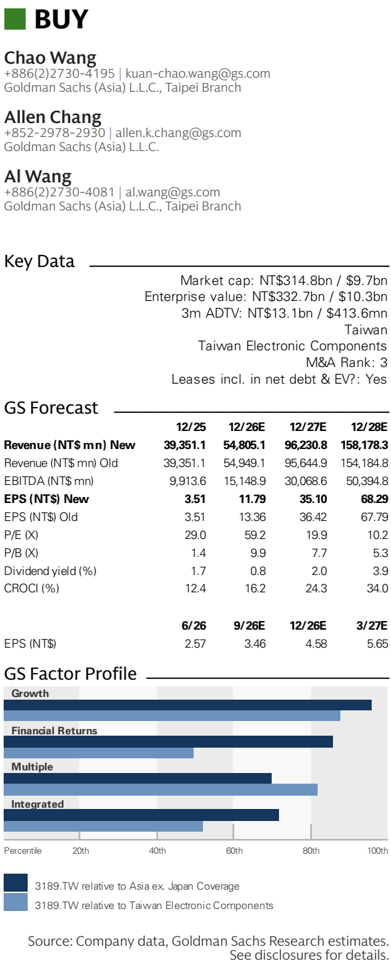
文字卡 | GS 首頁摘要卡:BUY/分析師聯絡資訊/Key Data(市值 NT$314.8bn)/GS Forecast 表(EPS 新舊對照)/GS Factor Profile 長條 — 數字已轉錄為表格,不嵌圖 |
260803_gs_kinsus_002.png |
評等沿革圖 | 景碩 Price Performance 股價走勢(FactSet,截至 2026-08-03 收盤) |
260803_gs_kinsus_003.png |
評等沿革圖 | 景碩 GS rating and stock price target history(2023-2026),目標價階梯 140.18→…→425→555,股價右軸與台灣加權指數對照 |
原始內容
For the exclusive use of KEVINLU@LENOVO.COM
Kinsus (3189.TW)
More favorable ABF substrate supply demand outlook with potential supply shortage in 2027/28; Buy
3189.TW
12m Pri c e Target:
NT$1,125.00
Pri c e:
NT$698.00
Upside:
61.2%
We hosted Kinsus' 2Q26 post-result follow-up call today (Aug 3rd). Key takeaways include:
- (1) The company didn't rule out the possibility of a potential supply shortage for ABF substrate in 2027/28 (previously mentioned that high layer count ABF substrate market to be in SD balance while expecting low layer count ABF substrate market to be in oversupply) as the company is receiving strong forecasts for next-gen AI related products with packaging size and layer counts that continue to go up.
- (2) In terms of pricing, Kinsus expect ABF and BT substrate pricing to have gone up by ~8% QoQ on average in 3Q/4Q26 with ABF substrate pricing to increase faster than BT substrate (reversing its previous expectation that BT substrate pricing to increase faster than ABF substrate in 2H26). The company expects revenue to see +10% QoQ in both 3Q/4Q26 (vs. 13% QoQ in 2Q26) and expects GM to reach 27-28/29% in 3Q/4Q26 (vs. 26% in 2Q26).
- (3) Without considering the potential pricing hike on ABF substrate going into 2027/28, Kinsus expects revenue in 2027/28 to increase at least 30% YoY per year while expecting GM to improve by 5ppt each year in 2027/28 as the company will continue to focus on product mix improvement and reaching higher UTR.
- (4) Kinsus announced a project CAPEX of NT$19.6bn, which will be split into 3 years and result in upward revision in 2026/27 CAPEX of ~NT$14bn/~NT$16bn (75%+/60%+ upward revision from NT$8bn/NT$10bn). The project CAPEX is driven entirely by new facility construction while equipment is sponsored by key customers (3-4 customers or more). Moreover, Kinsus is considering to expand K7 and K8 Plant in Taiwan as customers seek to secure capacity beyond 2030, while capacity and investment scale have yet to be fi nalized.
Goldman Sachs does and seeks to do business with companies covered in its research reports. As a result, investors should be aware that the fi rm may have a con fl ict of interest that could a ff ect the objectivity of this report. Investors should consider this report as only a single factor in making their investment decision. For Reg AC certi fi cation and other important disclosures, see the Disclosure Appendix, or go to www.gs.com/research/hedge.html. Analysts employed by non-US a ffi liates are not registered/quali fi ed as research analysts with FINRA in the U.S.
Key Data _____________________________________
Market cap: NT$314.8bn / $9.7bn Enterprise value: NT$332.7bn / $10.3bn 3m ADTV: NT$13.1bn / $413.6mn Taiwan
Taiwan Electronic Components
M&A Rank: 3
Leases incl. in net debt & EV?: Yes
| GS Forecast | 12/25 | __________ 12/26E | 12/27E | 12/28E |
|---|---|---|---|---|
| Revenue(NT$mn) New | 39,351.1 | 54,805.1 | 96,230.8 | 158,178.3 |
| Revenue (NT$ mn) Old | 39,351.1 | 54,949.1 | 95,644.9 | 154,184.8 |
| EBITDA (NT$ mn) | 9,913.6 | 15,148.9 | 30,068.6 | 50,394.8 |
| EPS(NT$) New | 3.51 | 11.79 | 35.10 | 68.29 |
| EPS (NT$) Old | 3.51 | 13.36 | 36.42 | 67.79 |
| P/E (X) | 29.0 | 59.2 | 19.9 | 10.2 |
| P/B (X) | 1.4 | 9.9 | 7.7 | 5.3 |
| Dividend yield (%) | 1.7 | 0.8 | 2.0 | 3.9 |
| CROCI (%) | 12.4 | 16.2 | 24.3 | 34.0 |
| 6/26 | 9/26E | 12/26E | 3/27E | |
| EPS (NT$) | 2.57 | 3.46 | 4.58 | 5.65 |
e92c7a75ab8b4efbba794e6b187208c8
For the exclusive use of KEVINLU@LENOVO.COM
BUY
Kinsus (3189.TW)
Rating since Feb 3, 2026
Ratios & Valuation __________________________________________
| 12/25 | 12/26E | 12/27E | 12/28E | |
|---|---|---|---|---|
| P/E (X) | 29.0 | 59.2 | 19.9 | 10.2 |
| P/B (X) | 1.4 | 9.9 | 7.7 | 5.3 |
| FCF yield (%) | 3.6 | (0.2) | 0.9 | 4.7 |
| EV/EBITDAR (X) | 6.2 | 24.4 | 12.4 | 7.3 |
| EV/EBITDA (excl. leases) (X) | 6.2 | 24.4 | 12.4 | 7.3 |
| CROCI (%) | 12.4 | 16.2 | 24.3 | 34.0 |
| ROE (%) | 5.0 | 17.4 | 43.5 | 61.2 |
| Net debt/equity (%) | 14.9 | 16.9 | 12.6 | (3.7) |
| Net debt/equity (excl. leases) (%) | 14.9 | 16.9 | 12.6 | (3.7) |
| Interest co v er (X) | 6.9 | 26.2 | 8 1.3 | 147.9 |
| Days in v entory outst , sales | 36.2 | 34.3 | 26.5 | 25.0 |
| Recei v able days | 56.7 | 50.5 | 43.2 | 44.2 |
| Days p ayable outstandin g | 37.6 | 37. 8 | 33.9 | 34.5 |
| DuPont ROE (%) | 3.9 | 13.0 | 30. 8 | 43.3 |
| Turno v er (X) | 0.5 | 0.6 | 0.9 | 1.1 |
| L e v era g e (X) | 1.9 | 1.9 | 1. 8 | 1.7 |
| G ross cas h in v ested (ex cas h ) (NT $ ) | 8 4 ,8 44.7 | 97 , 707.3 | 116 , 042.1 | 134 , 366.7 |
| A v era g e ca p ital e mp loyed (NT $ ) | 46 , 133.1 | 50 , 52 8 . 8 | 59 , 411.7 | 71 , 357.2 |
| BVP S (NT $ ) | 71.66 | 70.70 | 91.1 8 | 132.15 |
Growth & Margins (%) ______________________________________
| 12/25 | 12/26E | 12/27E | 12/28E | |
|---|---|---|---|---|
| Total revenue growth | 28 . 9 | 39 . 3 | 75 . 6 | 64 . 4 |
| E BITDA growth | 37 . 1 | 52 . 8 | 98 . 5 | 67 . 6 |
| E PS growth | 3,153 . 4 | 236 . 3 | 197 . 8 | 94 . 6 |
| DPS growth | 75 . 0 | 236 . 8 | 138 . 2 | 94 . 6 |
| E BIT margin | 6 . 8 | 15 . 1 | 24 . 4 | 27 . 9 |
| E BITDA margin | 25 . 2 | 27 . 6 | 31 . 2 | 31 . 9 |
| Net income margin | 4 . 1 | 10 . 9 | 18 . 6 | 22 . 0 |
Price Performance __________________________________________
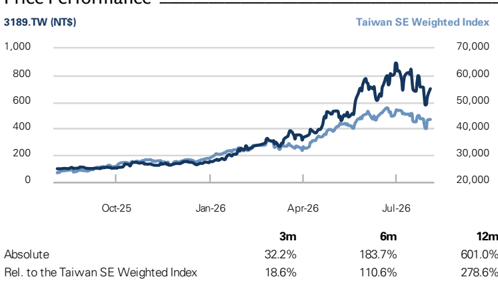
Source: FactSet. Price as of 3 Aug 2026 close.
Income Statement (NT$ mn) ________________________________
| 12/25 | 12/26E | 12/27E | 12/28E | |
|---|---|---|---|---|
| To t a l r e v e nu e | 39,351 . 1 | 54,805 . 1 | 96,230 . 8 | 158,1 7 8 . 3 |
| Cost of goods sold | (31,036 .7 ) | (39,90 7. 0) | (61,99 7.7 ) | (96,246 . 5) |
| SG&A | (3,034 . 8) | (3,838 . 4) | (6,1 7 3 . 5) | (10,3 7 6 . 8) |
| R&D | (2,609 . 8) | (2, 7 96 . 6) | (4,536 . 8) | ( 7 ,382 . 8) |
| Other operating inc . /(exp . ) E BITDA | -- | -- | -- | -- 5 0,394. 8 |
| Depreciation& amortization | 9,9 1 3. 6 ( 7 ,243 . 8) | 15 , 1 4 8 .9 (6,885 . 8) | 30,0 68 . 6 (6,545 .7 | (6,222 .7 ) |
| ) | ||||
| E BIT | 2 , 66 9. 8 | 8 , 26 3. 1 | 2 3, 522 .9 | 44, 172 . 1 |
| Net interest inc . /(exp . ) Income/(loss) from associates | (4 . 0) (0 . 9) | (66 . 6) -- | (111 . 5) -- | (101 . 0) -- |
| Pre-tax pro fi t | 3,0 87 . 2 | 8 , 5 4 2 . 6 | 2 3, 6 0 7 .9 | 44, 257 . 1 |
| Provision for taxes | (369 . 9) | (1,1 7 4 . 5) | (4,249 . 4) | ( 7 ,966 . 3) |
| Minority interest | (1,121 . 4) -- | (1,414 .7 ) -- | (1,484 . 3) | (1,515 . 1) -- |
| Preferred dividends N et inc . ( pre-ex c ept i o n a ls) | -- | 34, 775 . | ||
| 1 , 5 9 5 .9 -- | 5 ,9 5 3. 5 -- | 17 , 87 4. 1 -- | 8 -- | |
| Post-tax exceptionals N et inc . ( po s t-ex c ept i o n a ls) E P S(b a sic , pre-ex c ept ) (N T $) | 1 , 5 9 5 .9 3. 51 | 5 ,9 5 3. 5 11 . 7 9 | 17 , 87 4. 1 3 5 . 1 0 | 34, 775 . 8 68 . 2 9 |
| E P S(b a sic , po s t-ex c ept ) (N T E P S(dilu te d , po s t-ex c ept ) (N | 3. 51 3. 3. 1 .7 | 11 . 7 9 . 7 | 3 5 . 1 0 3 5 . 1 0 3 5 . 1 | 68 . 2 9 |
| E P S(dilu te d , pre-ex c ept ) (N T $) $) | 51 | 11 9 11 . 7 | 0 14 . 04 | 68 . 2 9 68 . 2 9 |
| T $) | 51 5 | 9 5 . 89 | ||
| 2 7. 32 | ||||
| DPS (NT$) | 49 . | 50 . | 40 . 0 | 40 . |
| Div . payout ratio (%) | ||||
| Balance Sheet (NT$ | ||||
| mn) | 9 | 0 | ______ 0 | |
| C a sh& c a sh equiv a lents | 12/25 12,281.2 | 12/26E 10,695.8 8,258.3 | 12/27E 11,115.5 14,500.5 | 12/28E 21,394.1 23,835.1 |
| Accounts receiv a ble Inventory | 6,900.7 4,828.3 | 5,466.7 | 8,492.8 | 13,184.5 4,447.6 |
| Other current a | 4,927.4 | 4,447.6 | 4,447.6 | 62 , 861 . 2 |
| ssets Total current assets | 28 ,93 7 . 6 | 28 , 868 .4 | 3 8 , 556 . 5 | |
| Net PP&E | 41,936.7 | 49,135.5 | 58,674.3 | 67,536.2 (78.5) |
| Net int a ngibles | 175.3 | 90.7 | 6.1 138.4 | 138.4 |
| Tot a l investments Other long-term a | 138.4 8,785.3 | 138.4 8,785.3 | 8,785.3 | 8,785.3 |
| ssets Total assets | 7 9,9 7 3.3 | 87 ,0 18 . 2 | 1 0 6 , 16 0. 5 | 1 39, 2 4 2 . 7 |
| 3,899.8 | 4,373.4 | 7,134.0 | 11,074.9 | |
| Accounts p a y a ble Short-term debt | 7,251.3 | 7,251.3 -- | ||
| 7,251.3 -- | 7,251.3 -- | -- | ||
| Short-term le a se li a bilities Other current li a bilities | 8,955.4 2 0, 1 0 6 | 11,135.4 22 , 76 0.0 | 15,308.3 2 9, 6 93. 5 | 22,068.9 40,39 5 . 1 |
| Total current | ||||
| liabilities Long-term debt | .4 | 11,197.1 | 11,197.1 | |
| Long-term le a se li a bilities Other long-term li a bilities | 11,197.1 -- | 11,197.1 -- | -- 7,296.5 | -- 7,296.5 |
| Total long-term liabilities Total liabilities | 18 ,493. 3 8 , 6 00. 1 | 7,296.5 18 ,493. 7 4 1 , 25 3. 6 | 18 ,493. 7 4 8 , 187 . 2 | 18 ,493. 7 58 , 888 . 8 -- |
| 7,296.5 7 | ||||
| Preferred sh a res Tot a l commonequity Minority interest | -- 32,731.8 8 , 6 4 1 .4 | -- 35,708.5 1 0,0 56 . 1 | -- 46,433.0 11 , 5 40.4 | 67,298.4 1 3,0 55 .4 |
| Total liabilities &equity | 7 9,9 7 3.3 | 87 ,0 18 . 2 | 1 0 6 , 16 0. 5 | 1 39, 2 4 2 . 7 |
| Net debt, a djusted | (2,945.7) | |||
| (NT$ | ||||
| Cash Flow mn) | 6,167.1 12/25 | 7,752.6 12/26E | 7,332.9 12/27E | __________ 12/28E |
| Net income D&Aadd-back Minority interest | 1,595.9 7,243.8 1,121.4 | 5,953.5 6,885.8 1,414.7 | 17,874.1 6,545.7 1,484.3 | 34,775.8 6,222.7 |
| add-back Net (inc)/dec working | (1,959.6) 91.5 | (1,522.4) | (6,507.7) (0.0) | 1,515.1 (10,085.2) -- |
| capital Other operating cash flow | 8 ,093.0 | 1 3, 211 | 9,39 6 | 3 2 ,4 28 .3 |
| Cash flow fro m operations | 479.8 .3 | .4 | ||
| 1 | ||||
| Capital expenditures Acquisitions | (6,116.8) (1,526.4) | (14,000.0) -- | (16,000.0) -- | (15,000.0) -- |
| Divestitures | -- (225.3) | -- | -- | -- -- |
| Others | ||||
| Cash flow fro m investing | ( 7 , 868 . 5 ) | -- ( 1 4,000.0) | -- ( 16 ,000.0) | ( 15 ,000.0) |
| Repayment of lease liabilities | -- | -- | -- | -- (7,149.7) |
| pref) | (456.6) | (796.8) | (2,976.7) | -- |
| Dividends paid(common& | 1,466.0 | -- | -- | |
| Inc/(dec) in debt Other financing cash flows Cash flow fro m financing | (4,318.2) (3,30 8 .9) (3,0 8 4.4) | 0.0 ( 7 9 6 . 8 ) | 0.0 ( 2 ,9 76 . 7 ) 4 1 9. 7 | 0.0 7 , 1 49. 7 ) 0, 278 . 6 |
| Total cash flow | ( 1 , 585 .4) | ( 1 | ||
| Free cash flow | 1,976.2 | (788.7) | 3,396.4 | 17,428.3 |
Source: Company data, Goldman Sachs Research estimates.
e92c7a75ab8b4efbba794e6b187208c8
For the exclusive use of KEVINLU@LENOVO.COM
(5) For AI-related products, Kinsus is targeting 100% market share for Vera CPU substrate (previously targeting 50-100% market share for AI CPU substrate), expanding from the current 50% share for Grace CPU substrate. The company continues to expect its AI GPU market share to go up to 20% in coming quarters (vs. 10% now). Moreover, the company also targets to gain market share in AMD/META/AWS's AI accelerator substrates in 2H26 and expects to further expand its share. The company expects AI contribution to reach ~10% of total revenue in 2026, and expand to 15-20% in 2027.
(6) In terms of BT substrate demand, the company mentioned optical modules as being one of the key drivers for the fi rst time, given the PCB for optical modules applies a similar production process to BT substrate (mSAP solutions), and expecting this segment to reach 5% of total revenue in 2027 from <1% in 2026. Another driver for the BT substrate business included demand from memory that will continue to grow in coming years.
(7) In terms of BT substrate supply, the company hinted that it may potentially expand capacity in China in 2027 to capture spillover orders from other ABF substrate suppliers, as peers continue to convert BT substrate capacity to ABF substrate production (see here).
(8) For future product opportunities, Kinsus is currently developing both glass/ceramic core substrate, it is still at a very early stage of R&D and expects no/very limited revenue contribution from this product prior to 2029.
(9) Kinsus reiteratedcits goal of reaching 80mn units of ABF capacity per month by the end of 2029 (doubling capacity vs. now), with total facility construction spending expected to be NT$45bn while the company mentioned that key customers will spend NT$60-80bn for the equipment (with NT$60bn already secured) throughout 2026-29. These customers will own 30mn units of the 2029 end capacity (~38% of total capacity) due to its direct equipment investment.
Investment view
We are positive on Kinsus' 2Q result (the solid jump on GM in 2Q -see here), and expect the company to further deliver a strong revenue/GM expansion in 2H26 thanks to the much better than expected market share on the high volume NVDA Vera CPU substrate (the company expects 100% market share for Vera CPU substrate, while the company only expected 50%+ three months ago - see here), which should contribute ~10%/15% of the company's ABF revenue or 15/20%+ of the ABF pro fi t contribution in 2026/27E with a much higher than company's average GM/OPM.
Moreover, Kinsus' tone on ABF substrates S/D outlook turns much more favorable (and echos our view on more tightness on ABF substrates in coming years -see here), while the company sees more and more high-layer/large size projects have been introduced by customers who are asking for more capacity from Kinsus to support the demand, despite the company having no numerical data to support this assumption, and still input any like for like base pricing hike assumption in their +30% YoY revenue guidance for 2027/28 or +5ppt GM YoY growth in 2027 &2028.
Going into LT, the company's (1) new CAPEX raise (see here), (2) its new comment on potential new K7/8 plant for 2030 and beyond new capacity expansion, and (3) customers' direct investment in ABF substrate capacity for more than NT$80bn in the e92c7a75ab8b4efbba794e6b187208c8
camoll c. roL Lavie cambre le canserevisiontavie
Kinsus P&L (NT$ mn)
NTSmn
1Q26
Revenue
Sales
Gross Profit
Gross profit
EBIT
Operating expense
Net Income
Pretax income
EPS (NT$)
Operating income
Taxes expense
Ratio analysis
Net income
EPS, NT$
Gross margin
(1,459)
890
964
(89)
549
EBIT margin
1.17
Net margin
Ratio analysis and assumption
As % of sales
Gross margin
Operating expense ratio
Operating margin
Net margin
QoQ growth (%)
Revenue
Gross profit
Operating income
Net income
Revenue
Gross profit
Operating income
Net income
2026E New
2Q26
3Q26E
54,805
14,690
4.174
14,898
8,263
(1,711)
5,953
2,463
2,563
11.79
(436)
27.2%
1,762
3.46
15.1%
10.9%
28.4%
11.7%
16.8%
12.0%
17.6%
28.0%
46.7%
34.5%
41.9%
112.6%
292.1%
419.4%
For the exclusive use of KEVINLU@LENOVO.COM
21.2%
13.1%
8.0%
4.9%
2.7%
-1.8%
-3.3%
-14.5%
28.8%
21.0%
77.7%
98.9%
(1,582)
1,679
1,785
(101)
1,311
2.57
26.1%
12.7%
13.4%
10.5%
12.5%
38.8%
88.6%
138.8%
30.7%
61.8%
170.8%
287.6%
Exhibit 2: P&L table
Source: Company data, Goldman Sachs Global Investment Research
2026E Old
4Q26E
1Q27E
16,514
Diff.
2Q27E
0%
17,893
5.114
(1,883)
3,231
2027E New
3Q27E
96,231
22,643
-4%
5,902
-7%
(2,054)
-5%
3,848
2027E Old
4Q27E
27,056
34,233
7,932
95,645
28,638
9,738
23.523
(2,445)
(3,003)
17,874
2029E New
2026E
2027E
54.805
250,634
2029E Old
2028E
236,684
96,231
14.898
103,203
158,178
34,233
(6,635)
94.697
61,932
(10,710)
60.183
68,211
(17,760)
54,488
2028E New
2Q28E
Diff.
1Q28E
31,241
1%
3Q28E
158,178
37,225
11.891
3%
2028E Old
42,160
61,932
14,506
5%
(3,473)
5%
4Q28E
154,185
47,552
16.620
44,172
(4,214)
(4,734)
34,776
33,138
10.661
22,494
(3,207)
17,030
Diff.
2029E
6%
10%
10%
Diff.
2025E
3%
39,351
8.314
7%
9%
(5,645)
10%
57,734
18.914
40.422
(5,339)
31,701
5,487
6,734
7,454
10,292
11,887
13,575
2,670
75,156
8,263
23,523
44,172
(28,047)
75,156
next 3 years, should imply a long term demand sustainability and could improve investor con fi dence levels on long term AI demand sustainability. 41.2% 40.0% 1.2ppt (1,174) 5,953 (4,249) 17.874 (7,966) 34,776 (13,561) 60,183
0.9ppt
15.84
10.09
11.79
13.06
4.58
18.33
8.10
3.52
35.10
11.26
5.65
21.06
30.0%
1.7ppt
1.2ppt
27.9%
26.2%
23.5%
24.4%
28.8%
-1.1ppt
68.29
118.18
Overall, we maintain our Buy rating on Kinsus, and we expect the better market share in AI server CPU and its better position in the high-end ABF substrate industry into long term. We revise up our Kinsus TP to NT$1,125 (from NT$1,120). 39.2% 11.2% 41.2% 11.2%
19.6%
24.2%
24.9%
21.5%
Earnings revisions
12.4%
28.5%
22.5%
12.8%
26.0%
20.0%
5.8%
26.9%
21.3%
9.1%
8.4%
27.6%
21.7%
19.2%
19.5%
28.2%
22.1%
13.3%
26.5%
We revise up our 2027/28/29E earnings estimate by 5/10/10% to factor in the solid GM/OPM expansion from a more favorable pricing outlook given the potential supply shortage environment (revise up 2027/28/29 GM by 0.9/1.7/1.2ppt and OPM by 0.9/1.7/1.2ppt). 108.5% 130.7% 101.5% 118.8% 82.9% 87.6% 70.7% 76.5% 77.4% 82.1% -4% 144% 79% 210% 130% 185% 81% 88% 67% 70%
262.9%
273%
191.7%
145.9%
87.1%
81.6%
95.5%
214.7%
131.2%
3164%
424.0%
200%
95%
73%
We revise down our 2026E earnings estimate by 5% after re fl ecting a more conservative margin assumption on its IC substrate business in 2H26E, though we expect solid GM/OPM expansion in coming quarters.
Exhibit 1: Earnings revision table
Source: Company data, Goldman Sachs Global Investment Research
Valuation
We maintain our Buy rating with a new 12m TP of NT$1,125 (from NT$1,120), based on 16.5x 2028E P/E, which is +1.2x STDV higher than Kinsus' past upcycle average P/E (14.2x), and factor in our latest earnings revisions.
6.8%
4.1%
15.1%
10.9%
24.4%
18.6%
27.9%
22.0%
30.0%
24.0%
e92c7a75ab8b4efbba794e6b187208c8
For the exclusive use of KEVINLU@LENOVO.COM
Investment Thesis - Kinsus
Kinsus is one of the key IC substrates suppliers globally with ~10% ABF/BT substrates market share in 2024, with ~18% of total 2025 revenue contributed by its contact lens subsidiary, Pegavision (6941.TW, Not Covered). With our view that the ABF substrate shortage started from 2Q26 (ABF substrate return to supply demand balance from late 2025), we believe Kinsus' performance will continue to improve compared with high-end ABF peers considering the company's increasing market share in the high-end ABF substrate market; however, ~36% of the company's revenue was contributed by BT substrates in 2025 and 30% of the company's ABF revenue is from non-LTA customers, which we believe will continue to enjoy a better pricing outlook. As a result, we believe Kinsus' earnings outlook should continue to be strong (~106% 2026-29E CAGR), mainly driven by better BT substrate and non-LTA ABF substrate pricing outlook, despite the unfavorable demand outlook before 2H26. We believe Kinsus is an experienced substrate supplier with a clear capacity expansion plan that can also upgrade its product portfolio in the long term. We believe we are at the beginning of an industry upcycle, making us positive on Kinsus' stock performance over the next 12 months.
Price Target Risks and Methodology - Kinsus
Valuation methodology: Our 12-month target price of NT$1,125 for Kinsus is based on 16.5x 2028E P/E, which is +1.2x STDV higher than Kinsus' past upcycle average P/E (14.2x).
Key downside risks: (1) Slower-than-expected PC demand recovery, (2) Slower-than-expected ABF substrates pricing upgrading outlook, (3) Slower/Less-than-expected AI server orders from 2H26.
e92c7a75ab8b4efbba794e6b187208c8
For the exclusive use of KEVINLU@LENOVO.COM