PDF 原檔:報告_GS_昇達科3491_20260728_original.pdf
圖片清單(已驗證 2026-07-28)
Step 2.5 眼見為憑索引,是 lib/ 嵌圖的唯一真相來源。只挑分類為「真資料圖」且已逐張 Read 者嵌入,圖說照抄「親眼所見內容」。
| 檔名 | size | 分類 | 親眼所見內容 |
|---|---|---|---|
報告_GS_昇達科3491_20260728_004.png |
74KB | 真資料圖 | GS rating and stock price target history(UMT 3491.TWO):2023-2026 股價線+目標價點位 591/588/626/592/510/581/655/751/863/992/1,333/2,007/2,208/2,513,評等自 Feb 17(2025)轉 B(Buy) |
報告_GS_昇達科3491_20260728_002.png |
42KB | 真資料圖(未逐張 Read) | Exhibit 5:UMT 12M forward P/E ratio |
報告_GS_昇達科3491_20260728_003.png |
43KB | 真資料圖(未逐張 Read) | Exhibit 4 附圖:UMT discounted P/E(Source: TEJ) |
報告_GS_昇達科3491_20260728_001.png |
22KB | 裝飾·logo·banner | <40KB,未 Read |
只有 _004.png 逐張 Read 確認;其餘為估值類,依 Exhibit 標題做範圍性驗證,未嵌入 lib 頁。
原始內容
For the exclusive use of KEVINLU@LENOVO.COM
UMT (3491.TWO): LEO satellite business in expansion; 3Q26 to see GM improvement; Buy
UMT delivered strong June revenues growth at 89% YoY to NT$257m, driven by expanding LEO satellite business, leading to 2Q26 revenues at NT$902m; however, the QoQ is negative and 7% behind our estimates given its major customer's model transition. Nevertheless, we expect the impact from model transition would be lower in 3Q26 compared to 2Q26, supporting the monthly revenues back to sequential growth in 3Q26, GM recovery and better opex ratio considering the larger revenues scale. We remain positive on UMT given (1) riding on the accelerating LEO satellite launches to enhance the satellite communication services and expand Space applications, (2) waveguide for LEO satellite dollar content increase given more bands are adopted per LEO satellite, and (3) waveguide end market expands from LEO satellite to AI data center for high-speed interconnection in scale up (report link). Maintain Buy.
UMT provides rectangular waveguides, which are conducting pipes with a rectangular cross-section used to guide the propagation of microwave or mmwave signals. Di ff erent shapes and combinations of waveguides can form various RF passive components, such as fi lter / diplexer, coupler, isolator, antenna, power ampli fi ers (PAs), etc. The company serves leading global LEO satellite operators, and its waveguides can be seen in LEO satellites / payloads (main), and gateways in ground stations.
Exhibit 1: We expect company's July revenues at 119% YoY/ 8% MoM to NT$277m UMT monthly/ quarterly revenues
| Apr 2026 | May 2026 | Jun 2026 | Jul 2026E | Aug 2026E | Sep 2026E | 2Q26 | 3Q26E | |
|---|---|---|---|---|---|---|---|---|
| Revenues (NT$m) | 349 | 296 | 257 | 277 | 311 | 520 | 902 | 1,108 |
| YoY | 84% | 57% | 89% | 119% | 87% | 172% | 76% | 129% |
| MoM/QoQ | 6% | -15% | -13% | 8% | 12% | 68% | -12% | 23% |
| GS estimates (NT$m) | 372 | 373 | 320 | 966 | ||||
| Actual vs. GS | -6% | -21% | -20% | -7% |
Source: Company data, Goldman Sachs Global Investment Research
2Q26 miss on major customer's model transition: UMT 2Q26 revenues were up 76% YoY to NT$902m, with rising LEO satellite revenues contribution, while the revenues is 7% / 12% behind our / Bloomberg consensus given its major customer's model transition. 2Q26 GM was at 55.6% (vs. 2Q25/ 1Q26 at 43.4%/ 58.0%) with improving YoY driven by better product mix, while lower than our estimates / Bloomberg consensus, given the impact from model transition. We expect to see sequential GM improvement ahead on rising LEO satellite contribution and less impact from model transition. 2Q26 Opex ratio was at 28.8%, or higher than our estimates / Bloomberg consensus at 26.7%/ 27.3%, and we attribute it to smaller
Goldman Sachs does and seeks to do business with companies covered in its research reports. As a result, investors should be aware that the fi rm may have a con fl ict of interest that could a ff ect the objectivity of this report. Investors should consider this report as only a single factor in making their investment decision. For Reg AC certi fi cation and other important disclosures, see the Disclosure Appendix, or go to www.gs.com/research/hedge.html. Analysts employed by non-US a ffi liates are not registered/quali fi ed as research analysts with FINRA in the U.S.
Allen Chang
+852-2978-2930 | allen.k.chang@gs.com Goldman Sachs (Asia) L.L.C.
Verena Jeng
+852-2978-1681 | verena.jeng@gs.com Goldman Sachs (Asia) L.L.C.
Ting Song +852-2978-6466 | ting.song@gs.com Goldman Sachs (Asia) L.L.C.
e92c7a75ab8b4efbba794e6b187208c8
For the exclusive use of KEVINLU@LENOVO.COM
revenues scale. Overall, the OP income remains strong in YoY at +158%, while decline 23% QoQ and is 24% / 27% behind our / Bloomberg consensus due to the model transition.
Exhibit 2: UMT 2Q26 result snapshot
| NT$m | 2Q25 | 1Q26 | 2Q26 | QoQ | YoY | GS | Act/ GS | Cons. | Act / Cons. |
|---|---|---|---|---|---|---|---|---|---|
| Revenues | 514 | 1,020 | 902 | -12% | 76% | 966 | -7% | 1,028 | -12% |
| GP | 223 | 592 | 502 | -15% | 125% | 576 | -13% | 613 | -18% |
| OP | 94 | 314 | 241 | -23% | 158% | 318 | -24% | 332 | -27% |
| Net income | 71 | 253 | 308 | 22% | 333% | 260 | 18% | 367 | -16% |
| Margins | |||||||||
| GM | 43.3% | 58.0% | 55.6% | 59.6% | 59.6% | ||||
| OPM | 18.2% | 30.7% | 26.8% | 32.9% | 32.3% | ||||
| NM | 13.8% | 24.8% | 34.1% | 26.9% | 35.7% |
Source: Company data, Goldman Sachs Global Investment Research, Bloomberg
Earnings revision: We factor in UMT 2Q26 results, and revise down 2026E GM by 2.4ppts to re fl ect the impact on model transition in 2Q - 3Q26. We continue to expect a strong growth ahead driven by LEO satellites launches and speci fi cation upgrade, and thus keep our estimates in 2027 - 28E largely unchanged. The blended GM would continue to expand on product mix upgrade toward LEO satellites from traditional RF products for telecom operators.
Exhibit 3: Earnings revision
| 2026E | 2026E | 2026E | 2027E | 2027E | 2027E | 2028E | 2028E | 2028E | |
|---|---|---|---|---|---|---|---|---|---|
| NT$m | Old | New | Diff% | Old | New | Diff% | Old | New | Diff% |
| Revenues | 4,276 | 4,293 | 0% | 8,991 | 8,959 | 0% | 12,635 | 12,580 | 0% |
| GP | 2,706 | 2,615 | -3% | 6,060 | 6,065 | 0% | 8,751 | 8,714 | 0% |
| OP | 1,559 | 1,419 | -9% | 3,560 | 3,574 | 0% | 5,239 | 5,242 | 0% |
| Net income | 1,262 | 1,261 | 0% | 2,851 | 2,863 | 0% | 4,136 | 4,134 | 0% |
| Margins | |||||||||
| GM | 63.3% | 60.9% | 67.4% | 67.7% | 69.3% | 69.3% | |||
| OPM | 36.5% | 33.1% | 39.6% | 39.9% | 41.5% | 41.7% | |||
| NM | 29.5% | 29.4% | 31.7% | 32.0% | 32.7% | 32.9% |
Source: Company data, Goldman Sachs Global Investment Research
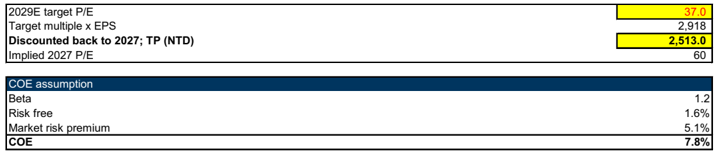
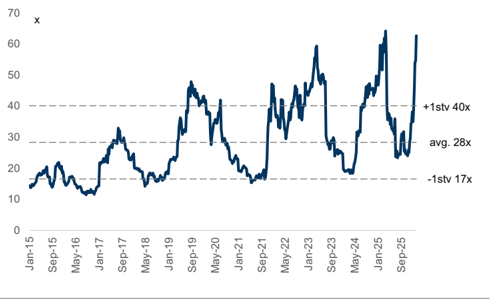
Valuation: We continue to derive our target price based on a discounted P/E, and based on 2029E (methodology unchanged). We continue to derive the target P/E multiple from the average PEG&M ratio of peers in the satellite supply chain, and we remove outliers (telecom operators who face competition from LEO satellite operators). Our target 2029E discounted P/E multiple is at 37.0x (unchanged) which is based on peers' avg. PEG&M, and UMT's 2029-30E avg. NI YoY and OPM. We apply the 37.0x multiple to 2029E EPS and discount it back to 2027E via a COE of 7.8% (no change). Our target price is at NT$2,513 (unchanged), implying 60x 2027E P/E, which is above the company's average +1 stv. P/E of 40x, re fl ecting our positive view on UMT's product mix upgrade toward LEO satellites. Maintain Buy.
e92c7a75ab8b4efbba794e6b187208c8
For the exclusive use of KEVINLU@LENOVO.COM
Exhibit 4: UMT discounted P/E
| (NT$ mn) | 2022 | 2023 | 2024 | 2025 | 2026E | 2027E | 2028E | 2029E | 2030E |
|---|---|---|---|---|---|---|---|---|---|
| Milestones | Telecom components | Telecom components | Telecom components | LEO satellite launch accelerations | LEO satellite launch accelerations | LEO satellite launch accelerations | LEO satellite launch accelerations | LEO satellite users ramp up | LEO satellite users ramp up |
| Satellite revenues% | 15% | 15% | 43% | 59% | 80% | 90% | 93% | ||
| Revenue | 1,838 | 1,585 | 2,335 | 2,452 | 4,293 | 8,959 | 12,580 | 16,228 | 19,798 |
| YoY | 5% | -14% | 47% | 5% | 75% | 109% | 40% | 29% | 22% |
| Gross margin | 40.9% | 40.4% | 51.3% | 51.1% | 60.9% | 67.7% | 69.3% | 69.8% | 70.1% |
| Operating profit | 294 | 202 | 624 | 575 | 1,419 | 3,574 | 5,242 | 6,859 | 8,467 |
| YoY | 33% | -31% | 208% | -8% | 147% | 152% | 47% | 31% | 23% |
| Operating margin | 16% | 13% | 27% | 23% | 33% | 40% | 42% | 42% | 43% |
| Net profit | 271 | 200 | 547 | 518 | 1,261 | 2,863 | 4,134 | 5,410 | 6,667 |
| EPS (NT$, diluted) | 4.34 | 3.12 | 8.27 | 7.60 | 18.82 | 41.73 | 60.26 | 78.85 | 97.18 |
| YoY | 15% | -26% | 173% | -5% | 143% | 127% | 44% | 31% | 23% |
| TP implied P/E | 579 | 807 | 304 | 331 | 134 | 60 | 42 | 32 | 26 |
Source: Company data, Goldman Sachs Global Investment Research
Exhibit 5: UMT 12M forward P/E ratio
Source: Company data, Goldman Sachs Global Investment Research, Bloomberg
Exhibit 7: UMT P&L Summary
| NT$ mn | 2023 | 2024 | 2025 | 2026E | 2027E | 2028E | 1Q25 | 2Q25 | 3Q25 | 4Q25 | 1Q26 | 2Q26 | 3Q26E | 4Q26E |
|---|---|---|---|---|---|---|---|---|---|---|---|---|---|---|
| Income statement | ||||||||||||||
| Revenue | 1,585 | 2,335 | 2,452 | 4,293 | 8,959 | 12,580 | 620 | 514 | 484 | 834 | 1,020 | 902 | 1,108 | 1,263 |
| Gross profit | 641 | 1,198 | 1,254 | 2,615 | 6,065 | 8,714 | 314 | 223 | 229 | 489 | 592 | 502 | 662 | 859 |
| OP income | 202 | 624 | 575 | 1,419 | 3,574 | 5,242 | 167 | 94 | 84 | 230 | 314 | 241 | 361 | 503 |
| Net income | 200 | 547 | 518 | 1,261 | 2,863 | 4,134 | 143 | 71 | 88 | 216 | 253 | 308 | 333 | 397 |
| EPS (NT$) | 3.12 | 8.27 | 7.60 | 18.82 | 41.73 | 60.26 | 2.09 | 1.07 | 1.29 | 3.15 | 3.69 | 4.49 | 4.85 | 5.79 |
| Ratios | ||||||||||||||
| Opex ratio | 27.7% | 24.6% | 27.7% | 27.8% | 27.8% | 27.6% | 23.7% | 25.1% | 29.9% | 31.0% | 27.2% | 28.8% | 27.2% | 28.2% |
| Tax rate | 19.4% | 21.7% | 19.0% | 21.7% | 22.0% | 22.0% | 21.9% | 7.7% | 21.8% | 19.1% | 22.0% | 22.0% | 22.0% | 22.0% |
| Margins | ||||||||||||||
| Gross margin | 40.4% | 51.3% | 51.1% | 60.9% | 67.7% | 69.3% | 50.6% | 43.3% | 47.3% | 58.6% | 58.0% | 55.6% | 59.8% | 68.0% |
| Operating margin | 12.8% | 26.7% | 23.4% | 33.1% | 39.9% | 41.7% | 26.9% | 18.2% | 17.4% | 27.6% | 30.7% | 16.5% | 32.6% | 39.8% |
| Net margin | 12.6% | 23.4% | 21.1% | 29.4% | 32.0% | 32.9% | 23.0% | 13.8% | 18.2% | 25.9% | 24.8% | 180.4% | 30.1% | 31.5% |
| YoY | ||||||||||||||
| Revenue | -14% | 47% | 5% | 75% | 109% | 40% | 43% | -21% | -24% | 36% | 65% | 76% | 129% | 51% |
| Gross profit | -15% | 87% | 5% | 109% | 132% | 44% | 60% | -38% | -31% | 56% | 89% | 125% | 189% | 76% |
| OP income | -31% | 208% | -8% | 147% | 152% | 47% | 117% | -53% | -55% | 40% | 88% | 158% | 329% | 119% |
| Net income | -26% | 173% | -5% | 143% | 127% | 44% | 84% | -60% | -33% | 36% | 77% | 333% | 277% | 84% |
| QoQ | ||||||||||||||
| Revenue | 1% | -17% | -6% | 72% | 22% | -12% | 23% | 14% | ||||||
| Gross profit | 0% | -29% | 3% | 113% | 21% | -15% | 32% | 30% | ||||||
| OP income | 2% | -44% | -10% | 173% | 36% | -23% | 50% | 39% | ||||||
| Net income | -10% | -50% | 24% | 145% | 17% | 22% | 8% | 19% |
Source: Company data, Goldman Sachs Global Investment Research
Source: TEJ
e92c7a75ab8b4efbba794e6b187208c8
For the exclusive use of KEVINLU@LENOVO.COM
Price target risks and methodology - UMT
Valuation: We use a discounted P/E methodology and apply a 37.0x target P/E multiple to UMT's 2029E EPS, discounting it back to 2027E at a COE of 7.8% (beta 1.2x, risk-free rate 1.6% and market risk premium at 5.1%), which leads to our 12-month target price of NT$2,513. The target P/E is based on the average PEG&M ratio of peers in the satellite supply chain. We are Buy-rated on UMT.
Key Risks: Slower-than-expected LEO satellite deployment; Potential competition from new-entrant suppliers; LEO satellite operators manufacturing in-house components.
| 3491.TWO | 12m Price Target: NT$2,513.00 | 12m Price Target: NT$2,513.00 | Price: NT$1,155.00 | Upside: 117.6% | Upside: 117.6% |
|---|---|---|---|---|---|
| Buy | Buy | GS Forecast | |||
| Market c ap: NT$76.5b n / $ 2 . 4 b n En terpr is e v a lu e: NT$75. 8 b n / $ 2 . 3 b n 3m AD T V : NT$ 3 . 3 b n / $ 103 . 8mn Ta iw a n G reater Chin a Te chnology M &A R a n k: 3 L ea s e s incl . in n et d ebt & EV? : Y e s | Revenue (NT $m n ) Ne w Revenue (NT$ mn) Old EBITDA (NT$ mn) E PS (NT $) Ne w EPS (NT$) Old P/E (X) P/B (X) Dividend yield (%) CROCI (%) | 12/25 | 12/26E | 12/27E | 12/28E |
| Market c ap: NT$76.5b n / $ 2 . 4 b n En terpr is e v a lu e: NT$75. 8 b n / $ 2 . 3 b n 3m AD T V : NT$ 3 . 3 b n / $ 103 . 8mn Ta iw a n G reater Chin a Te chnology M &A R a n k: 3 L ea s e s incl . in n et d ebt & EV? : Y e s | 2 ,4 52 . 2 2,452.2 | 4, 2 9 2 .9 | 8 ,9 58 .9 8,990.9 | 12 , 57 9.9 12,644.9 | |
| Market c ap: NT$76.5b n / $ 2 . 4 b n En terpr is e v a lu e: NT$75. 8 b n / $ 2 . 3 b n 3m AD T V : NT$ 3 . 3 b n / $ 103 . 8mn Ta iw a n G reater Chin a Te chnology M &A R a n k: 3 L ea s e s incl . in n et d ebt & EV? : Y e s | 688.6 | 4,276.4 1,542.0 | 3,713.9 | 5,397.3 | |
| Market c ap: NT$76.5b n / $ 2 . 4 b n En terpr is e v a lu e: NT$75. 8 b n / $ 2 . 3 b n 3m AD T V : NT$ 3 . 3 b n / $ 103 . 8mn Ta iw a n G reater Chin a Te chnology M &A R a n k: 3 L ea s e s incl . in n et d ebt & EV? : Y e s | 7 . 6 0 | 18 . 82 | 4 1 . 7 3 | 6 0. 26 | |
| Market c ap: NT$76.5b n / $ 2 . 4 b n En terpr is e v a lu e: NT$75. 8 b n / $ 2 . 3 b n 3m AD T V : NT$ 3 . 3 b n / $ 103 . 8mn Ta iw a n G reater Chin a Te chnology M &A R a n k: 3 L ea s e s incl . in n et d ebt & EV? : Y e s | 7.60 | 18.39 | 41.55 | 60.27 | |
| Market c ap: NT$76.5b n / $ 2 . 4 b n En terpr is e v a lu e: NT$75. 8 b n / $ 2 . 3 b n 3m AD T V : NT$ 3 . 3 b n / $ 103 . 8mn Ta iw a n G reater Chin a Te chnology M &A R a n k: 3 L ea s e s incl . in n et d ebt & EV? : Y e s | 54.5 | 61.4 | 27.7 | 19.2 | |
| Market c ap: NT$76.5b n / $ 2 . 4 b n En terpr is e v a lu e: NT$75. 8 b n / $ 2 . 3 b n 3m AD T V : NT$ 3 . 3 b n / $ 103 . 8mn Ta iw a n G reater Chin a Te chnology M &A R a n k: 3 L ea s e s incl . in n et d ebt & EV? : Y e s | 9.0 | 23.0 | 19.9 | 16.2 | |
| Market c ap: NT$76.5b n / $ 2 . 4 b n En terpr is e v a lu e: NT$75. 8 b n / $ 2 . 3 b n 3m AD T V : NT$ 3 . 3 b n / $ 103 . 8mn Ta iw a n G reater Chin a Te chnology M &A R a n k: 3 L ea s e s incl . in n et d ebt & EV? : Y e s | 1.4 | 1.3 | 2.8 | 4.1 | |
| Market c ap: NT$76.5b n / $ 2 . 4 b n En terpr is e v a lu e: NT$75. 8 b n / $ 2 . 3 b n 3m AD T V : NT$ 3 . 3 b n / $ 103 . 8mn Ta iw a n G reater Chin a Te chnology M &A R a n k: 3 L ea s e s incl . in n et d ebt & EV? : Y e s | 21.5 | 45.4 | 90.6 | 136.6 | |
| Market c ap: NT$76.5b n / $ 2 . 4 b n En terpr is e v a lu e: NT$75. 8 b n / $ 2 . 3 b n 3m AD T V : NT$ 3 . 3 b n / $ 103 . 8mn Ta iw a n G reater Chin a Te chnology M &A R a n k: 3 L ea s e s incl . in n et d ebt & EV? : Y e s | 6/26 | 9 /26E | 12/26E | 3 /27E | |
| Market c ap: NT$76.5b n / $ 2 . 4 b n En terpr is e v a lu e: NT$75. 8 b n / $ 2 . 3 b n 3m AD T V : NT$ 3 . 3 b n / $ 103 . 8mn Ta iw a n G reater Chin a Te chnology M &A R a n k: 3 L ea s e s incl . in n et d ebt & EV? : Y e s | EPS (NT$) | 4.49 | 4.85 | 5.79 | 8.14 |
Source: Company data, Goldman Sachs Research estimates, FactSet. Price as of 27 Jul 2026 close.
e92c7a75ab8b4efbba794e6b187208c8
For the exclusive use of KEVINLU@LENOVO.COM