PDF 原檔:報告_GS_國巨_20260705_original.pdf
原始內容
For the exclusive use of KEVINLU@LENOVO.COM
Yageo Corp. (2327.TW)
Commodity MLCC pricing upcycle is coming, with more capacity transferred into AI industry; Buy, with new TP of NT$1,490 (from NT$346)
2327.TW
12m Pri c e Target:
NT$1,490.00
Pri c e:
NT$1,045.00
Upside:
42.6%
We are seeing a new trend of commodity MLCC pricing hikes emerging, and we believe Yageo is in a good position (~25% of the global commodity MLCC capacity share in 2026-28) to bene fi t from the solid commodity MLCC pricing hike outlook (we expect Yageo's commodity MLCC pricing to go up by 93%/84% in 2027/28E), leading to a 46%/51% GM in 2027E/28E and record high EPS.
Considering (1) more and more MLCC capacity is being transferred into the AI grade MLCC supply chain (we expect 14/24/32% of global MLCC capacity to support AI MLCC demand in 2026/27/28E, up from 9% in 2025), (2) the back-to-normal growth of non-AI MLCC demand (2025-28E volume CAGR at 9%, per GSe), and (3) inventory demand building up in coming years (inventory level in 2025 was 36% less than the peak level of the past ten years), we believe the global non-AI MLCC industry utilization rate will revert to 97%/100% in 2027/28E (vs. last peak of 94/99% in 2017/18), suggesting a solid pricing outlook for the overall MLCC market.
We raise our 2026/27/28E earnings by 11%/49%/106% to factor in the better pricing conditions for commodity MLCC as well as better order visibility. Re fl ecting this and rollover of our valuation base from 3Q26-2Q27 to 2H27-1H28 we revise up our 12-m TP to NT$1,490 (vs. NT$346 previously), with the target PB/ROE multiple at 26x (in line with past 20 years peak multiple). Overall, we are bullish on Yageo's traditional MLCC business pro fi tability, seeing a structural change in the industry supply demand conditions, suggesting good earnings outlook.
In this note, we transfer Yageo coverage from Daiki Takayama to Chao Wang.
BUY
Chao Wang
+886(2)2730-4195 | kuan-chao.wang@gs.com Goldman Sachs (Asia) L.L.C., Taipei Branch
Allen Chang
+852-2978-2930 | allen.k.chang@gs.com Goldman Sachs (Asia) L.L.C.
Daiki Takayama
+81(3)4587-9870 | daiki.takayama@gs.com Goldman Sachs Japan Co., Ltd.
Key Data _____________________________________
Market cap: NT$2.1tr / $67.2bn
Enterprise value: NT$2.2tr / $68.6bn
3m ADTV: NT$33.2bn / $1.0bn
Taiwan
Taiwan Electronic Components
M&A Rank: 3
Leases incl. in net debt & EV?: No
| GS Forecast | 12/25 | __________ 12/26E 196,764.5 | 12/27E 289,670.6 | 12/28E 388,444.8 |
|---|---|---|---|---|
| Revenue(NT$mn) New Revenue (NT$ mn) Old | 132,930.0 1 32,930.0 | 1 84,797.8 | 230,447.8 | 252,550.2 |
| EBITD A (NT$ mn) | 39,634.5 | 64, 1 39.7 | 1 07,325.3 | 1 58,305.3 |
| EPS(NT$) New | 11.51 | 21.22 | 37.56 | 57.32 |
| EPS (NT$) Old | 11 .5 1 | 1 9. 1 2 | 25.27 | 27.87 |
| P/E (X) | 1 3.4 | 49.3 | 27.8 | 1 8.2 |
| P/B (X) | 1 .9 | 11 .2 | 9.4 | 7.5 |
| Dividend yield (%) | 3.9 | 1 . 1 | 1 .9 | 2.9 |
| CROCI (%) | 9.5 | 1 3.6 | 2 1 .8 | 30.9 |
| 3/26 | 6/26E | 9/26E | 12/26E | |
| EPS (NT$) | 3.9 1 | 4.7 1 | 5.93 | 6.68 |
Source: Company data, Goldman Sachs Research estimates. See disclosures for details.
Goldman Sachs does and seeks to do business with companies covered in its research reports. As a result, investors should be aware that the fi rm may have a con fl ict of interest that could a ff ect the objectivity of this report. Investors should consider this report as only a single factor in making their investment decision. For Reg AC certi fi cation and other important disclosures, see the Disclosure Appendix, or go to www.gs.com/research/hedge.html. Analysts employed by non-US a ffi liates are not registered/quali fi ed as research e92c7a75ab8b4efbba794e6b187208c8
For the exclusive use of KEVINLU@LENOVO.COM
BUY
Yageo Corp. (2327.TW) Rating since Jun 22, 2020
Ratios & Valuation __________________________________________
| 12/25 | 12/26E | 12/27E | 12/28E | |
|---|---|---|---|---|
| P/E (X) | 13.4 | 49.3 | 27.8 | 18.2 |
| P/B (X) | 1.9 | 11.2 | 9.4 | 7.5 |
| FCF yield (%) | 7.8 | 1.6 | 2.6 | 4.4 |
| EV/EBITD A R(X) | 9.6 | 34.1 | 20.1 | 13.3 |
| EV/EBITD A (excl. leases) (X) | 9.6 | 34.1 | 20.1 | 13.3 |
| CROCI (%) | 9.5 | 13.6 | 21.8 | 30.9 |
| ROE (%) | 14.3 | 24.0 | 36.7 | 45.8 |
| Net debt/eq u ity (%) | 35.8 | 21.2 | 3.8 | (16.2) |
| Net debt/eq u ity (excl. leases) (%) | 35.8 | 21.2 | 3.8 | (16.2) |
| I n te r est c ov e r (X) | 10.4 | 17.7 | 31.7 | 48.4 |
| Days i nv e n t or y ou tst , sales | 81.6 | 59.2 | 47.3 | 44.9 |
| Recei v able days | 76.3 | 73.3 | 75.6 | 78.6 |
| Days p ayable ou tsta n di ng | 71.1 | 63.6 | 62.2 | 64.5 |
| D u P on t ROE (%) | 13.6 | 22.3 | 33.2 | 40.8 |
| T urnov e r (X) | 0.3 | 0.5 | 0.6 | 0.7 |
| L e v e r a g e (X) | 2.2 | 2.2 | 2.1 | 2.0 |
| Gro ss cas h i nv ested (ex cas h ) (NT $ ) | 367 , 675.4 | 378 , 066.1 | 393 , 402.5 | 405 , 759.7 |
| Av e r a g e ca p ital e mp l o yed (NT $ ) | 232 , 763.5 | 236 , 363.4 | 238 , 536.9 | 241 , 244.5 |
| BVP S (NT $ ) | 83.22 | 93.40 | 111.38 | 138.82 |
Growth & Margins (%) ______________________________________
| 12/25 | 12/26E | 12/27E | 12/28E | |
|---|---|---|---|---|
| Total revenue growth | 9.3 | 48 | 47.2 | 34.1 |
| EBITDA growth | 20.1 | 61.8 | 67.3 | 47.5 |
| EPS growth | (69.8) | 84.3 | 77 | 52.6 |
| DPS growth | (70.0) | 84.3 | 77 | 52.6 |
| EBIT margin | 22.4 | 27.3 | 33.3 | 37.8 |
| EBITDA margin | 29.8 | 32.6 | 37.1 | 40.8 |
| Net income margin | 17.8 | 22.1 | 26.6 | 30.3 |
Price Performance __________________________________________
| 3m | 6m | 1 2m | |
|---|---|---|---|
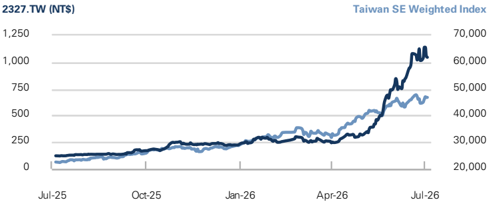
| Absolute | 324.8% | 333.6% | 736.8% |
| Rel. to the TaiwanSE Weighted Index | 195.8% | 172.0% | 306.3% |
Source: FactSet. Price as of 3 Jul 2026 close.
Income Statement (NT$ mn) ________________________________
| 12/25 | 12/26E | 12/27E | 12/28E | |
|---|---|---|---|---|
| Tota l r e v e nu e | 13 2 ,930.0 | 196,764.5 | 2 89,670.6 | 388,444.8 |
| Cost of goods sold | (84,800. 2 ) | (117,44 2 .3) | (156,769.5) | (19 2 ,349.6) |
| SG&A | (14,910.4) | -- | -- | -- |
| R&D | (3,418.7) | 0.0 | 0.0 | 0.0 |
| Other operating inc./(exp.) | 0.0 | ( 2 5,587.4) | (36,551.0) 1 | (49,093. 2 ) |
| E BITDA Depreciation& amortization | 39, 6 34. 5 | 6 4, 1 39. 7 (10,404.9) | 0 7 ,3 25 .3 (10,975.3) | 158 ,30 5 .3 (11,303.1) |
| E BIT | (9,833.8) 2 9, 8 00. 7 | 5 3, 7 34. 8 | 9 6 ,3 5 0.0 | 1 4 7 ,00 2 . 1 |
| Net interest inc./(exp.) | 1,570.7 | 2 ,878.9 | 4,403.6 | 6,776.4 |
| Income/(loss) from associates | 0.0 | 1,013.8 | 74 2 .7 | 2 79.6 |
| Pre-tax pro fi t | 3 1 , 11 9. 7 | 56 , 126 . 6 | 9 8 ,4 7 0. 8 | 1 4 8 , 65 9. 7 |
| Provision for taxes | (7,34 2 .8) | (1 2 ,447.4) | ( 2 1, 2 55.9) | (30,869.1) |
| Minority interest | (14 2 .6) | (1 2 6.7) | (1 2 0.0) | (1 2 0.0) |
| Preferred dividends N et inc . ( pre-ex c ept i ls) | -- | -- | -- | |
| o n a Post-tax exceptionals N et inc . ( po s t-ex c ept i o | 2 3, 6 34. 2 -- 2 3, 6 34. 2 | 43, 552 . 5 -- 43, 552 . 5 | 77 ,094.9 -- 77 ,094.9 | -- 117 , 67 0. 6 -- 117 , 67 0. 6 |
| n a ls) E P S(b a sic , pre-ex c ept ) (N T $) E P S(dilu te d , pre-ex c ept ) (N T E P S(b a sic , po s t-ex c ept ) (N T | 11 . 51 11 . 11 . | ______ 11.06 5 2 .1 12/26E | 3 7 . 56 3 7 . 56 19.58 5 2 .1 | 57 .3 2 57 .3 2 57 .3 2 |
| $) $) | 11 . 51 51 | 21 . 22 21 . 22 21 . 22 21 . 22 | 3 7 . 56 3 7 . 56 | 57 .3 2 |
| E P S(dilu te d , po s t-ex c ept ) (N T $) | 51 6.00 | 2 | ||
| DPS (NT$) | 5 2 .1 | 9.88 5 2 .1 | ||
| Div. payout ratio | ||||
| (%) | ||||
| Balance Sheet (NT$ mn) | 12/25 81,473.5 | 102,463.7 | 12/27E 135,129.1 | 12/28E 190,526.0 95,780.9 |
| C a sh& c a sh equiv a lents Accounts receiv a ble Inventory | 30,509.6 31,635.6 | 48,517.3 32,176.0 | 71,425.6 42,950.6 | 52,698.5 |
| Other current a ssets | 21,727.1 | 21,727.1 | 21,727.1 | 21,727.1 |
| Total current assets | 165 , 3 4 5 . 8 | 20 4, 88 4. 1 | 271 , 232 . 5 | 360 , 732 . 6 |
| Net PP&E | 65,304.8 | 58,044.0 | 53,800.6 | |
| Net int a ngibles | 106,699.8 | 61,959.6 105,696.2 | 104,692.5 | 103,688.8 |
| Tot a l investments Other long-term a | 45,202.5 8,236.2 | 46,216.3 8,236.2 | 46,959.0 8,236.2 | 47,238.6 |
| ssets | 8,236.2 | |||
| Total assets | 3 9 0 , 78 9. 2 | 4 26 ,99 2 .4 | 4 8 9, 16 4. 2 | 573 , 6 9 6 . 8 |
| Accounts p a y a ble Short-term debt | 18,031.4 86,258.7 | 22,875.5 86,258.7 | 30,535.7 | |
| -- | -- | 86,258.7 -- | 37,466.0 86,258.7 -- | |
| Short-term le a se li a bilities Other current li a bilities liabilities | 31,789.3 136 , 07 9.4 | 42,172.3 151 , 306 . 5 | 59,657.4 176 ,4 51 . 8 57,588.8 | 80,808.9 20 4, 533 . 6 57,588.8 |
| Total current Long-term debt | 57,588.8 | |||
| Long-term le a se li a bilities | 57,588.8 -- | -- | -- 23,124.5 | -- 23,124.5 |
| Other long-term li a bilities Total long-term liabilities | 23,124.5 80 , 713 . 216 , 7 9 2 . | 23,124.5 80 , 713 . 2 232 , 01 9. 8 | 80 , 713 . 257 , 165 . | 80 , 713 . 285 , 2 4 6 . |
| Total liabilities | 2 6 | 2 0 | 2 8 | |
| Preferred sh a res | -- | -- | -- | -- |
| Tot a l commonequity Minority interest | 170,877.8 3 , 118 . 7 | 191,727.1 3 , 2 4 5 .4 | 228,633.7 3 , 365 .4 | 284,964.6 3 ,4 85 .4 573 , 6 9 6 . 8 |
| Total liabilities &equity | 3 9 0 , 78 9. 2 62,374.0 | 4 26 ,99 2 .4 | 4 8 9, 16 4. 2 8,718.3 | |
| Net debt, a djusted | ||||
| mn) | ||||
| 41,383.8 | ||||
| Cash Flow (NT$ | 12/25 | 12/26E | 12/27E | __________ (46,678.5) 12/28E |
| Net income D&Aadd-back | 23,634 . 2 9,833 . 8 142 . 6 (5,002 . 1) | 43,552 . 5 10,404 . 9 126 . 7 (13,704 . 0) | 77,094 . 9 10,975 . 3 120 . 0 (26,022 . 7) | 117,670 . 6 11,303 . 1 120 . 0 . 9) |
| Minority interest add-back Net (inc)/dec working Other operating cash flow | 2,254 . 6 30, 86 3. 1 | (1,013 . 8) 39,3 66 .4 | (742 . 7) 61 ,4 2 4. | (27,172 (279 . 6) 1 0 1 , 6 4 1 . 2 |
| capital Cash flow fro m | ||||
| operations | ||||
| 7 | (6,056 . 0) | |||
| Capital expenditures Acquisitions | (6,056 . 0) 21,996 . | (6,056 . 0) -- | (6,056 . 0) -- | -- |
| Divestitures | 0 1,344 . 3 | -- | -- -- | |
| Others Cash flow fro m | . 6) | -- | ||
| investing | (21,009 (3, 725 .3) | -- ( 56 .0) | -- ,0 56 .0) | ( 6 56 .0) |
| Repayment of lease liabilities | -- | ( 6 | ,0 -- | |
| 6 ,0 | -- | . 3) | ||
| Dividends paid(common& pref) | -- (10,265 . 2) | (12,320 . 1) | (22,703 . 2) | (40,188 -- |
| Inc/(dec) in debt Other financing cash flows | 89,213 . 2 (85,730 . 0) ( 6 , 782 .0) | -- 0 . 0 ) | -- 0 . 0 ) | 0 . 0 188 .3) |
| Cash flow fro m financing Total cash flow | 2 0,3 55 .9 | ( 12 ,3 2 0. 1 2 0,990. 2 | ( 22 , 7 03. 2 3 2 , 665 .4 | (40, 55 ,39 6 .9 |
| 1 | ||||
| 55,368 . 7 | ||||
| 33,310 . | 95,585 . 2 | |||
| Free cash flow | 24,807 . | 3 |
Source: Company data, Goldman Sachs Research estimates.
e92c7a75ab8b4efbba794e6b187208c8
cxmble l Major Mecup cycles, down cycles Ill last two deldues
60%
50%
40%
30%
20%
10%
0%
-10%
-20%
OPM
For the exclusive use of KEVINLU@LENOVO.COM
excess inventory
Jan-99
- Yageo
Notebook, color feature phone
of
Smartphone boom
Yen appre-
MLCC industry analysis - Commodity MLCC should see a much better pricing outlook, as suppliers are all transferring commodity capacity into AI grade capacity inventories
(2004-2006)
(auto, loT, new
Consumer electornics
growth driven by
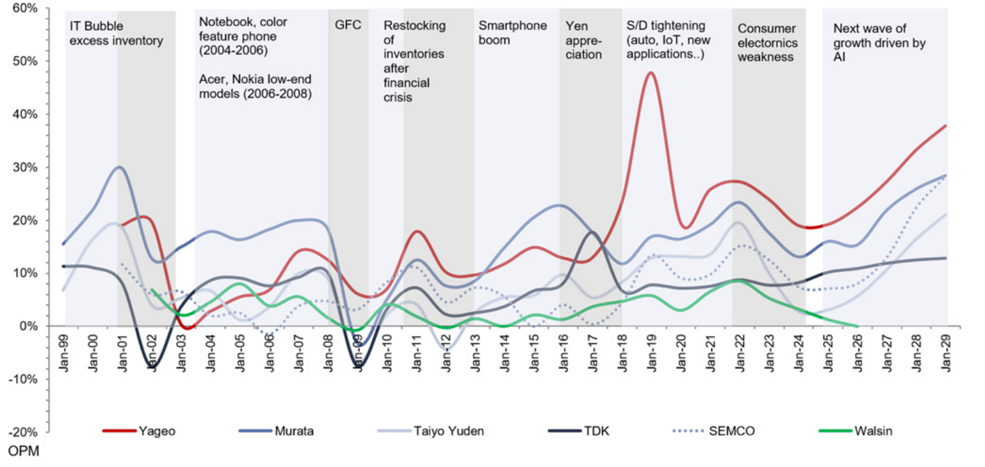
We believe the next upcycle for the MLCC industry will be driven by AI, in order to meet with the strong AI demand, and major JP/KR MLCC suppliers continuing to shift capacity towards AI applications, which should tighten commodity MLCC supply and lead to full utilization and a more favorable pricing environment. We expect the pricing hike ratio for commodity products to surpass the high-end due to their lower margin and diverse customer base, o ff ering more room for price increases.
AI will be a key driver for global MLCC TAM
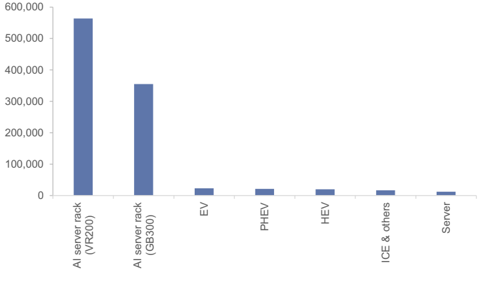
We expect global MLCC TAM to reach 33% CAGR over 2025-28E, with AI MLCC TAM tracking faster at 93% CAGR and reaching 19% of total global MLCC TAM in 2028E (from 6% in 2025). The strong demand for AI MLCC should be supported by both higher server shipment volumes and a signi fi cant increase in MLCC content per server (we expect MLCC to reach 300K+/500K+ for GB300/VR200 vs. 12k for general server).
Exhibit 1: Major MLCC up cycles / down cycles in last two decades
Source: Company data, Goldman Sachs Global Investment Research
GFC
Restocking
S/D tightening e92c7a75ab8b4efbba794e6b187208c8
For the exclusive use of KEVINLU@LENOVO.COM
Exhibit 2: AI to drive MLCC TAM expansion through 2025-28E
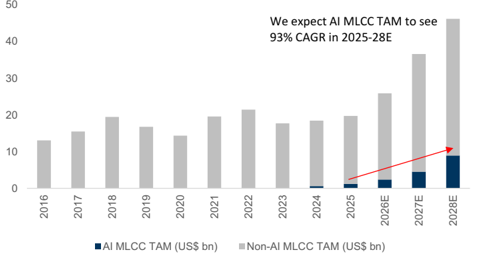
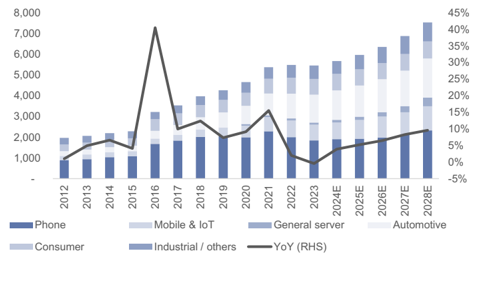
Exhibit 3: Smartphone and automotive continues to drive non-AI MLCC demand
Source: Goldman Sachs Global Investment Research, Company data
Source: Goldman Sachs Global Investment Research, Company data
Non-AI MLCC remains a stable market
We expect non-AI MLCC volume to see a stable CAGR of 9% in 2025-28E, continuing to be supported by both automotive and smartphone, with CAGR of 8%/7% in 2025-28E, respectively. We view the automotive MLCC segment as a key sector as it accounts for 20%+ of total non-AI MLCC through 2025-28E, with the level of MLCC consumption to be notably higher than other non-AI segments (e.g. 20k+ on average vs. ~2K for smartphones and ~2.5K on average for desktop PCs). Smartphone accounts for 25%+ of total non-AI MLCC through 2025-28E, with shipments continuing to be impacted by high memory costs (see here), while the content-per-box increase has largely o ff set the negative impact. We also expect segments such as PCs and servers continuing to see content-per-box increases.
Exhibit 4: MLCC content per device (including power) comparison
Source: Goldman Sachs Global Investment Research
Source: Goldman Sachs Global Investment Research, Company data
Major suppliers shifting capacity toward AI application to meet the strong demand
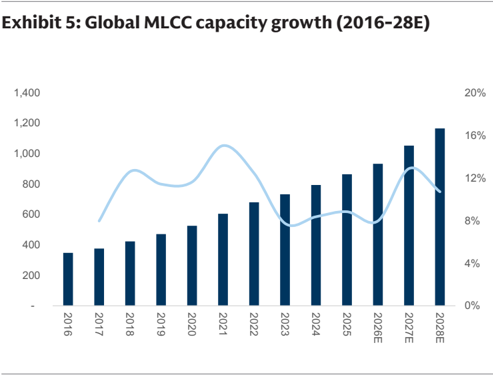
We believe annual capacity for the MLCC industry will see a stable increase of around 10% per year through 2026-28E, while the capacity expansion plans for major MLCC suppliers will outpace the market with double digit YoY expansion. Other than the stable capacity expansion, we continue to see major JP/KR suppliers continuing to shift capacity toward AI applications in order to meet the strong AI demand. Also, major MLCC suppliers are prioritizing AI-related orders due to their better margin pro fi les, e92c7a75ab8b4efbba794e6b187208c8
LULI TUT
120%
Non-Al capacity (bn units/ month)
Yageo
Non-Al supply growth rate
Non-Al demand growth rate
100%
Theoretic al UTR
Acutal UTR
Inventory build / access demand
Inventory volume (bn units)
80%
60%
40%
20%
0%
For the exclusive use of KEVINLU@LENOVO.COM
E-glass
2018
45
413
13%
2019
54
460
11%
2020
58
513
12%
2021
62
593
15%
2022
62
668
13%
2023
71
720
8%
2024
80
762
6%
2025
80
786
3%
2026E
80
798
1%
2027E
0%
2028E
0%
which may mean they will start considering taking on more orders from non-AI segments. 74% (684) 81% (432) 71% (545) 62% (719) 70% 45 75% 338 82% 714 97% 1,449 100% 876
Commodity MLCC to see price hikes driven by the tightened supply 474
571
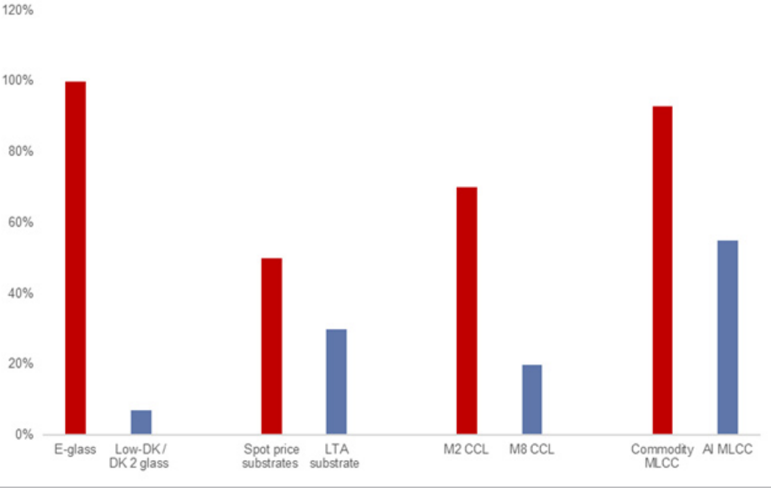
The industry shift in capacity expansion toward AI is also constructive for the commodity MLCC segment, as the segment is more sensitive to supply demand conditions. More capacity dedicated to AI MLCCs e ff ectively tightens the supply available for commodity MLCCs, and we forecast the global non-AI MLCC industry utilization rate to revert to 97%/100% in 2027/28E, similar to the level of last peak of 94/99% in 2017/18. This creates a more favorable pricing environment for commodity MLCCs. Given that AI MLCC already enjoy higher margins and are mainly focused on bigger customers with contracts, its relatively di ffi cult for them to adopt aggressive pricing adjustments, and we believe commodity product pricing hike ratios are likely to surpass the high-end MLCC products (Exhibit 7).
Low-DK/
DK 2 glass
2017
37
367
8%
11%
92%
94%
108
108
Spot price
Exhibit 6: Non-AI MLCC industry utilization rate to be to 97/100% in 2027/28E
Source: Goldman Sachs Global Investment Research, Company data
Exhibit 7: We expect low-end product pricing hike ratio to surpass high-end, due to the capacity transformation into high-end driven by AI technology migration demand 2027 YoY
Source: Company data, Goldman Sachs Global Investment Research
e92c7a75ab8b4efbba794e6b187208c8
For the exclusive use of KEVINLU@LENOVO.COM
Yageo is in a good position to bene fi t from the solid commodity MLCC pricing hike
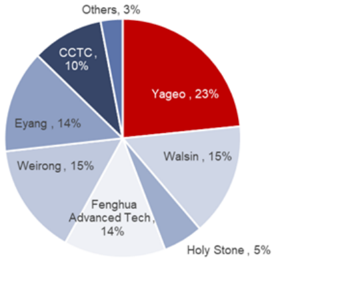
As mentioned above, we do expect the commodity MLCC product pricing to rise much faster than the industry MLCC pricing hike level, which should bene fi t Yageo the most in the overall MLCC supply chain, as its commodity MLCC accounts for more than 72%/85% of its total MLCC revenue in 2026/27 (vs. all other JP/KR players, which are all focusing on high-end / AI grade MLCC) with a 23% capacity share in the commodity MLCC market in 2026 (the single largest commodity MLCC capacity holder, while the second largest supplier's capacity only holds 15% of the industry capacity; Exhibit 10).
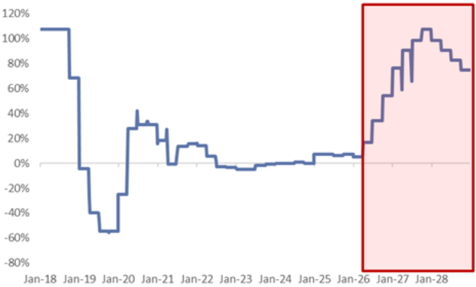
Yageo to bene fi t the most from the commodity MLCC pricing hike; we expect the company to enjoy a 29/93/84% YoY pricing upside in 2026/27/28E
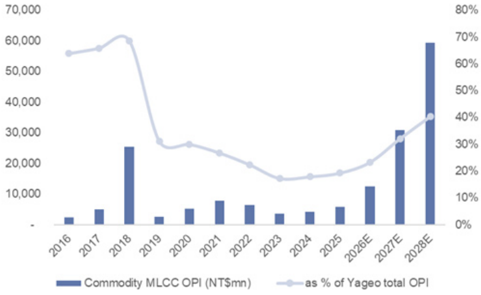
For Yageo's MLCC business, only ~10% is related to the AI server industry today, which mostly is not covered by LTA or any agreement and is covered by distributors; moreover, ~72%/85/90% of the MLCC revenue will be contributed by commodity business in 2026/27/28, or 23/32/40% of the company's overall GP in 2026/27/28, based on GSe (vs. 20% in the past 5 years; Exhibit 8).
We now expect Yageo's commodity MLCC pricing to go up by 29%/93%/84% YoY in 2026/27/28E vs. -5%~+10% YoY in 2022-25 (Exhibit 9), which was not only driven by the company leadership position in the commodity MLCC market, but also its high capacity share and good relationship with distributors, making the company able to control its utilization rate and industry inventory levels to help with pricing hike progress.
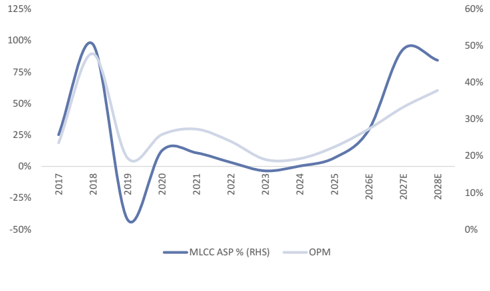
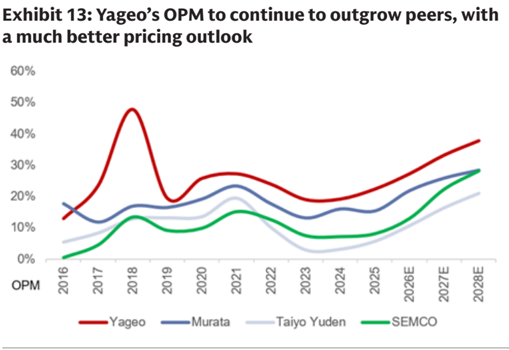
On the margin side, as we see no signi fi cant cost hike from key components; we believe the commodity MLCC pricing hike from 2H26 should directly improve the company's overall pro fi tability and absolute pro fi t level in coming years, which should boost the company's overall OPM from the last trough level at 19% in 2023 or 22% in 2025 directly to 27.3%/33.3%/37.8% in 2026/27/28E (Exhibit 11). We believe the OPM expansion speed this time will be more sustainable than in 2017-18 (this time we believe the pricing uptrend period should last for at least 30 months if AI demand doesn't slow down in the next 30 months), thanks to the expanding demand from AI, and key high-end suppliers' focus on expanding high capacity MLCC, allowing the second tier players like Yageo to bene fi t from the pricing/margin tailwind in coming years.
e92c7a75ab8b4efbba794e6b187208c8
maustry Capacity In 4uzo
70,000
60,000
50,000
40,000
30,000
20,000
10,000
. . .
80%
70%
60%
Tageus Mece pricmo rot trenu
120%
100%
80%
60%
Others, 3%
сстС,
Exhibit 8: Commodity MLCC will contribute 23/32/40% of total Yageo OPI in 2026/27/28E, up from 20% in the past 5 years 50% 30% 0%
10%
Weirong, 15%
20%
Walsin, 15%
Source: Company data, Goldman Sachs Global Investment Research
For the exclusive use of KEVINLU@LENOVO.COM
Exhibit 10: Yageo holds 23% of the commodity MLCC industry capacity in 2026
Source: Company data, Goldman Sachs Global Investment Research
Exhibit 9: We expect Yageo's MLCC pricing YoY will start to accelerate from 2H26 and continue in the next 24-30 months
Yageo's MLCC pricing YoY trend
Source: Company data, Goldman Sachs Global Investment Research
Exhibit 11: Yageo's commodity MLCC ASP trend vs. OPM
Source: Company data, Goldman Sachs Global Investment Research
Yageo should start outperforming JP/KR peers in revenue/margin growth outlook, thanks to the commodity MLCC pricing hike
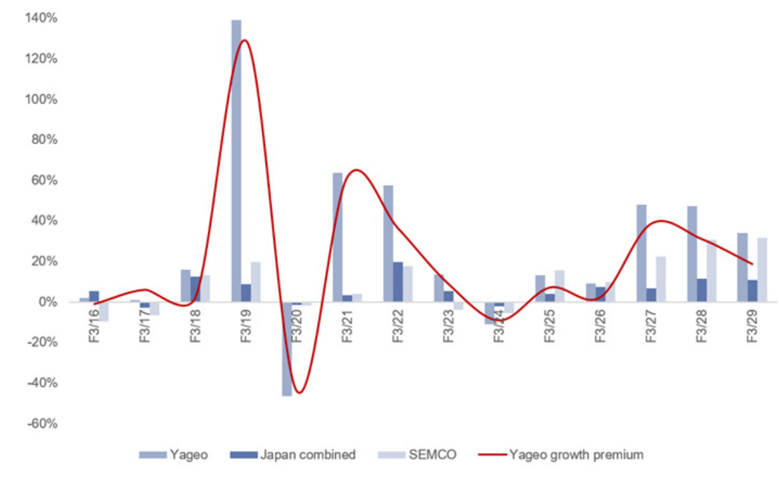
Like what we have seen in the past two cycles in the past 10 years, we believe Yageo will again start to outperform the high-end peers in JP/KR in coming years, due mainly to the much better than expected commodity pricing outlook (while we expect the high-end players' ASP to only grow by ~50% CAGR in next 3 years). We forecast Yageo's commodity MLCC pricing will grow by ~70% 2025-28E CAGR, which suggests Yageo's growth/margin growth premium vs. JP/KR peers will be in-line with the past 10-year upcycle period.
We expect Yageo's overall revenue to grow by 43% 2025-28E CAGR, with the OPM to expand by 15ppt from 2025 (22.4%) to 2028 (37.8%), while expecting the other JP/KR high-end players together to only enjoy a 14% 2025-28E revenue CAGR with the OPM only increasing from 10.0% in 2025 to 20.4% in 2028E.
-20%
e92c7a75ab8b4efbba794e6b187208c8
Clanks to the better prichs outlook a much better prichs outlook
140%
60%
50%
120%
40%
100%
30%
80%
20%
60%
10%
0%
40%
OPM
2016
20%
0%
-20%
-40%
-60%
For the exclusive use of KEVINLU@LENOVO.COM
2017
2018
— Yageo
F3/16
2019
2020
2021
—Murata
F3/18
• Yageo
F3/19
Exhibit 12: We believe Yageo will enjoy much better revenue growth than others from 2H26, thanks to the better pricing outlook
2022
2023
-Taiyo Yuden
F3/201
Source: Company data, Goldman Sachs Global Investment Research
Source: Company data, Goldman Sachs Global Investment Research
Earnings revision: Revising up 2026-28E EPS by 11-106% to factor in the better MLCC pricing outlook
Earnings revisions
We revise up our 2026/27/28E EPS by 11/49/106% to factor in better pricing conditions for commodity MLCC as well as better order visibility (we revise up 2026/27/28E revenue estimates by 6/26/54%). We expect the contribution to be margin accretive thus we revise up our 2026/27/28E GM by 0.9/4.7/8.9ppt.
e92c7a75ab8b4efbba794e6b187208c8
camble 19 camos revision lavie
Exmole 1. bur nanbers vo. Dioomuers consellsus
Yageo P&L (NTS mn)
Sales
Gross Profit
Revenue
EBIT
2026E New 2026E Old
2026E
196,765
184,798
Consensus
Diff (%)
196,765
79,322
53,735
166,358
Exhibit 14: Earnings revision table
Operating profits
Net earnings
Ratio analysis
Gross margin
EBIT margin
EPS, NT$
Net margin
Gross margin (%)
EBIT margin (%)
Net margin (%)
72,789
48,333
Diff.
6%
9%
2027E New 2027E Old
2027E
289,671
230,448
132,901
GS est,
Consensus
Diff.
26%
40%
Diff (%)
289,671
11%
18%
39,255
11%
11%
96,350
219,069
132,901
77.095
94,832
65,206
51,867
2028E New
2028E
388,445
196,095
GS est,
32%
48%
147,002
388.445
49%
43%
25.27
196,095
49%
117,671
57.32
2028E Old
72,825
267.065
57,208
123,187
27.87
Diff.
45%
102%
59%
106%
www
22%
93,094
37.56
| 53,735 | 43,591 | 23% 96,350 | 68,675 | 40% 147,002 | 92,021 | 60% | ||
|---|---|---|---|---|---|---|---|---|
| 43,553 | 40.3% 39.4% 35,291 | 0.9pp 23% 77,095 | 45.9% | 41.2% 54,777 | 4.7pp 41% 117,671 | 50.5% | 41.6% 75,232 | 8.9p.p 56% |
| 21.22 | 27.3% 26.2% 17.16 | 1.2pp 24% 37.56 | 33.3% | 28.3% 26.98 | 5.0pp 39% | 37.8% 57.32 | 28.8% 36.53 | 9.0pp 57% |
| 40.3% | 22.1% 21.2% 39.0% | 0.9pp 45.9% | 26.6% | 22.5% 42.5% | 4.1pp | 30.3% 50.5% | 22.7% 46.1% | 7.6pp |
| 26.2% 1.3ppt | 3.4ppt | 4.4ppt | ||||||
| 27.3% | 1.1ppt | 33.3% | 31.3% | 1.9ppt | 37.8% | 34.5% | 3.4ppt | |
| 21.2% | 0.9ppt 26.6% | 25.0% | 1.6ppt | 30.3% | 28.2% | 2.1ppt |
Source: Company data, Goldman Sachs Global Investment Research
Where are we vs. consensus?
Our 2026/27/28E revenue estimates are 18/32/45% higher than Bloomberg consensus, due to our positive view on the better pricing for commodity MLCC, which we expect to increase 15-20% in each quarter throughout 2027/28 (BBG consensus only implies ~10% per quarter pricing hike). As such, considering the better operating leverage driven by price hikes, our 2026/27/28E GM estimate is 1.3/3.4/4.4ppt higher than Bloomberg consensus, as we believe the company's revenue will be mainly driven by MLCC in the coming years (35%/45%/53% revenue contribution in 2026/27/28E).
Exhibit 15: Our numbers vs. Bloomberg consensus
Source: Bloomberg, Goldman Sachs Global Investment Research
106%
19.12
For the exclusive use of KEVINLU@LENOVO.COM
e92c7a75ab8b4efbba794e6b187208c8
NTSmn
Revenue
Gross profit
Operating expense
Operating income
Pretax income
Taxes expense
Net income
1Q25
(4,623)
6,463
2Q25
(4,609)
7,044
3Q25
33,087
11.974
(4,412)
7,562
7,173
8,212
7,028
Exhibit 16: P&L table
EPS, NTS
Ratio analysis and assumption
As % of sales
Gross margin
Operating expense ratio
Operating margin
Net margin
QoQ growth (%)
2Q26E
44,653
17,844
(5,983)
11,861
12,431
(2,739)
9,662
4025
35,968
13.417
(4,664)
8,753
8,727
(1,904)
6,768
1Q27E
62,822
27,254
(7,906)
19,349
19,869
(4,383)
15,456
4Q26E
58,666
24,483
(7,417)
17,066
17,656
(3,928)
13,698
3Q26E
55,280
22,453
(7,291)
15,163
15,683
(3,487)
12,165
2Q27E
69,318
31,363
(8,831)
22,532
23,102
(5,032)
18,040
3Q27E
76,935
35,746
(9,605)
26,141
26,661
(5,703)
20,928
4Q27E
80,596
38,537
(10,209)
28,328
28,839
(6,138)
22,671
2024
121,667
41,803
(18,377)
23,427
26,906
(7,376)
19,398
2025
132,930
48,130
(18,307)
29,822
31,140
(7,346)
23,652
2026E
196,765
79,322
(25,587)
53,735
56,127
(12,447)
43,553
2027E
289.671
(36,551)
96,350
98,471
(21,256)
77,095
2028E
388,445
(49,093)
147,002
148,660
(30,869)
117,671
| 2.69 | 2.43 3.10 | 3.30 | 4.71 | 5.93 | 6.68 | 7.53 | 8.79 | 10.20 | 11.05 | 9.50 | 11.52 | 21.22 | 37.56 | 57.32 | |
|---|---|---|---|---|---|---|---|---|---|---|---|---|---|---|---|
| 35.6% | 35.6% 36.2% | 37.3% | 38.1% | 40.0% | 40.6% | 41.7% | 43.4% | 45.2% | 46.5% | 47.8% | 34.4% | 36.2% | 40.3% | 45.9% | 50.5% |
| 14.9% | 14.1% 13.3% | 13.0% | 12.8% | 13.4% | 13.2% | 12.6% | 12.6% | 12.7% | 12.5% | 12.7% | 15.1% | 13.8% | 13.0% | 12.6% | 12.6% |
| 20.8% | 21.5% 22.9% | 24.3% | 25.3% | 26.6% | 27.4% | 29.1% | 30.8% | 32.5% | 34.0% | 35.1% | 19.3% | 22.4% | 27.3% | 33.3% | 37.8% |
| 17.8% | 15.3% 19.2% | 18.8% | 21.0% | 21.6% | 22.0% | 23.3% 24.6% | 26.0% | 27.2% | 28.1% | 15.9% | 17.8% | 22.1% | 26.6% | 30.3% |
Revenue
Gross profit
Operating income
Net income
YoY growth (%)
Revenue
Gross profit
Operating income
Net income
5.4%
7.1%
6.1%
1.0%
10.3%
11.0%
4.8%
| 11.4% 5.1% 2.8% 12.1% 8.4% 22.7% 25.8% 9.0% 11.3% 15.1% 14.0% 7.8% | 11.4% 5.1% 2.8% 12.1% 8.4% 22.7% 25.8% 9.0% 11.3% 15.1% 14.0% 7.8% | 11.4% 5.1% 2.8% 12.1% 8.4% 22.7% 25.8% 9.0% 11.3% 15.1% 14.0% 7.8% | 11.4% 5.1% 2.8% 12.1% 8.4% 22.7% 25.8% 9.0% 11.3% 15.1% 14.0% 7.8% | 11.4% 5.1% 2.8% 12.1% 8.4% 22.7% 25.8% 9.0% 11.3% 15.1% 14.0% 7.8% | 11.4% 5.1% 2.8% 12.1% 8.4% 22.7% 25.8% 9.0% 11.3% 15.1% 14.0% 7.8% | 11.4% 5.1% 2.8% 12.1% 8.4% 22.7% 25.8% 9.0% 11.3% 15.1% 14.0% 7.8% | 11.4% 5.1% 2.8% 12.1% 8.4% 22.7% 25.8% 9.0% 11.3% 15.1% 14.0% 7.8% | 11.4% 5.1% 2.8% 12.1% 8.4% 22.7% 25.8% 9.0% 11.3% 15.1% 14.0% 7.8% | 11.4% 5.1% 2.8% 12.1% 8.4% 22.7% 25.8% 9.0% 11.3% 15.1% 14.0% 7.8% | 11.4% 5.1% 2.8% 12.1% 8.4% 22.7% 25.8% 9.0% 11.3% 15.1% 14.0% 7.8% | 11.4% 5.1% 2.8% 12.1% 8.4% 22.7% 25.8% 9.0% 11.3% 15.1% 14.0% 7.8% | 11.4% 5.1% 2.8% 12.1% 8.4% 22.7% 25.8% 9.0% 11.3% 15.1% 14.0% 7.8% | |||||
|---|---|---|---|---|---|---|---|---|---|---|---|---|---|---|---|---|---|
| 20.5% 9.0% 7.4% 15.8% 10.2% 23.0% 27.8% 12.6% 13.4% 16.5% 16.0% 8.4% | 20.5% 9.0% 7.4% 15.8% 10.2% 23.0% 27.8% 12.6% 13.4% 16.5% 16.0% 8.4% | 20.5% 9.0% 7.4% 15.8% 10.2% 23.0% 27.8% 12.6% 13.4% 16.5% 16.0% 8.4% | 20.5% 9.0% 7.4% 15.8% 10.2% 23.0% 27.8% 12.6% 13.4% 16.5% 16.0% 8.4% | 20.5% 9.0% 7.4% 15.8% 10.2% 23.0% 27.8% 12.6% 13.4% 16.5% 16.0% 8.4% | 20.5% 9.0% 7.4% 15.8% 10.2% 23.0% 27.8% 12.6% 13.4% 16.5% 16.0% 8.4% | 20.5% 9.0% 7.4% 15.8% 10.2% 23.0% 27.8% 12.6% 13.4% 16.5% 16.0% 8.4% | 20.5% 9.0% 7.4% 15.8% 10.2% 23.0% 27.8% 12.6% 13.4% 16.5% 16.0% 8.4% | 20.5% 9.0% 7.4% 15.8% 10.2% 23.0% 27.8% 12.6% 13.4% 16.5% 16.0% 8.4% | 20.5% 9.0% 7.4% 15.8% 10.2% 23.0% 27.8% 12.6% 13.4% 16.5% 16.0% 8.4% | 20.5% 9.0% 7.4% 15.8% 10.2% 23.0% 27.8% 12.6% 13.4% 16.5% 16.0% 8.4% | 20.5% 9.0% 7.4% 15.8% 10.2% 23.0% 27.8% 12.6% 13.4% 16.5% 16.0% 8.4% | 20.5% 9.0% 7.4% 15.8% 10.2% 23.0% 27.8% 12.6% 13.4% 16.5% 16.0% 8.4% | |||||
| 49.1% | -9.6% 27.2% | 6.5% | 18.6% | 20.4% | 25.9% | 12.6% | 12.8% | 16.7% | 16.0% | 8.3% | |||||||
| 9.1% | 4.3% 4.3% | 19.9% | 22.7% | 36.3% | 67.1% | 63.1% | 64.6% | 55.2% | 39.2% | 37.4% | 13% | 9% | 48% | 47% | 34% | ||
| 15.1% | 5.6% 7.1% | 34.8% | 31.2% | 53.1% | 87.5% | 82 5% | 87.4% | 75.8% | 59.2% | 57.4% | 16% | 15% | 65% | 68% | 48% | ||
| 30.8% 8.7% 14.0% 63.1% 49.2% 68.4% 100.5% 95.0% 100.6% 90.0% 72 4% 66.0% 14% 27% 80% 79% 53% | 30.8% 8.7% 14.0% 63.1% 49.2% 68.4% 100.5% 95.0% 100.6% 90.0% 72 4% 66.0% 14% 27% 80% 79% 53% | 30.8% 8.7% 14.0% 63.1% 49.2% 68.4% 100.5% 95.0% 100.6% 90.0% 72 4% 66.0% 14% 27% 80% 79% 53% | 30.8% 8.7% 14.0% 63.1% 49.2% 68.4% 100.5% 95.0% 100.6% 90.0% 72 4% 66.0% 14% 27% 80% 79% 53% | 30.8% 8.7% 14.0% 63.1% 49.2% 68.4% 100.5% 95.0% 100.6% 90.0% 72 4% 66.0% 14% 27% 80% 79% 53% | 30.8% 8.7% 14.0% 63.1% 49.2% 68.4% 100.5% 95.0% 100.6% 90.0% 72 4% 66.0% 14% 27% 80% 79% 53% | 30.8% 8.7% 14.0% 63.1% 49.2% 68.4% 100.5% 95.0% 100.6% 90.0% 72 4% 66.0% 14% 27% 80% 79% 53% | 30.8% 8.7% 14.0% 63.1% 49.2% 68.4% 100.5% 95.0% 100.6% 90.0% 72 4% 66.0% 14% 27% 80% 79% 53% | 30.8% 8.7% 14.0% 63.1% 49.2% 68.4% 100.5% 95.0% 100.6% 90.0% 72 4% 66.0% 14% 27% 80% 79% 53% | 30.8% 8.7% 14.0% 63.1% 49.2% 68.4% 100.5% 95.0% 100.6% 90.0% 72 4% 66.0% 14% 27% 80% 79% 53% | 30.8% 8.7% 14.0% 63.1% 49.2% 68.4% 100.5% 95.0% 100.6% 90.0% 72 4% 66.0% 14% 27% 80% 79% 53% | 30.8% 8.7% 14.0% 63.1% 49.2% 68.4% 100.5% 95.0% 100.6% 90.0% 72 4% 66.0% 14% 27% 80% 79% 53% | 30.8% 8.7% 14.0% 63.1% 49.2% 68.4% 100.5% 95.0% 100.6% 90.0% 72 4% 66.0% 14% 27% 80% 79% 53% | 30.8% 8.7% 14.0% 63.1% 49.2% 68.4% 100.5% 95.0% 100.6% 90.0% 72 4% 66.0% 14% 27% 80% 79% 53% | 30.8% 8.7% 14.0% 63.1% 49.2% 68.4% 100.5% 95.0% 100.6% 90.0% 72 4% 66.0% 14% 27% 80% 79% 53% | 30.8% 8.7% 14.0% 63.1% 49.2% 68.4% 100.5% 95.0% 100.6% 90.0% 72 4% 66.0% 14% 27% 80% 79% 53% | 30.8% 8.7% 14.0% 63.1% 49.2% 68.4% 100.5% 95.0% 100.6% 90.0% 72 4% 66.0% 14% 27% 80% 79% 53% | 30.8% 8.7% 14.0% 63.1% 49.2% 68.4% 100.5% 95.0% 100.6% 90.0% 72 4% 66.0% 14% 27% 80% 79% 53% |
| 20.5% | -8.3% 12.5% | 82.5% | 45.2% | 93.3% | 91.4% | 102.4% | 92.6% | 86.7% | 72.0% | 65.5% | 11% | 22% | 84% | 77% | 53% |
Source: Company data, Goldman Sachs Global Investment Research
Valuation and risks - Raise TP to NT$1,490 with much better pricing visibility and sustainability
We reiterate our Buy rating on Yageo with a new TP of NT$1,490 (from NT$346), implying 43% upside. We believe the company will continue to deliver a solid earnings growth rate (83%+ 2025-28E EPS CAGR) which is much faster than MLCC industry peers (45% CAGR 2025-28).
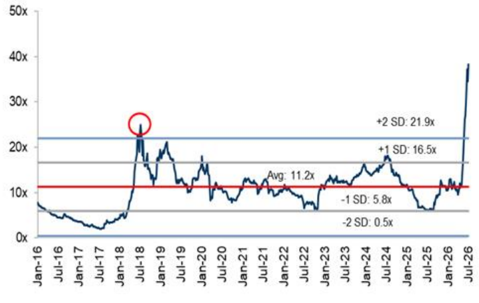
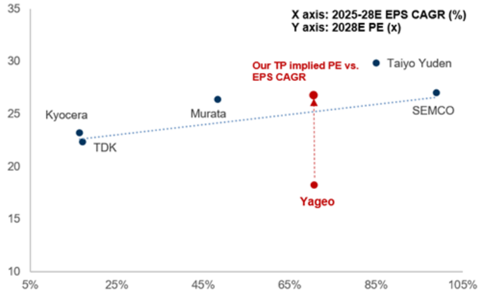
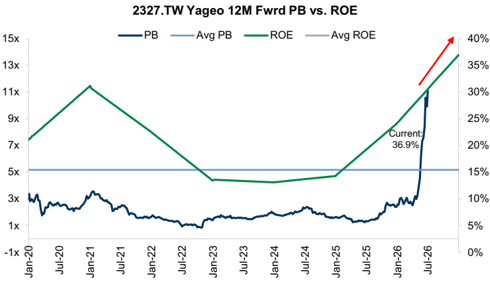
Our 12-month target price is based on a higher 26x PB/ROE (up from 15x previously), and we roll over our valuation base from 2H26-1H27E to 2028E to factor in the long visibility of the pricing upcycle this time (we expect demand will continue to be driven by the AI server related demand in at least the next 2.5-3 years). The 26x PB/ROE multiple is in line with the past 10-year peak multiple (Exhibit 17), and is in-line with the JP/KR MLCC suppliers' P/E multiples today, despite Yageo's fast earnings growth (Exhibit 19).
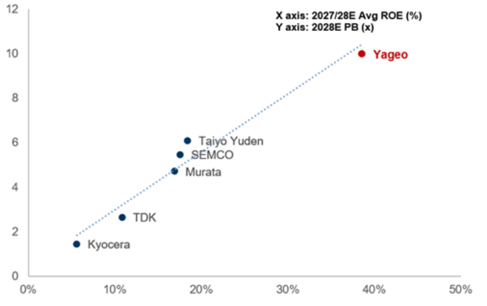
Our TP-implied 10.8x 2028E P/B is much higher than the company's average P/B multiple in the past (Exhibit 18); however, after considering the high ROE (increasing to 23%/36%/41% in 2026/27/28E based on GSe), we believe this higher implied multiple is justi fi ed as the company should be traded at a premium considering our forecast of its accelerating expansion in ROE in coming years.
Overall, considering the company's ongoing earnings expansion trend and the solid pricing outlook as well as the long S/D visibility (to end of 2028), we maintain our positive view on Yageo's fundamentals and stock price upside, and see a good opportunity for a valuation rerating if the company can continue to deliver good earnings performance. Reiterate our Buy rating on Yageo, with a new TP of NT$1,490.
3.7%
23.8%
8.7%
17.0%
For the exclusive use of KEVINLU@LENOVO.COM
6.1%
e92c7a75ab8b4efbba794e6b187208c8
I-m lor wara rD nor trend mthe past lu yedis
I comms quarters
50x
35
40x
30
30x
25
20x
20
10x
15
Ox
10
5%
For the exclusive use of KEVINLU@LENOVO.COM
Yaxis: 20252 PEERS CAR (%)
Our TP Implied PE vs. • Taiyo Yuder
EPS CAGR
Exhibit 17: Yageo's avg PB/ROE multiple in the past 10-years is at 11x, but peak multiple was 26x 12-m forward PB/ROE trend in the past 10 years
Jan-17
deliver a sond nor outlook a coms years
12
10
8
6
Source: Company data, Goldman Sachs Global Investment Research
Exhibit 19: We expect accelerating EPS growth for Yageo in coming years, suggesting a potential rerating opportunity in coming quarters
Source: Company data, Goldman Sachs Global Investment Research
Investment thesis and Valuation & Risks
Yageo, as the third largest MLCC and largest resistor / tantalum capacitor supplier globally, should see a stronger then peers earnings growth in the future, underpinned by better pricing environment, product upgrade, expansion strategy and more diversi fi ed product portfolio given the recent Kemet, Chilisin and Shibaura acquisitions. Yageo continues to penetrate into the high-end MLCC market (especially automotive/EV, industrial and high-end computing), which has a better S/D outlook compared to the commoditized market. Also, high-end MLCC market demand visibility is much clearer, with a more stable pricing trend, which suggests a less volatile earnings outlook. Yageo has started to bene fi t from an improving pricing environment for low-end MLCCs, driven by tightening supply. We hold a positive view on Yageo, given it is the supplier with the broadest product portfolio, which should help the company increase its market share by cross-selling and up-selling. Valuation o ff ers attractive risk-reward with shares trading below historical multiples. Key downside risks: (1) weaker inventory builds from OEMs; (2) softer IT end-demand; and (3) slower-than-expected integration of
X axis: 2027/28E Avg ROE (%
Yageo
Exhibit 18: The solid ROE uptrend suggests a much higher P/B multiple in the coming years
• SEMCO
• Murata
Source: Company data, Goldman Sachs Global Investment Research
Exhibit 20: The high P/B is slightly below industry linear regression (vs. ROE), and we expect the company will deliver a solid ROE outlook in coming years
Source: Company data, Goldman Sachs Global Investment Research
Jan-16
Jul-16
Y axis: 2028E PB (x e92c7a75ab8b4efbba794e6b187208c8
For the exclusive use of KEVINLU@LENOVO.COM
Kemet/Chilisin/Telemecanique/Shibaura.
Our 12m TP of NT$1,490 is based on a 26x average 2028E PB/ROE (in-line with the peak valuation historically and is in-line with JP peers' average 2027/28E PB/ROE). Key downside risks: (1) weaker inventory builds from OEMs; (2) softer IT end-demand; and (3) slower-than-expected integration of Kemet/Chilisin/Telemecanique/Shibaura.
e92c7a75ab8b4efbba794e6b187208c8
For the exclusive use of KEVINLU@LENOVO.COM
圖片清單(已驗證 2026-07-06)
| 檔名 | 大小 | 分類 | 內容摘要 |
|---|---|---|---|
| 2026-07-05 260705_gs_yageo_003.png | 270KB | 真資料圖 | MLCC 產業 OPM 趨勢,國巨 vs Murata/Taiyo Yuden/TDK/SEMCO/Walsin,Jan-99 至 Jan-29,標示主要漲跌循環 |
| 2026-07-05 260705_gs_yageo_005.png | 40KB | 真資料圖 | 非 AI MLCC 需求,按終端市場(手機/行動IoT/一般伺服器/車用/消費/工業)拆分,2012-2028E,長條+YoY 線 |
| 2026-07-05 260705_gs_yageo_009.png | 56KB | 真資料圖 | 國巨 Commodity MLCC 營業利益(NT$mn,長條)及佔總 OPI % 趨勢,2016-2028E;2028E commodity 佔比升至 ~40% |
| 2026-07-05 260705_gs_yageo_013.png | 98KB | 真資料圖 | 國巨 vs Japan combined vs SEMCO 營收成長率比較,F3/16–F3/29,附國巨 growth premium 折線 |
| 2026-07-05 260705_gs_yageo_014.png | 74KB | 真資料圖 | 國巨 OPM vs Murata/Taiyo Yuden/SEMCO 走勢,2016-2028E,顯示國巨持續拉開差距 |
| 2026-07-05 260705_gs_yageo_015.png | 81KB | 真資料圖 | 12M Fwd P/E 歷史走勢 Jan-16 至 Jul-26;平均 11.2x,+1SD 16.5x,+2SD 21.9x,-1SD 5.8x |
| 2026-07-05 260705_gs_yageo_017.png | 44KB | 真資料圖 | 12M Fwd PB vs ROE 折線,Jan-20 至 Jul-26;current ROE 36.9%,PB ~3x |
| 2026-07-05 260705_gs_yageo_019.png | 75KB | 裝飾 | GS 評等與目標價歷史圖(券商標準揭露用) |