PDF 原檔:報告_GS_啟碁6285_20260820_original.pdf
圖片清單(已驗證 2026-08-21)
分類為「真資料圖」者才可嵌入 lib/ 頁,圖說須照抄下表「親眼所見內容」。標「未驗證」者一律不得嵌入;若日後需要,須先逐張 Read 現場補驗。
| 檔名 | size | 分類 | 親眼所見內容 |
|---|---|---|---|
報告_GS_啟碁6285_20260820_001.png |
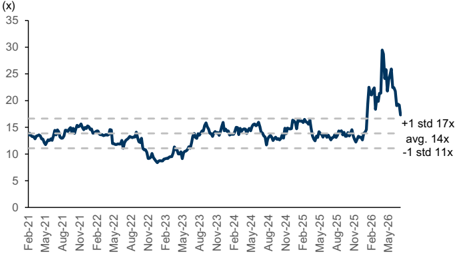
35KB | 真資料圖 | Exhibit 5:啟碁 12 個月遠期本益比走勢(2021/2–2026/5),標示 +1 std 17x、avg 14x、-1 std 11x;2026 年初起自約 12x 竄升至最高近 30x |
報告_GS_啟碁6285_20260820_002.png |
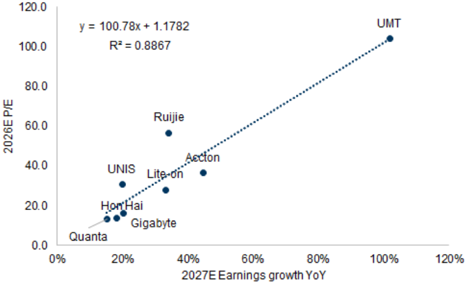
33KB | 真資料圖 | Exhibit 6:同業 2026E 本益比 vs 2027E EPS 年增率散布圖與迴歸線 y=100.78x+1.1782、R²=0.8867;標示 UMT、Ruijie、Accton、UNIS、Lite-on、Gigabyte、Hon Hai、Quanta |
報告_GS_啟碁6285_20260820_003.png |
74KB | 文字卡 | GS 揭露附錄:啟碁(6285.TW) 評等與目標價歷史圖,含歷次目標價數字與 NA/B 評等區間 |
原始內容
WNC (6285.TW): LEO satellites, 800G switch, WiFi 7, Automotive connectivity as key drivers ahead; 2Q26 beat; Buy
2Q26 beat: Revenues of NT$39bn (+35% QoQ, +43% YoY) was 27%/ 16% higher than GSe and Bloomberg consensus, and management attributes the strong growth to services operator (incl. LEO satellite solution), WiFi 7, and automotive connectivity. GM was overall in line at 13.0% in 2Q26 (vs. 11.6%/ 13.8% in 2Q25/ 1Q26). Opex ratio was better than expected at 7.8% vs. our and Bloomberg consensus at 9.3%/ 8.6%, supported by larger revenue scale and higher operational e ffi ciency. Looking ahead, we expect sequential revenue growth in coming months, driving 3Q26 revenues QoQ at +29%, driven by 800G switch, rising adoption of WiFi 7 and automotive connectivity (e.g. for unmanned cargo logistics, smart driving, Robotaxi), and ongoing LEO satellite launches. Maintain Buy.
Allen Chang
+852-2978-2930 | allen.k.chang@gs.com Goldman Sachs (Asia) L.L.C.
Verena Jeng
+852-2978-1681 | verena.jeng@gs.com Goldman Sachs (Asia) L.L.C.
Ting Song
+852-2978-6466 | ting.song@gs.com Goldman Sachs (Asia) L.L.C.
0e9a8f9023044ccc8559dea9c0453f9d
Exhibit 1: We expect WNC Aug 2026 revenues to grow 95% YoY to NT$16.9bn WNC quarterly and monthly revenues
| May 2026 | June 2026 | July 2026 | Aug 2026E | Sep 2026E | Oct 2026E | 1Q26 | 2Q26 | 3Q26E | |
|---|---|---|---|---|---|---|---|---|---|
| Rev (NT$m) | 12,168 | 15,870 | 16,913 | 16,913 | 17,016 | 17,356 | 29,156 | 39,438 | 50,842 |
| Rev YoY | 35% | 84% | 90% | 95% | 74% | 83% | 3% | 43% | 86% |
| Rev MoM/QoQ | 7% | 30% | 7% | 0% | 1% | 2% | 8% | 35% | 29% |
| GS estimates (NT$m) Act vs. GS |
Source: Company data, Goldman Sachs Global Investment Research
Exhibit 2: WNC 2Q26 result snapshot
| NT$m | 2Q25 | 1Q26 | 2Q26 | QoQ | YoY | GS | Act / GS | Cons. Act | / Cons. |
|---|---|---|---|---|---|---|---|---|---|
| Revenues | 27,491 | 29,156 | 39,438 | 35% | 43% | 31,021 | 27% | 33,875 | 16% |
| GP | 3,176 | 4,011 | 5,127 | 28% | 61% | 4,307 | 19% | 4,671 | 10% |
| OP | 879 | 1,362 | 2,070 | 52% | 136% | 1,412 | 47% | 1,773 | 17% |
| Net income | 493 | 1,132 | 1,630 | 44% | 230% | 1,097 | 49% | 1,400 | 16% |
| Margins | |||||||||
| GM | 11.6% | 13.8% | 13.0% | 13.9% | 13.8% | ||||
| OPM | 3.2% | 4.7% | 5.2% | 4.6% | 5.2% | ||||
| NM | 1.8% | 3.9% | 4.1% | 3.5% | 4.1% |
Source: Company data, Goldman Sachs Global Investment Research
Convertible Bond issuance plan announced: WNC announced its plan to issue the CB (Convertible Bond) at Rmb8bn on Aug 5th, supporting the company's expansion ahead and its Capex spending on the production sites (e.g. Vietnam). We remain positive on the company's LEO satellite business and new clients' expansion of the enterprise switch/ automotive market.
Earnings revision: We factor in WNC's 2Q26 result and revise up earnings by 18%/ 3%/ 3% in 2026-28E mainly on higher-than-expected revenues of enterprise and LEO satellite business with spec upgrade. We revise down GM by 0.4ppts~0.6ppts in 2026-28E on product mix changes.
Exhibit 3: Earnings revision
| 2026E | 2026E | 2026E | 2027E | 2027E | 2027E | 2028E | 2028E | 2028E | |
|---|---|---|---|---|---|---|---|---|---|
| NT$m | Old | New | Diff% | Old | New | Diff% | Old | New | Diff% |
| Revenues | 132,995 | 159,545 | 20% | 154,417 | 170,752 | 11% | 172,508 | 190,000 | 10% |
| GP | 18,468 | 21,283 | 15% | 21,044 | 22,504 | 7% | 23,560 | 25,064 | 6% |
| OP | 6,551 | 7,613 | 16% | 7,765 | 7,991 | 3% | 9,768 | 10,063 | 3% |
| Net income | 5,259 | 6,231 | 18% | 6,212 | 6,372 | 3% | 7,830 | 8,102 | 3% |
| Margins | |||||||||
| GM | 13.9% | 13.3% | 13.6% | 13.2% | 13.7% | 13.2% | |||
| OPM | 4.9% | 4.8% | 5.0% | 4.7% | 5.7% | 5.3% | |||
| NM | 4.0% | 3.9% | 4.0% | 3.7% | 4.5% | 4.3% |
Source: Company data, Goldman Sachs Global Investment Research
0e9a8f9023044ccc8559dea9c0453f9d
sowul
120.0
100.0
80.0
40.0
20.0
0.0
0%
R* = 0.8867
Exhibit 4: WNC P&L Summary
| NT$ mn | 2023 | 2024 | 2025 | 2026E | 2027E | 2028E | 1Q25 | 2Q25 | 3Q25 | 4Q25 | 1Q26 | 2Q26 | 3Q26E | 4Q26E |
|---|---|---|---|---|---|---|---|---|---|---|---|---|---|---|
| Income statement | ||||||||||||||
| Revenue | 110,788 | 110,213 | 110,251 | 159,545 | 170,752 | 190,000 | 28,366 | 27,491 | 27,378 | 27,015 | 29,156 | 39,438 | 50,842 | 40,109 |
| Gross profit | 13,594 | 13,381 | 13,762 | 21,283 | 22,504 | 25,064 | 3,462 | 3,176 | 3,319 | 3,805 | 4,011 | 5,127 | 6,820 | 5,325 |
| Selling expense | 3,277 | 3,264 | 3,219 | 4,447 | 4,610 | 4,646 | 758 | 730 | 824 | 907 | 850 | 1,051 | 1,424 | 1,123 |
| G&A expense | 1,636 | 2,069 | 2,263 | 3,067 | 3,415 | 3,325 | 576 | 540 | 547 | 601 | 593 | 656 | 1,017 | 802 |
| R&D expense | 4,007 | 4,427 | 4,511 | 6,155 | 6,489 | 7,030 | 1,084 | 1,027 | 1,199 | 1,201 | 1,207 | 1,350 | 2,034 | 1,564 |
| OP income | 4,674 | 3,622 | 3,768 | 7,613 | 7,991 | 10,063 | 1,045 | 879 | 749 | 1,096 | 1,362 | 2,070 | 2,346 | 1,835 |
| Pretax income | 4,801 | 4,242 | 3,854 | 7,684 | 7,916 | 10,064 | 1,099 | 626 | 880 | 1,248 | 1,427 | 2,027 | 2,303 | 1,928 |
| Net income | 3,803 | 3,451 | 3,063 | 6,231 | 6,372 | 8,102 | 918 | 493 | 665 | 987 | 1,132 | 1,630 | 1,888 | 1,581 |
| EBITDA | 6,759 | 6,263 | 6,773 | 10,015 | 10,230 | 12,267 | 1,774 | 1,592 | 1,531 | 1,876 | 2,155 | 2,910 | 3,078 | 1,872 |
| EPS (NT$) | 8.58 | 7.10 | 6.41 | 12.96 | 13.26 | 16.85 | 1.92 | 1.03 | 1.39 | 2.07 | 2.36 | 3.39 | 3.93 | 3.29 |
| DPS (NT$) | 6.00 | 4.80 | 4.30 | 8.70 | 8.89 | 11.31 | ||||||||
| Dividend payout | 69.9% | 67.6% | 67.1% | 67.1% | 67.1% | 67.1% | ||||||||
| Dividend yield | 5% | 4% | 4% | 7% | 7% | 9% | ||||||||
| Ratios | ||||||||||||||
| R&D to rev | 3.6% | 4.0% | 4.1% | 3.9% | 3.8% | 3.7% | 3.8% | 3.7% | 4.4% | 4.4% | 4.1% | 3.4% | 4.0% | 3.9% |
| Opex ratio | 8.1% | 8.9% | 9.1% | 8.6% | 8.5% | 7.9% | 8.5% | 8.4% | 9.4% | 10.0% | 9.1% | 7.8% | 8.8% | 8.7% |
| Tax rate | 20.8% | 18.6% | 20.5% | 18.9% | 19.5% | 19.5% | 16.5% | 21.2% | 24.4% | 20.9% | 20.6% | 19.6% | 18.0% | 18.0% |
| Margins | ||||||||||||||
| Gross margin | 12.3% | 12.1% | 12.5% | 13.3% | 13.2% | 13.2% | 12.2% | 11.6% | 12.1% | 14.1% | 13.8% | 13.0% | 13.4% | 13.3% |
| Operating margin | 4.2% | 3.3% | 3.4% | 4.8% | 4.7% | 5.3% | 3.7% | 3.2% | 2.7% | 4.1% | 4.7% | 5.2% | 4.6% | 4.6% |
| Pretax margin | 4.3% | 3.8% | 3.5% | 4.8% | 4.6% | 5.3% | 3.9% | 2.3% | 3.2% | 4.6% | 4.9% | 5.1% | 4.5% | 4.8% |
| Net margin | 3.4% | 3.1% | 2.8% | 3.9% | 3.7% | 4.3% | 3.2% | 1.8% | 2.4% | 3.7% | 3.9% | 4.1% | 3.7% | 3.9% |
| EBITDA margin | 6.1% | 5.7% | 6.1% | 6.3% | 6.0% | 6.5% | 6.3% | 5.8% | 5.6% | 6.9% | 7.4% | 7.4% | 6.1% | 4.7% |
| YoY | ||||||||||||||
| Revenue | 16% | -1% | 0% | 45% | 7% | 11% | 11% | -10% | 5% | -3% | 3% | 43% | 86% | 48% |
| Gross profit | 17% | -2% | 3% | 55% | 6% | 11% | 17% | -18% | 12% | 6% | 16% | 61% | 106% | 40% |
| OP income | 33% | -23% | 4% | 102% | 5% | 26% | 58% | -29% | 25% | -2% | 30% | 136% | 213% | 67% |
| Pretax income | 28% | -12% | -9% | 99% | 3% | 27% | 17% | -54% | 41% | -4% | 30% | 224% | 162% | 54% |
| Net income | 22% | -9% | -11% | 103% | 2% | 27% | 22% | -58% | 28% | -3% | 23% | 230% | 184% | 60% |
Source: Company data, Goldman Sachs Global Investment Research
Valuation: With the earning estimate changes, we raise our 12M TP by 2% to NT$371.0 (vs. previously at NT$364, based on 28.0x 2027E P/E , unchanged). We continue to base our TP on 2027E P/E, and the target multiple is still derived from the correlation between P/E and EPS growth of its peers (Exhibit 5), which is higher as we mark to market. Our target P/E of 28.0x is higher than company's avg. +1 std P/E (16.3x), which we believe is not stretched considering the sustainable growth of WNC driven by long-term satellite and high speed networking demand. Maintain Buy.
Exhibit 5: WNC 12M forward P/E
Source: Eikon Datastream
Exhibit 6: WNC peers' correlation of P/E and earnings growth
Eikon for Non-covered company
Source: Company data, Goldman Sachs Global Investment Research, Eikon Datastream
Price Target Risks and Methodology: WNC
Valuation: We use a near-term P/E to derive our 12m target price for WNC, consistent with our Taiwan Technology coverage. We base our TP of NT$371.0 on a target P/E multiple of 28.0x on a forward year EPS (2027E). Our target P/E is derived from the
UMT
0e9a8f9023044ccc8559dea9c0453f9d
correlation between P/E and EPS growth of its peers. We are Buy rated on WNC. Key downside risks: fi ercer-than-expected competition in satellite communication, slower-than-expected Wi-Fi 7 or 5G FWA ramp-up in US and Europe markets.
| 6285.TW | 12m Price Target: NT$371.00 | 12m Price Target: NT$371.00 | Price: NT$235.50 | Price: NT$235.50 | Upside: 57.5% | Upside: 57.5% |
|---|---|---|---|---|---|---|
| Buy | Buy | GS Forecast | GS Forecast | GS Forecast | GS Forecast | GS Forecast |
| Market c ap: NT$111.9bn / $ 3 . 5 bn E nterpr is e v a lu e: NT$11 2 . 6 bn / $ 3 . 5 bn 3m AD T V : NT$ 3 . 5 bn / $111. 2m n Ta iw an G reater Chi na Te ch n ology M &A R ank: 3 L ea s e s i n | Market c ap: NT$111.9bn / $ 3 . 5 bn E nterpr is e v a lu e: NT$11 2 . 6 bn / $ 3 . 5 bn 3m AD T V : NT$ 3 . 5 bn / $111. 2m n Ta iw an G reater Chi na Te ch n ology M &A R ank: 3 L ea s e s i n | Revenue (NT$m n ) N e w Revenue (NT$ mn) Old EBITDA (NT$ mn) E PS(NT$) N e w EPS (NT$) Old P/E (X) P/B (X) Dividend yield (%) CROCI (%) | 1 2 / 25 11 0,250. 8 110,250.8 6,772.9 6 .4 1 6.41 19.2 1.7 3.5 13.1 6/ 2 6 | 1 2 / 2 6E 1 59,545.2 132,995.5 10,015.1 1 2.9 6 11.01 18.2 3.1 3.7 17.9 9 / 2 6E | 1 2 / 2 7E 17 0, 7 5 1 .9 154,417.1 10,230.0 1 3.2 6 13.00 17.8 2.9 3.8 17.1 1 2 / 2 6E | 1 2 / 2 8E 18 9,999.9 172,507.6 12,266.7 16 . 8 5 16.39 14.0 2.8 4.8 18.7 3 / 2 7E |
Source: Company data, Goldman Sachs Research estimates, FactSet. Price as of 19 Aug 2026 close.
0e9a8f9023044ccc8559dea9c0453f9d
Di
Reg AC
We, Allen Chang, Verena Jeng and Ting Song, hereby certify that all of the views expressed in this report accurately re fl ect our personal views about the subject company or companies and its or their securities. We also certify that no part of our compensation was, is or will be, directly or indirectly, related to the speci fi c recommendations or views expressed in this report.
Unless otherwise stated, the individuals listed on the cover page of this report are analysts in Goldman Sachs' Global Investment Research division.
Contributing Authors: Allen Chang Goldman Sachs (Asia) L.L.C., Verena Jeng Goldman Sachs (Asia) L.L.C., Ting Song Goldman Sachs (Asia) L.L.C..
Unless otherwise stated, the individuals listed in the Contributing Authors disclosure of this report are analysts in Goldman Sachs' Global Investment Research division.
GS Factor Pro fi le
The Goldman Sachs Factor Pro fi le provides investment context for a stock by comparing key attributes to the market (i.e. our universe of rated stocks) and its sector peers. The four key attributes depicted are: Growth, Financial Returns, Multiple (e.g. valuation) and Integrated (a composite of Growth, Financial Returns and Multiple). Growth, Financial Returns and Multiple are calculated by using normalized ranks for speci fi c metrics for each stock. The normalized ranks for the metrics are then averaged and converted into percentiles for the relevant attribute. The precise calculation of each metric may vary depending on the fi scal year, industry and region, but the standard approach is as follows:
Growth is based on a stock's forward-looking sales growth, EBITDA growth and EPS growth (for fi nancial stocks, only EPS and sales growth), with a higher percentile indicating a higher growth company. Financial Returns is based on a stock's forward-looking ROE, ROCE and CROCI (for fi nancial stocks, only ROE), with a higher percentile indicating a company with higher fi nancial returns. Multiple is based on a stock's forward-looking P/E, P/B, price/dividend (P/D), EV/EBITDA, EV/FCF and EV/Debt Adjusted Cash Flow (DACF) (for fi nancial stocks, only P/E, P/B and P/D), with a higher percentile indicating a stock trading at a higher multiple. The Integrated percentile is calculated as the average of the Growth percentile, Financial Returns percentile and (100% - Multiple percentile).
Financial Returns and Multiple use the Goldman Sachs analyst forecasts at the fi scal year-end at least three quarters in the future. Growth uses inputs for the fi scal year at least seven quarters in the future compared with the year at least three quarters in the future (on a per-share basis for all metrics).
For a more detailed description of how we calculate the GS Factor Pro fi le, please contact your GS representative.
M&A Rank
Across our global coverage, we examine stocks using an M&A framework, considering both qualitative factors and quantitative factors (which may vary across sectors and regions) to incorporate the potential that certain companies could be acquired. We then assign a M&A rank as a means of scoring companies under our rated coverage from 1 to 3, with 1 representing high (30%-50%) probability of the company becoming an acquisition target, 2 representing medium (15%-30%) probability and 3 representing low (0%-15%) probability. For companies ranked 1 or 2, in line with our standard departmental guidelines we incorporate an M&A component into our target price. M&A rank of 3 is considered immaterial and therefore does not factor into our price target, and may or may not be discussed in research.
Quantum
Quantum is Goldman Sachs' proprietary database providing access to detailed fi nancial statement histories, forecasts and ratios. It can be used for in-depth analysis of a single company, or to make comparisons between companies in di ff erent sectors and markets.
Disclosures
The rating(s) for WNC is/are relative to the other companies in its/their coverage universe: AAC, ACM Research, AMEC, ASMPT, AVC, AccoTest, Anji Micro, Asus, Auras, BOE, BYDE, Biren, CR Micro, Cambricon, Chenbro, China Mobile (HK), China Telecom, China Tower Corp., China Unicom, Chinasoft Intl, Compal, Desay SV, E Ink, E-Town Semis, EHang, Empyrean, Eoptolink, FOCI, Fositek, Foxconn Industrial Internet, Gigabyte, Gigadevice, Glodon Co., HTC Corp., Hikvision, Hon Hai, Horizon Robotics, Hua Hong, Huace Navigation, Huaqin Co.(A), Huaqin Co.(H), Hwatsing, Iluvatar, InnoScience, Inspur, Insta360, Inventec, JCET, Kematek, King Slide, Kingdee, Kingsoft O ffi ce, LandMark, Largan, Lenovo, Lingyi, Luxshare (A), Luxshare (H), Maxscend, Meitu, MetaX, Mitac, Montage (A), Montage (H), NAURA, NSIG, Nexchip, OmniVision, Pegatron, Pony AI Inc. (ADR), Pony AI Inc. (H), Quanta, RoboTechnik, Ruijie Networks, SG Micro, SICC, SMIC (A), SMIC (H), SZS, Sangfor, SenseTime, Shengyi Tech, Shennan Circuits, StarPower, Sunny Optical, TFC Optical, Thundersoft, Tongyu Communication, Transsion, UMT, UNIS, VPEC, Vanchip, VeriSilicon, Victory Giant, WNC, WUS, WeRide, Wistron, Wiwynn, YJ Semitech, YOFC, Yonyou, ZTE (A), ZTE (H), iFlytek