PDF 原檔:報告_GS_台積電2330_20260716_original.pdf
圖片清單(已驗證 2026-07-17)
| 檔名 | size | 分類 | 親眼所見內容 |
|---|---|---|---|
報告_GS_台積電2330_20260716_002.png |
41KB | 真資料圖 | Price Performance:2330.TW vs Taiwan SE Weighted Index 股價走勢圖+3m/6m/12m 絕對與相對報酬表 |
報告_GS_台積電2330_20260716_008.png |
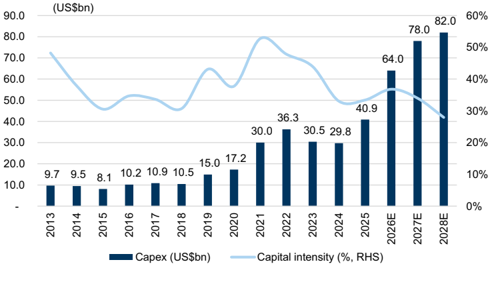
45KB | 真資料圖 | Capex and capital intensity trend:2013-2028E capex(US$bn)柱狀圖+capital intensity(%)折線,2026E/27E/28E 為 64.0/78.0/82.0 |
報告_GS_台積電2330_20260716_009.png |
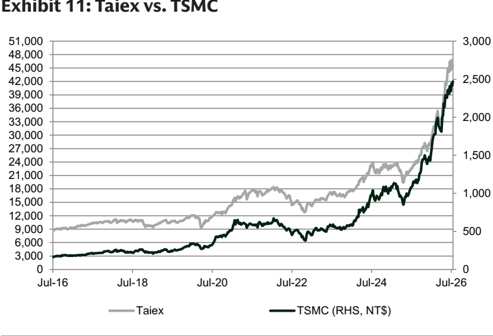
51KB | 真資料圖 | Exhibit 11:Taiex vs. TSMC 股價走勢對照圖,2016-07 至 2026-07 |
報告_GS_台積電2330_20260716_011.png |
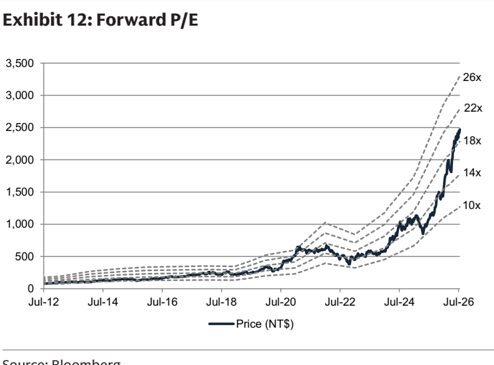
48KB | 真資料圖 | Exhibit 12:Forward P/E 走勢圖,10x-26x 本益比帶,2012-2026 |
報告_GS_台積電2330_20260716_013.png |
76KB | 真資料圖 | GS rating and stock price target history(TWD,2330.TW):歷次評等與目標價沿革,2023-2026 |
報告_GS_台積電2330_20260716_014.png |
75KB | 真資料圖 | GS rating and stock price target history(USD,ADR TSM):歷次評等與目標價沿革,2023-2026 |
報告_GS_台積電2330_20260716_001.png(21KB)、_003.png(38KB)、_004.png(35KB)、_005.png(34KB)、_006.png(36KB)、_007.png(29KB)、_010.png(39KB)、_012.png(36KB)均未達 40KB 門檻,預設 logo/裝飾未逐張 Read(含 Exhibit 2/3/4/5 revenue growth/margin/CoWoS shipment/CoWoS capacity 折線圖)。
原始內容
For the exclusive use of KEVINLU@LENOVO.COM
TSMC (2330.TW)
Earnings review: AI demand visibility into 2030 with stronger guidance extends TSMC's lead with higher capacity investment; reiterate Buy
2330.TW
12m Pri c e Target:
NT$3,100.00
Pri c e:
NT$2,470.00
Upside:
25.5%
TSM
12m Pri c e Target:
$620.00
Pri c e:
$419.48
Upside:
47.8%
Upbeat 2026 guidance driven by increased AI demand
TSMC hosted its 2Q26 analyst meeting on July 16. We view the stronger full year 2026 revenue and CapEx guidance as the key upside surprise. In the meeting, management raised its 2026 revenue growth outlook to slightly above 40% YoY (USD, from above 30%, ahead of GSe of 39%) and lifted CapEx to US$60-64bn (from the higher end of US$52-56bn; GSe of US$56bn). 3Q26 revenue guidance was in line, while the sequential GM decline was more contained than the N2 ramp implies. However, we think the one soft spot was 2Q26 GM of 67.7%, beating the company's guidance but falling below GSe (68.5%) and bull-case investor expectations. Overall, we think the more positive tone on AI demand during the meeting reinforces the long-term demand outlook - management sees demand even stronger than last quarter, and is accelerating its capacity buildout accordingly with an additional US$100bn investment in Arizona. We raise our 12m TP to NT$3,100 (from NT$3,000), and with 25.5% of implied upside we reiterate our Buy rating on TSMC.
Stronger AI demand signals stronger long-term growth
We believe management's tone on AI demand was more bullish than last quarter. Management's conviction in multi-year AI demand was described as very high, with customers continuing to send strong demand signals into 2029-2030 - and management characterizing the shift as the emergence of a new AI industry. While TSMC did not provide an updated long-term AI revenue CAGR (previously guided toward higher 50% range for 2024-29), it explicitly indicated the trajectory is now stronger than previously guided. Agentic AI was fl agged as an incremental driver, with very strong CPU demand spanning x86, ARM, RISC-V and all TSMC customers - consistent with the CPU theme we highlighted during our US marketing trip.
BUY
Evelyn Yu
+886(2)2730-4187 | evelyn.yu@gs.com Goldman Sachs (Asia) L.L.C., Taipei Branch
James Schneider, Ph.D.
+1(212)357-2929 | jim.schneider@gs.com Goldman Sachs & Co. LLC
Ryan Huang, CFA
+886(2)2730-4084 | ryan.huang@gs.com Goldman Sachs (Asia) L.L.C., Taipei Branch
Key Data _____________________________________
Market cap: NT$64.0tr / $2.0tr
Enterprise value: NT$61.3tr / $1.9tr
3m ADTV: NT$86.9bn / $2.7bn
Taiwan
Taiwan Semiconductor
M&A Rank: 3
Leases incl. in net debt & EV?: Yes
| GS Forecast | 12/25 | __________ 12/26E | 12/27E | 12/28E |
|---|---|---|---|---|
| Revenue(NT$mn) New | 3,809,054.3 5,532,239.7 | 7,343,151.2 | 9,393,969.4 | |
| Revenue (NT$ mn) Old | 3,809,054.3 | 5,385,597.1 | 7,132,115.4 | 9,135,711.6 |
| EBITDA (NT$ mn) | 2,624,188.0 | 4,086,905.6 | 5,489,197.9 | 7,056,258.1 |
| EPS (NT$) Old | 66.26 | 102.99 | 136.34 | 175.24 |
| P/E (X) | 17.6 | 22.6 | 17.5 | 13.7 |
| P/B (X) | 5.6 | 8.4 | 6.1 | 4.5 |
| Dividend yield (%) | 1.9 | 1.2 | 1.3 | 1.5 |
| CROCI (%) | 24.3 | 34.2 | 37.8 | 40.8 |
| 6/26 | 9/26E | 12/26E | 3/27E | |
| EPS (NT$) | 27.25 | 28.06 | 31.82 | 31.38 |
Source: Company data, Goldman Sachs Research estimates. See disclosures for details.
Goldman Sachs does and seeks to do business with companies covered in its research reports. As a result, investors should be aware that the fi rm may have a con fl ict of interest that could a ff ect the objectivity of this report. Investors should consider this report as only a single factor in making their investment decision. For Reg AC certi fi cation and other important disclosures, see the Disclosure Appendix, or go to www.gs.com/research/hedge.html. Analysts employed by non-US a ffi liates are not registered/quali fi ed as research analysts with FINRA in the U.S.
e92c7a75ab8b4efbba794e6b187208c8
For the exclusive use of KEVINLU@LENOVO.COM
BUY
TSMC (2330.TW)
Rating since May 7, 2019
Ratios & Valuation __________________________________________
| 12/25 | 12/26E | 12/27E | 12/28E | |
|---|---|---|---|---|
| P/E (X) | 17.6 | 22.6 | 17.5 | 13.7 |
| P/B (X) | 5.6 | 8.4 | 6.1 | 4.5 |
| FCF yield (%) | 3.3 | 2.3 | 3.9 | 5.9 |
| EV/EBITD A R(X) | 10.8 | 15.0 | 10.9 | 8.0 |
| EV/EBITD A (excl. leases) (X) | 10.8 | 15.0 | 10.9 | 8.0 |
| CROCI (%) | 24.3 | 34.2 | 37.8 | 40.8 |
| ROE (%) | 35.4 | 43.3 | 40.2 | 37.7 |
| Net debt/equity (%) | (34.3) | (36.2) | (42.6) | (51.6) |
| Net debt/equity (excl. leases) (%) | (34.3) | (36.2) | (42.6) | (51.6) |
| Interest c ov er (X) | 99.1 | 158.0 | 322.9 | 852.3 |
| Days in v ent o ry o utst , sales | 27.6 | 22.3 | 22.9 | 21.8 |
| Recei v able days | 26.6 | 21.8 | 19.3 | 15.7 |
| Days p ayable o utstandin g | 157.7 | 157.0 | 157.3 | 169.9 |
| DuP o nt ROE (%) | 31.5 | 36.8 | 34.5 | 32.6 |
| Turn ov er (X) | 0.5 | 0.5 | 0.6 | 0.6 |
| L e v era g e (X) | 1.5 | 1.3 | 1.2 | 1.2 |
| G r o ss cas h in v ested (ex cas h ) (NT $ ) | 9 , 199 , 168.9 | 11 , 319 , 901.9 | 13 , 604 , 132.4 | 15 , 919 , 256.3 |
| Av era g e ca p ital e mp l o yed (NT $ ) | 3 , 371 , 689.3 | 4 , 251 , 886.6 | 5 , 490 , 676.4 | 6 , 512 , 230.9 |
| BVP S (NT $ ) | 208.99 | 295.30 | 406.21 | 553.03 |
Growth & Margins (%) ______________________________________
| 12/25 | 12/26E | 12/27E | 12/28E | |
|---|---|---|---|---|
| Total revenue growth | 31.6 | 45.2 | 32.7 | 27.9 |
| EBITDA growth | 32.2 | 55.7 | 34.3 | 28.5 |
| EPS growth | 46.4 | 64.8 | 29 | 28.3 |
| DPS growth | 29.4 | 31.8 | 13.8 | 12.1 |
| EBIT margin | 50.8 | 59 | 59.3 | 60 |
| EBITDA margin | 68.9 | 73.9 | 74.8 | 75.1 |
| Net income margin | 45.1 | 51.2 | 49.8 | 49.9 |
Absolute
Rel. to the Taiwan SE Weighted Index
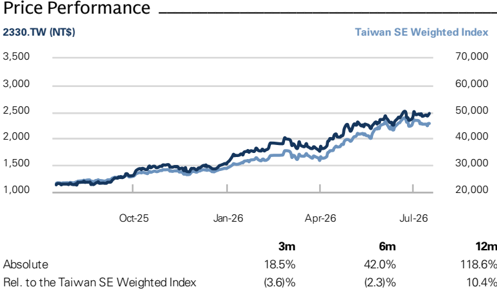
Source: FactSet. Price as of 16 Jul 2026 close.
Income Statement (NT$ mn) ________________________________
| 12/25 | 12/26E | 12/27E | 12/28E | |
|---|---|---|---|---|
| To t a l r e v e nu e | 3,809,054.3 | 5,532,239.7 | 7,343,151.2 | 9,393,969.4 |
| Cost of goods sold | (1,527,760.3) | (1,828,885.9) | (2,422,147.7) | (3,057,406.2) |
| SG&A | (98,775.0) | (107,806.6) | (134,144.0) | (151,544.0) |
| R&D | (246,427.3) | (331,194.7) | (430,084.0) | (552,584.0) |
| Other operating inc./(exp.) | -- | -- | -- | -- |
| E BITDA | 2 , 62 4, 188 .0 | 4,0 86 ,90 5 . 6 | 5 ,4 8 9, 1 9 7 .9 | 7 ,0 56 , 258 . 1 |
| Depreciation& amortization | (688,096.4) | (822,553.1) | (1,132,422.4) | (1,423,822.9) |
| E BIT | 1 ,93 6 ,09 1 . 7 | 3, 26 4,3 52 . 5 | 4,3 56 , 775 . 5 | 5 , 6 3 2 ,43 5 . 2 |
| Net interest inc./(exp.) | 86,206.5 | 94,527.4 | 98,962.7 | 106,220.8 |
| Income/(loss) from associates | 5,496.6 | 1,684.9 | 0.0 | 0.0 |
| Pre-tax pro fi t | 2 ,04 1 , 662 . 8 | 3,433,09 7 . 6 | 4,4 55 , 7 3 8 . 2 | 5 , 7 3 8 , 655 .9 |
| Provision for taxes | (326,266.1) | (600,149.3) | (800,669.4) | (1,048,428.5) |
| Minority interest | 2,485.8 | (978.6) | (876.0) | (876.0) |
| Preferred dividends | -- | -- | -- | -- |
| N et inc . ( pre-ex c ept i o n a ls) | 1 , 717 , 882 . 6 | 2 , 8 3 1 ,9 6 9. 8 | 3, 65 4, 1 9 2 . 8 | 4, 68 9,3 51 .4 |
| Post-tax exceptionals | -- | -- | -- | -- |
| N et inc . ( po s t-ex c ept i o n a ls) | 1 , 717 , 882 . 6 | 2 , 8 3 1 ,9 6 9. 8 | 3, 65 4, 1 9 2 . 8 | 4, 68 9,3 51 .4 |
| E P S(b a sic , pre-ex c ept ) (N T $) | 66 . 26 | 1 09. 21 | 1 40.9 1 | 18 0. 8 3 |
| E P S(dilu te d , pre-ex c ept ) (N T $) | 66 . 26 | 1 09. 21 | 1 40.9 1 | 18 0. 8 3 |
| E P S(b a sic , po s t-ex c ept ) (N T $) | 66 . 26 | 1 09. 21 | 1 40.9 1 | 18 0. 8 3 |
| E P S(dilu te d , po s t-ex c ept ) (N T $) | 66 . 26 | 1 09. 21 | 1 40.9 1 | 18 0. 8 3 |
| DPS (NT$) | 22.00 | 29.00 | 33.00 | 37.00 |
| Div. payout ratio (%) | 33.2 | 26.6 | 23.4 | 20.5 |
| Balance Sheet (NT$ mn) | 12/25 | 12/26E | ______ 12/27E | 12/28E |
| C a sh& c a sh equiv a lents | 2,767,856.4 | 3,386,062.3 | 4,811,276.3 | 7,528,426.4 |
| Accounts receiv a ble | 282,059.2 | 380,251.6 | 395,123.3 | 414,281.3 |
| Inventory | 288,109.5 | 387,743.4 | 532,199.8 | 591,093.4 |
| Other current a ssets | 479,105.8 | 553,731.5 | 553,731.5 | 553,731.5 |
| Total current assets | 3, 817 , 1 30. 8 | 4, 7 0 7 , 788 . 8 | 6 , 2 9 2 ,330.9 | 9,0 87 , 5 3 2 . 6 |
| Net PP&E | 3,691,840.9 | 4,990,628.7 | 6,362,801.5 | 7,571,573.7 |
| Net int a ngibles | 24,952.6 | 18,212.3 | 9,617.2 | 1,022.0 |
| Tot a l investments | 172,370.4 | 166,566.5 | 166,566.5 | 166,566.5 |
| Other long-term a ssets | 226,729.2 | 249,463.0 | 249,463.0 | 249,463.0 |
| Total assets | 7 ,933,0 2 3.9 | 1 0, 1 3 2 , 65 9.4 | 1 3,0 8 0, 77 9. 1 | 17 ,0 76 , 157 . 8 |
| Accounts p a y a ble | 714,546.9 | 858,451.8 | 1,229,549.5 | 1,616,477.1 |
| Short-term debt | 0.0 | -- | -- | -- |
| Short-term le a se li a bilities | -- | -- | -- | -- |
| Other current li a bilities | 743,472.4 | 860,083.3 | 860,083.3 | 860,083.3 |
| Total current liabilities | 1 ,4 58 ,0 1 9.3 | 1 , 718 , 5 3 5 . 1 | 2 ,0 8 9, 6 3 2 . 8 | 2 ,4 76 , 56 0.4 |
| Long-term debt | 896,062.0 | 601,017.7 | 301,017.7 | 101,017.7 |
| Long-term le a se li a bilities | -- | -- | -- | -- |
| Other long-term li a bilities | 118,147.3 | 113,289.6 | 113,289.6 | 113,289.6 |
| Total long-term liabilities | 1 ,0 1 4, 2 09.3 | 71 4,30 7 .3 | 4 1 4,30 7 .3 | 21 4,30 7 .3 |
| 2 ,4 | ,43 2 , 8 4 2 | 2 , 6 90, 867 . | ||
| Total liabilities | 72 , 228 . 6 | 2 .4 | 2 , 5 03,940. 1 | 7 |
| Preferred sh a res | -- | -- | -- | -- |
| Tot a l commonequity Minority interest Total liabilities &equity | 5,419,596.0 4 1 , 1 99.3 7 ,933,0 2 3.9 | 7,657,733.4 4 2 ,0 8 3. 6 1 0, 1 3 2 , 65 9.4 | 10,533,882.2 4 2 ,9 56 . 7 1 3,0 8 0, 77 9. 1 | 14,341,460.2 43, 82 9.9 17 ,0 76 , 157 . 8 |
| Net debt, a djusted | (1,871,794.4) | (2,785,044.5) | (4,510,258.5) | (7,427,408.7) |
Cash Flow (NT$ mn) ________________________________________
| 12/25 | 12/26E | 12/27E | 12/28E | |
|---|---|---|---|---|
| Net income | 1,717,882.6 | 2,831,969.8 | 3,654,192.8 | 4,689,351.4 |
| D&Aadd-back | 688,096.4 | 822,553.1 | 1,132,422.4 | 1,423,822.9 |
| Minority interest add-back | (2,485.8) | 978.6 | 876.0 | 876.0 |
| Net (inc)/dec w orking capital | 98,731.8 | (53,921.4) | 211,769.6 | 308,876.0 |
| Other operating cash flo w | (227,249.3) | (72,924.0) | 0.0 | 0.0 |
| Cash flow fro m operations | 2 , 274 ,9 75 . 6 | 3, 528 , 656 .0 | 4 ,999, 26 0. 8 | 6 , 422 ,9 26 . 4 |
| Capital expenditures | (1,272,410.5) | (2,037,298.5) | (2,496,000.0) | (2,624,000.0) |
| Acquisitions | -- | -- | -- | -- |
| Divestitures | -- | -- | -- | -- |
| Others | 128,017.1 | (6,091.0) | -- | -- |
| Cash flow fro m investing | ( 1 , 144 ,393. 4 ) | ( 2 ,0 4 3,3 8 9. 5 ) | ( 2 , 4 9 6 ,000.0) | ( 2 , 624 ,000.0) |
| Repayment of lease liabilities | -- | -- | -- | -- |
| Dividends paid(common& pref) | (440,851.8) | (622,379.8) | (778,044.0) | (881,773.5) |
| Inc/(dec) in debt | 40,448.1 | (285,987.3) | (300,000.0) | (200,000.0) |
| Other financing cash flo w s | (89,949.1) | 41,306.4 | (2.8) | (2.8) |
| Cash flow fro m financing | ( 4 90,3 52 .9) | ( 867 ,0 6 0. 7 ) | ( 1 ,0 78 ,0 46 . 8 ) | ( 1 ,0 81 , 776 .3) |
| Total cash flow | 64 0, 22 9. 4 | 618 , 2 0 5 .9 | 1 , 425 , 214 .0 | 2 , 717 , 15 0. 1 |
| Free cash flo w | 1,002,565.1 | 1,491,357.5 | 2,503,260.8 | 3,798,926.4 |
Source: Company data, Goldman Sachs Research estimates.
e92c7a75ab8b4efbba794e6b187208c8
For the exclusive use of KEVINLU@LENOVO.COM
Pricing strategy remains disciplined
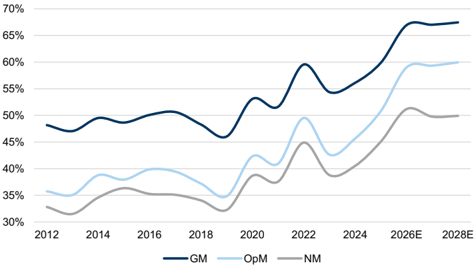
Another key focus during TSMC's analyst meeting is its pricing strategy and pro fi tability outlook. Overall, we believe TSMC's pricing strategy will remain disciplined, but broad-based cost in fl ation likely supports higher pricing over time. In the meeting, management rea ffi rmed a measured, partnership-driven philosophy: it does not plan to suddenly raise pricing in a way that would threaten customers' fi nancial health - and stressed it intends to remain a trusted partner while driving higher margins and pro fi tability. Meanwhile, management acknowledged rising input costs, including WFE tool in fl ation and overseas fab costs. With cost in fl ation increasingly broad-based across the supply chain, we think it is reasonable to expect TSMC to re fl ect at least some of this in its pricing over time. We are currently modeling in a price increase by low- to mid-single digits for 2027, which - together with productivity, mix and better operating leverage - should help underpin the structurally higher pro fi tability. Net net, we are now modeling TSMC's GM to reach 66.9%/67.0%/67.5% in 2026-2028E (vs. 66.9%/66.8%/67.3% previously).
Accelerating capacity buildout, including a further US$100bn CapEx in Arizona
TSMC announced an additional US$100bn investment in Arizona - on top of its existing ~US$165bn commitment, taking the total to roughly to US$265bn, to support US customers, which includes four additional fabs (with pace dependent on customer demand). This expansion sits alongside 13 leading-edge/advanced-packaging fabs under construction in Taiwan, plus N3 expansion across Taiwan/Arizona/Japan and N5 to N3 tool conversion. On the multi-year CapEx outlook, management did not provide a three-year fi gure but indicated it will be even more signi fi cant than the prior three years (~US$101bn cumulative), reiterating that it will not hesitate to invest while opportunities persist - a clear step up in tone relative to last quarter. We raise our 2026E CapEx to US$64bn (vs. US$56bn previously); we maintain our 2027/2028E CapEx at US$78bn/US$82bn.
High con fi dence in TSMC's structural lead
Addressing questions on rising competition, management pushed back on the idea of a fast catchup, stressing that there is no shortcut in semiconductors, and that winning business comes back to fundamentals - manufacturing excellence, technology leadership and customer trust. It noted that choosing a foundry is a multi-year technology-partnership decision: customers must understand the technology, run test chips, prepare, and then ramp - a process that realistically takes up to fi ve years, which underpins the durability of TSMC's incumbency. We think TSMC's technology roadmap also reinforces this: N2 is ramping steeply into 2H26, while A14 remains on track for 2028, with A14 expected to be a longer-lasting node than N2 - supporting our view that TSMC's leadership and the majority of foundry revenue share are unlikely to be meaningfully challenged over the next few years.
Adding mature node capacity selectively in higher-value segments
On mature nodes, TSMC said it will continue to increase its mature node capacity, but will focus on higher-value-added areas while ensuring enough capacity to support customers. JASM (Japan) will focus on specialty/CMOS, and ESMC (Germany) to focus on automotive/industrial. While demand within mature nodes remains bifurcated - only AI-related mature nodes are in shortage (especially for PMIC and sensors), while broader e92c7a75ab8b4efbba794e6b187208c8
For the exclusive use of KEVINLU@LENOVO.COM
consumer-related mature node demand remains soft.
Exhibit 1: TSMC fi nancial snapshot
| TSMC (2330.TW) | 2019 | 2020 | 2021 | 2022 | 2023 | 2024 | 2025 | 2026E | 2027E | 2028E | 25-28E CAGR |
|---|---|---|---|---|---|---|---|---|---|---|---|
| P&L (NT$bn) | |||||||||||
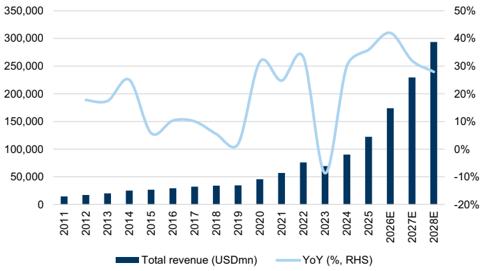
| Revenue (US$bn) | 34.7 | 45.6 | 56.9 | 75.9 | 69.3 | 90.1 | 122.4 | 173.8 | 229.5 | 293.6 | 33.8% |
| %YoY | 1.9% | 31.6% | 24.7% | 33.3% | -8.7% | 30.0% | 35.9% | 42.0% | 32.0% | 27.9% | |
| Revenue | 1,070 | 1,339 | 1,587 | 2,264 | 2,162 | 2,894 | 3,809 | 5,532 | 7,343 | 9,394 | 35.1% |
| %YoY | 3.7% | 25.2% | 18.5% | 42.6% | -4.5% | 33.9% | 31.6% | 45.2% | 32.7% | 27.9% | |
| Gross profit | 493 | 711 | 820 | 1,348 | 1,175 | 1,624 | 2,281 | 3,703 | 4,921 | 6,337 | 40.6% |
| %GM | 46.0% | 53.1% | 51.6% | 59.6% | 54.4% | 56.1% | 59.9% | 66.9% | 67.0% | 67.5% | |
| EBIT | 373 | 567 | 650 | 1,121 | 921 | 1,322 | 1,936 | 3,264 | 4,357 | 5,632 | 42.8% |
| %OpM | 34.8% | 42.3% | 40.9% | 49.5% | 42.6% | 45.7% | 50.8% | 59.0% | 59.3% | 60.0% | |
| Net income | 345 | 518 | 597 | 1,017 | 838 | 1,173 | 1,718 | 2,832 | 3,654 | 4,689 | 39.8% |
| %YoY | -1.7% | 50.0% | 15.2% | 70.4% | -17.5% | 39.9% | 46.4% | 64.9% | 29.0% | 28.3% | |
| EPS (NT$) | 13.3 | 20.0 | 23.0 | 39.2 | 32.3 | 45.3 | 66.3 | 109.2 | 140.9 | 180.8 | 39.7% |
Source: Company data, Goldman Sachs Global Investment Research, Bloomberg
Exhibit 2: TSMC's revenue growth outlook
Source: Company data, Goldman Sachs Global Investment Research
Exhibit 4: TSMC's annual CoWoS shipment growth trend
Source: Company data, Goldman Sachs Global Investment Research
Exhibit 3: TSMC's margin outlook
Source: Company data, Goldman Sachs Global Investment Research
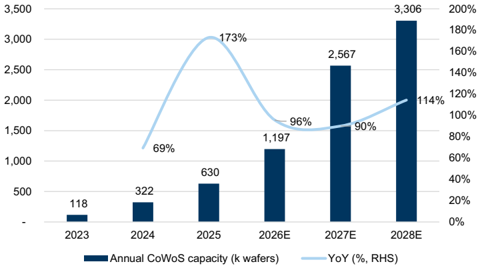
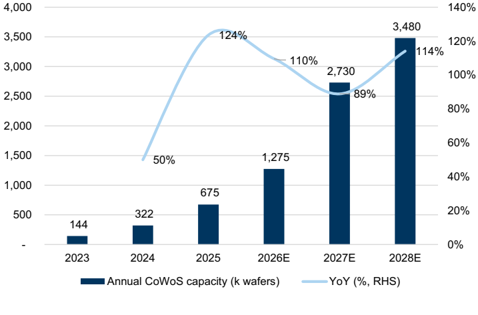
Exhibit 5: TSMC's annual CoWoS capacity growth trend
Source: Company data, Goldman Sachs Global Investment Research
e92c7a75ab8b4efbba794e6b187208c8
For the exclusive use of KEVINLU@LENOVO.COM
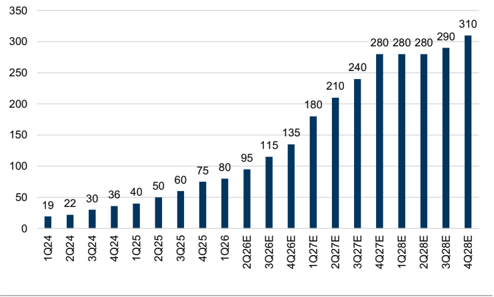
Exhibit 6: TSMC's quarterly CoWoS capacity ramp (kwpm)
Source: Company data, Goldman Sachs Global Investment Research
2Q26 results and 3Q26 guidance recap
3Q26 guidance: In-line revenue, but sequential GM decline more contained than the N2 ramp implies
Management guided 3Q26 revenue to US$44.6-45.8bn (+12% QoQ at midpoint; based on FX [TWD/USD] of 32), broadly in line with GSe, underpinned by continued leading-edge and N2 demand. On margins, GM is guided to be in the range of 65%-67%, and OpM in the range of 56%-58%. While 3Q26 revenue guidance was in line, the sequential GM decline came in more contained than the N2 ramp implies, considering that the company is guiding for N2 ramp to dilute GM by 300-400bps for 2H26. The guided sequential GM decline is smaller than that headwind implies: at the guidance mid-point (66%) GM steps down by ~1.7ppt QoQ from 2Q's 67.7%, and at the high end (67%) just ~0.7ppt - better than GSe (was expecting a 1.7ppt QoQ decline). We attribute the resilience to strong leading-edge demand, productivity gains and cross-node capacity optimization, which partially o ff set the N2 dilution.
2Q26 results: GM above guidance but below elevated expectations
2Q26 revenue of US$40.2bn (+12% QoQ, +34% YoY) landed at the high end of guidance (US$39.0-40.2bn), at an FX of 31.60 (vs. 31.7 assumed). GM of 67.7% came in above the top of guidance (65.5-67.5%) but ~0.8ppt below GSe (68.5%) and short of the 68-69% bull case; OpM of 60.3% beat both guidance (56.5-58.5%) and GSe on lower OpEx, leaving operating pro fi t essentially in line. EPS of NT$27.25 was ~12% above GSe (NT$24.34).
Exhibit 7: TSMC's capex and capital intensity trend
Source: Company data, Goldman Sachs Global Investment Research e92c7a75ab8b4efbba794e6b187208c8
For the exclusive use of KEVINLU@LENOVO.COM
Exhibit 8: 2Q26 results summary
| 2Q26 | 1Q26 | 2Q25 | %QoQ | %YoY | GS prev. | %Diff | Consensus | %Diff | |
|---|---|---|---|---|---|---|---|---|---|
| (NT$mn) | |||||||||
| Revenue | 1,270,381 | 1,134,103 | 933,792 | 12.0% | 36.0% | 1,285,321 | -1.2% | 1,266,708 | 0.3% |
| Gross profit | 860,311 | 751,295 | 547,369 | 14.5% | 57.2% | 881,038 | -2.4% | 849,936 | 1.2% |
| Op. income | 766,603 | 658,966 | 463,424 | 16.3% | 65.4% | 767,033 | -0.1% | 742,746 | 3.2% |
| Net income | 706,562 | 572,480 | 398,273 | 23.4% | 77.4% | 631,236 | 11.9% | 624,400 | 13.2% |
| EPS (NT$) | 27.25 | 22.08 | 15.36 | 23.4% | 77.4% | 24.34 | 11.9% | 24.10 | 13.1% |
| GM | 67.7% | 66.2% | 58.6% | 1.5% | 9.1% | 68.5% | -0.8% | 67.1% | 0.9% |
| OpM | 60.3% | 58.1% | 49.6% | 2.2% | 10.7% | 59.7% | 0.7% | 58.6% | 2.9% |
| NM | 55.6% | 50.5% | 42.7% | 5.1% | 13.0% | 49.1% | 6.5% | 49.3% | 12.8% |
Source: Bloomberg, Company data, Goldman Sachs Global Investment Research
e92c7a75ab8b4efbba794e6b187208c8
For the exclusive use of KEVINLU@LENOVO.COM
Earnings revisions, valuation and key risks
Forecast changes
Post its earnings results, we raise our 2026/2027/2028E EPS by 6.0%/3.4%/3.2% to re fl ect: (1) stronger 3Q26 GM guidance; (2) strong 2026 revenue growth guidance; (3) incrementally better AI demand.
Exhibit 9: Earnings revisions
| 2026E | 2026E | 2026E | 2027E | 2027E | 2027E | 2028E | 2028E | 2028E | |
|---|---|---|---|---|---|---|---|---|---|
| (NT$mn) | Old | New | Diff (%) | Old | New | Diff (%) | Old | New | Diff (%) |
| Revenue | 5,385,597 | 5,532,240 | 2.7% | 7,132,115 | 7,343,151 | 3.0% | 9,135,712 | 9,393,969 | 2.8% |
| Gross profit | 3,602,046 | 3,703,354 | 2.8% | 4,762,395 | 4,921,003 | 3.3% | 6,145,196 | 6,336,563 | 3.1% |
| Op. income | 3,152,200 | 3,264,353 | 3.6% | 4,205,372 | 4,356,775 | 3.6% | 5,425,573 | 5,632,435 | 3.8% |
| Net income | 2,670,856 | 2,831,970 | 6.0% | 3,535,702 | 3,654,193 | 3.4% | 4,544,358 | 4,689,351 | 3.2% |
| EPS (NT$) | 102.99 | 109.21 | 6.0% | 136.34 | 140.91 | 3.4% | 175.24 | 180.83 | 3.2% |
| GM | 66.9% | 66.9% | 0.1% | 66.8% | 67.0% | 0.2% | 67.3% | 67.5% | 0.2% |
| OpM | 58.5% | 59.0% | 0.5% | 59.0% | 59.3% | 0.4% | 59.4% | 60.0% | 0.6% |
| NM | 49.6% | 51.2% | 1.6% | 49.6% | 49.8% | 0.2% | 49.7% | 49.9% | 0.2% |
| 3Q26E | 3Q26E | 3Q26E | 4Q26E | 4Q26E | 4Q26E | 1Q27E | 1Q27E | 1Q27E | |
|---|---|---|---|---|---|---|---|---|---|
| (NT$mn) | Old | New | Diff (%) | Old | New | Diff (%) | Old | New | Diff (%) |
| Revenue | 1,450,312 | 1,467,820 | 1.2% | 1,515,861 | 1,659,936 | 9.5% | 1,589,556 | 1,639,061 | 3.1% |
| Gross profit | 969,244 | 984,033 | 1.5% | 1,000,468 | 1,107,715 | 10.7% | 1,052,286 | 1,092,005 | 3.8% |
| Op. income | 849,738 | 861,051 | 1.3% | 876,462 | 977,733 | 11.6% | 925,780 | 959,923 | 3.7% |
| Net income | 721,939 | 727,750 | 0.8% | 745,202 | 825,178 | 10.7% | 787,086 | 813,886 | 3.4% |
| EPS (NT$) | 27.84 | 28.06 | 0.8% | 28.74 | 31.82 | 10.7% | 30.35 | 31.38 | 3.4% |
| GM | 66.8% | 67.0% | 0.2% | 66.0% | 66.7% | 0.7% | 66.2% | 66.6% | 0.4% |
| OpM | 58.6% | 58.7% | 0.1% | 57.8% | 58.9% | 1.1% | 58.2% | 58.6% | 0.3% |
| NM | 49.8% | 49.6% | -0.2% | 49.2% | 49.7% | 0.6% | 49.5% | 49.7% | 0.1% |
Source: Goldman Sachs Global Investment Research
Exhibit 10: TSMC's P&L summary
| 1Q26 | 2Q26E | 3Q26E | 4Q26E | 1Q27E | 2Q27E | 3Q27E | 4Q27E | 2026E | 2027E | 2028E | |
|---|---|---|---|---|---|---|---|---|---|---|---|
| P&L (NT$mn) | |||||||||||
| Revenue | 1,134,103 | 1,270,381 | 1,467,820 | 1,659,936 | 1,639,061 | 1,785,119 | 1,898,563 | 2,020,409 | 5,532,240 | 7,343,151 | 9,393,969 |
| Gross profit | 751,295 | 860,311 | 984,033 | 1,107,715 | 1,092,005 | 1,191,576 | 1,281,749 | 1,355,674 | 3,703,354 | 4,921,003 | 6,336,563 |
| Operating profit | 658,966 | 766,603 | 861,051 | 977,733 | 959,923 | 1,054,594 | 1,137,867 | 1,204,392 | 3,264,353 | 4,356,775 | 5,632,435 |
| Net income | 572,480 | 706,562 | 727,750 | 825,178 | 813,886 | 878,616 | 953,093 | 1,008,598 | 2,831,970 | 3,654,193 | 4,689,351 |
| EPS (NT$) | 22.08 | 27.25 | 28.06 | 31.82 | 31.38 | 33.88 | 36.75 | 38.89 | 109.21 | 140.91 | 180.83 |
| Margins (%) | |||||||||||
| Gross margin | 66.2% | 67.7% | 67.0% | 66.7% | 66.6% | 66.8% | 67.5% | 67.1% | 66.9% | 67.0% | 67.5% |
| Operating profit margin | 58.1% | 60.3% | 58.7% | 58.9% | 58.6% | 59.1% | 59.9% | 59.6% | 59.0% | 59.3% | 60.0% |
| Net margin | 50.5% | 55.6% | 49.6% | 49.7% | 49.7% | 49.2% | 50.2% | 49.9% | 51.2% | 49.8% | 49.9% |
| YoY (%) | |||||||||||
| Revenue | 35.1% | 36.0% | 48.3% | 58.7% | 44.5% | 40.5% | 29.3% | 21.7% | 45.2% | 32.7% | 27.9% |
| Gross profit | 52.3% | 57.2% | 67.2% | 69.9% | 45.3% | 38.5% | 30.3% | 22.4% | 62.3% | 32.9% | 28.8% |
| Operating profit | 61.9% | 65.4% | 72.0% | 73.1% | 45.7% | 37.6% | 32.1% | 23.2% | 68.6% | 33.5% | 29.3% |
| Net income | 58.3% | 77.4% | 60.9% | 63.2% | 42.2% | 24.4% | 31.0% | 22.2% | 64.9% | 29.0% | 28.3% |
| EPS | 58.3% | 77.4% | 60.9% | 63.1% | 42.1% | 24.4% | 31.0% | 22.2% | 64.8% | 29.0% | 28.3% |
| QoQ (%) | |||||||||||
| Revenue | 8.4% | 12.0% | 15.5% | 13.1% | -1.3% | 8.9% | 6.4% | 6.4% | |||
| Gross profit | 15.2% | 14.5% | 14.4% | 12.6% | -1.4% | 9.1% | 7.6% | 5.8% | |||
| Operating profit | 16.7% | 16.3% | 12.3% | 13.6% | -1.8% | 9.9% | 7.9% | 5.8% | |||
| Net income | 13.2% | 23.4% | 3.0% | 13.4% | -1.4% | 8.0% | 8.5% | 5.8% | |||
| EPS | 13.2% | 23.4% | 3.0% | 13.4% | -1.4% | 8.0% | 8.5% | 5.8% |
Source: Company data, Goldman Sachs Global Investment Research
Reiterate Buy; 12m TP up to NT$3,100
We raise our 12m TP to NT$3,100 from NT$3,000 (2330.TW), following our upward earnings revisions. Our TP is based on a target P/E of 22x (unchanged, benchmarked to 1.0stdv above 5-year avg. forward P/E) applied to our higher 2027E EPS. Accordingly, we raise our 12 month TP for the ADR to US$620 from US$600, based on an unchanged FX
e92c7a75ab8b4efbba794e6b187208c8
For the exclusive use of KEVINLU@LENOVO.COM
conversion of USD/TWD of 30.0 and unchanged ADR premium of 20%. Our 22x target P/E multiple is also benchmarked to TSMC's trading average of 22x during its previous revenue upcycle where its 3-year revenue CAGR (2019-2021) was 28%, vs. our 3-year revenue CAGR at 34% during 2025-2028E.
Our new TP implies 26% (ADR 48%) upside to the last close. As a result, we reiterate our Buy ratings for TSMC/ADR. We maintain our constructive view on TSMC's long-term growth outlook as we believe the company's solid technology leadership and execution better positions it vs. peers to capture the industry's long-term structural growth opportunities, especially in AI.
Source: Bloomberg
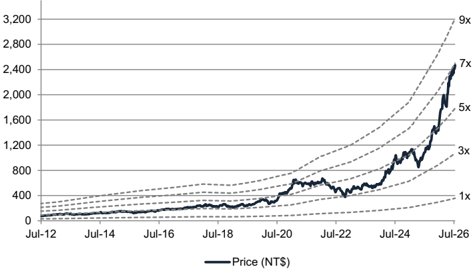
Exhibit 13: Forward P/B
Source: Bloomberg
Source: Bloomberg
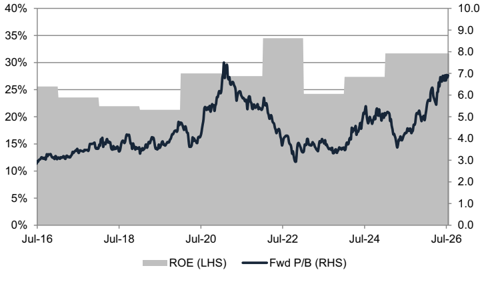
Exhibit 14: P/B vs. ROE
Source: Bloomberg, Data compiled by Goldman Sachs Global Investment Research e92c7a75ab8b4efbba794e6b187208c8
For the exclusive use of KEVINLU@LENOVO.COM
Investment Thesis, Price Target Risks and Methodology
Investment Thesis - TSMC (2330.TW/TSM)
TSMC is a leading global foundry company specializing in cutting-edge nodes. Its leading technology stance enables it to enjoy more than 60% revenue share in the global foundry market. We like TSMC as we believe its solid technology leadership and execution better position it vs. peers to capture the industry's long-term structural growth opportunities, particularly in areas such as AI/5G/HPC/EV. In addition, valuation looks attractive in our view, with the shares trading at the mid-range of their 10-year trading history (P/E: 10-29x). Furthermore, we view TSMC as the key AI enabler among our Taiwan Semis coverage, thanks to its leadership stance in leading edge nodes and advanced packaging technology - CoWoS (chip on wafer on substrate). We believe TSMC will achieve its 25% revenue CAGR target for the next several years, driven primarily by increasing silicon content growth and AI/HPC demand, with LT GM to remain at 56%+. We are Buy rated.
Price Target Risks and Methodology - TSMC (2330.TW/TSM)
Valuation methodology: We have a 12m TP of NT$3,100, which is derived by applying a target P/E multiple of 22x to our 2027E EPS. Our 22x target P/E is benchmarked against 1.0stdv above its 5-year trading average. For the ADR (TSM), we have a 12m TP of US$620, based on a USD/TWD rate of 30.0 and an ADR premium of 20%.
Key downside risks to our views: (1) further deterioration in end-demand recovery impacting capacity utilization; (2) slower customer node migrations; (3) slowdown in AI investment resulting in lower long-term semiconductor content growth; (4) poor yields/execution resulting in worse-than-expected pro fi tability; (5) stronger competition resulting in ASP/pro fi tability erosion; and (6) unfavorable FX trend or higher-than-expected cost increase weighing on the margin outlook.
e92c7a75ab8b4efbba794e6b187208c8
For the exclusive use of KEVINLU@LENOVO.COM