PDF 原檔:報告_GS_全新2455_20260731_original.pdf
圖片清單(已驗證 2026-08-03)
| 檔名 | size | 分類 | 親眼所見內容 |
|---|---|---|---|
260731_gs_vpec_001.png |
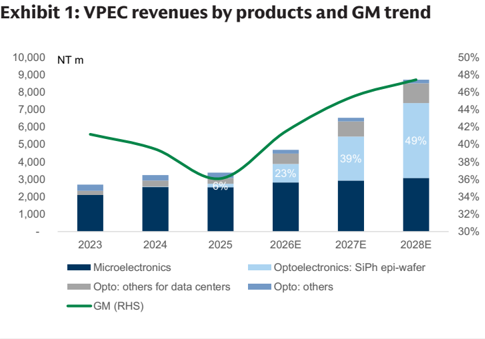
47KB | 真資料圖 | Exhibit 1:VPEC 營收依產品別(Microelectronics/Optoelectronics 各子項)堆疊長條圖 + GM 趨勢線,2023–2028E |
260731_gs_vpec_002.png |
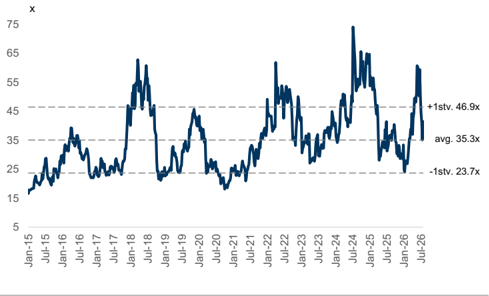
46KB | 真資料圖 | Exhibit 9:VPEC 12M forward PE 走勢圖(2015–2026),含 avg 35.3x、+1stv 46.9x、-1stv 23.7x 三條虛線 |
260731_gs_vpec_003.png |
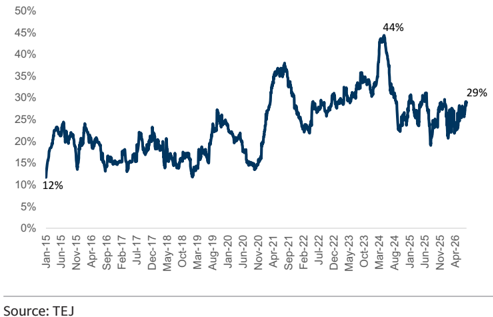
48KB | 真資料圖 | Exhibit 10:VPEC QFII 持股比例走勢圖(2015–2026),標示低點 12%、高點 44%、近期 29%,來源 TEJ |
260731_gs_vpec_004.png |
73KB | 真資料圖 | GS 評等與目標價沿革圖:VPEC 股價(灰線)vs 歷次目標價(藍色階梯,含 189.5/222.7/233/216/218/233/267/504)疊 Taiwan SE Weighted Index(淺藍虛線),2023–2026 |
原始內容
For the exclusive use of KEVINLU@LENOVO.COM
VPEC (2455.TW): New equipment re fl ects strong orders; 3Q26 to ride on better InP substrate supply and capacity expansion; Buy
VPEC announced equipment procurement of NT$653m (US$20m) from Aixtron (MOCVD supplier), re fl ecting strong orders on hand and demand sustainability beyond 2027E, considering the lead time of MOCVD is now around 12 months. The continued investment in MOCVD rea ffi rms our positive view on VPEC, which is positioned to bene fi t from the AI server rack ramp up, optical networking speci fi cation upgrades across transmitters / CW lasers (toward 1.6T optical modules) and receivers (toward 200G PD), product expansion toward EML base epiwafers, further customer penetration for CW lasers, improving InP substrate supply, and opportunities in CPO (with customers placing R&D orders on InP epiwafers for 300mW CW lasers). Maintain Buy with TP at NT$505 (implied 52.3x 2027E PE vs. 49% NI YoY in 2027-28E).
Source: Company data, Goldman Sachs Global Investment Research
3-month revenue preview: VPEC delivered fl at revenues QoQ in 1Q26 and 2Q26; however, we expect +23% QoQ in 3Q26 thanks to capacity expansion and better InP substrate supply, on the back of more customers carrying substrate, InP substrate suppliers' capacity expansion, and consecutive export permission received from the Chinese government. We expect VPEC to better capture strong AI data center demand in 3Q26, driving its Optoelectronics revenue contribution up to 41% (vs. 27% in 2Q26), leading to further GM expansion.
Goldman Sachs does and seeks to do business with companies covered in its research reports. As a result, investors should be aware that the fi rm may have a con fl ict of interest that could a ff ect the objectivity of this report. Investors should consider this report as only a single factor in making their investment decision. For Reg AC certi fi cation and other important disclosures, see the Disclosure Appendix, or go to www.gs.com/research/hedge.html. Analysts employed by non-US a ffi liates are not registered/quali fi ed as research
Verena Jeng
+852-2978-1681 | verena.jeng@gs.com Goldman Sachs (Asia) L.L.C.
Allen Chang +852-2978-2930 | allen.k.chang@gs.com Goldman Sachs (Asia) L.L.C.
Yifan Hu
+852-2978-0996 | yifan.hu@gs.com Goldman Sachs (Asia) L.L.C.
e92c7a75ab8b4efbba794e6b187208c8
For the exclusive use of KEVINLU@LENOVO.COM
Exhibit 2: VPEC monthly revenue preview
| Apr-26 | May-26 | Jun-26 | Jul-26 (E) | Aug-26 (E) | Sep-26 (E) | 1Q26 | 2Q26 | 3Q26E | |
|---|---|---|---|---|---|---|---|---|---|
| Rev (NT$m) | 319 | 321 | 326 | 342 | 377 | 467 | 959 | 965 | 1,186 |
| YoY | 38% | 47% | 24% | 18% | 37% | 35% | 21% | 35% | 30% |
| MoM/QoQ | 2% | 1% | 2% | 5% | 10% | 24% | 0% | 1% | 23% |
| GS (NT$m) | 334 | 325 | 353 | 968 | 996 | ||||
| Actual vs. GS | -5% | -1% | -8% | -1% | -3% |
Source: Company data, Goldman Sachs Global Investment Research
2Q26 net income in line: VPEC gross pro fi ts increased +2% QoQ in 2Q26, largely in line with our and Bloomberg consensus. The company's optoelectronics (mainly InP epiwafer for optical networking) carrying higher GM compared to microelectronics (mainly GaAs epiwafer for smartphone PA), while it continues to deliver blended GM expansion despite a less favorable product mix in 2Q26 vs. 4Q25, re fl ecting InP epiwafer ASP increase under strong demand. With better InP substrate supply going forward, we expect GM expansion to continue, along with product mix upgrade toward optoelectronics. Opex ratio remained high in 2Q26 at 15.4% (vs. 14.5% in 1Q26), given modest revenues QoQ and continuous R&D investments, leading OP income to decline 1% QoQ, or 11% / 10% below our / Bloomberg consensus. With strong revenues QoQ in 3Q26, we expect opex ratio to improve to 13%. With lower than expected tax rate, net income increased +9% QoQ in 2Q26, in line with our / Bloomberg consensus.
Exhibit 3: VPEC 2Q26 results snapshot
| NT$m | 2Q25 | 1Q26 | 2Q26 | QoQ | YoY | GS | Act / GS | Cons. | Act / Cons. |
|---|---|---|---|---|---|---|---|---|---|
| Revenues | 714 | 959 | 965 | 1% | 35% | 996 | -3% | 987 | -2% |
| GP | 246 | 365 | 373 | 2% | 52% | 386 | -3% | 394 | -5% |
| OP | 122 | 227 | 224 | -1% | 83% | 252 | -11% | 248 | -10% |
| Net income | 36 | 195 | 214 | 9% | 488% | 212 | 1% | 215 | -1% |
| Margins | |||||||||
| GM | 34.4% | 38.1% | 38.6% | 38.7% | 39.9% | ||||
| OPM | 17.1% | 23.6% | 23.2% | 25.2% | 25.1% | ||||
| NM | 5.1% | 20.3% | 22.1% | 21.2% | 21.8% |
Source: Company data, Goldman Sachs Global Investment Research, Bloomberg
Earnings revision: We raise net income by 2% / 3% in 2027 / 28E mainly on better optoelectronics, considering better InP substrate supply and the company's capacity expansion to better capture strong demand. We factor in 2Q26 results and keep our 2026E net income largely unchanged.
Exhibit 4: Earnings revision
| 2026E | 2026E | 2026E | 2027E | 2027E | 2027E | 2028E | 2028E | 2028E | |
|---|---|---|---|---|---|---|---|---|---|
| NT$m | Old | New | Diff% | Old | New | Diff% | Old | New | Diff% |
| Revenues | 4,702 | 4,688 | 0% | 6,473 | 6,532 | 1% | 8,655 | 8,714 | 1% |
| GP | 1,952 | 1,945 | 0% | 2,918 | 2,965 | 2% | 4,022 | 4,132 | 3% |
| OP | 1,378 | 1,346 | -2% | 2,160 | 2,201 | 2% | 3,056 | 3,133 | 3% |
| Net income | 1,149 | 1,148 | 0% | 1,779 | 1,811 | 2% | 2,488 | 2,556 | 3% |
| Margins | |||||||||
| GM | 41.5% | 41.5% | 45.1% | 45.4% | 46.5% | 47.4% | |||
| OPM | 29.3% | 28.7% | 33.4% | 33.7% | 35.3% | 36.0% | |||
| NM | 24.4% | 24.5% | 27.5% | 27.7% | 28.7% | 29.3% | |||
| Opex ratio | 12.2% | 12.8% | 11.7% | 11.7% | 11.2% | 11.5% |
Source: Goldman Sachs Global Investment Research
Compared to Bloomberg consensus, our net income is 13% / 7% higher in 2026 / 27E, mainly on higher revenues and GM, re fl ecting our positive view on its InP epiwafers for optical networking across transmitters / CW lasers and receivers, which we believe will continue to drive its product mix upgrade, GM expansion, and expanding the end e92c7a75ab8b4efbba794e6b187208c8
For the exclusive use of KEVINLU@LENOVO.COM
Exhibit 6: VPEC P&L
| NT$ mn | 2022 | 2023 | 2024 | 2025 | 2026E | 2027E | 2028E | 1Q25 | 2Q25 | 3Q25 | 4Q25 | 1Q26 | 2Q26 | 3Q26E | 4Q26E |
|---|---|---|---|---|---|---|---|---|---|---|---|---|---|---|---|
| Income statement | |||||||||||||||
| Revenue | 2,604 | 2,694 | 3,241 | 3,380 | 4,688 | 6,532 | 8,714 | 794 | 714 | 913 | 960 | 959 | 965 | 1,186 | 1,577 |
| Gross profit | 1,089 | 1,109 | 1,279 | 1,220 | 1,945 | 2,965 | 4,132 | 317 | 246 | 300 | 358 | 365 | 373 | 486 | 721 |
| OP income | 580 | 542 | 721 | 669 | 1,346 | 2,201 | 3,133 | 179 | 122 | 159 | 209 | 227 | 224 | 333 | 563 |
| Net income | 545 | 450 | 671 | 548 | 1,148 | 1,811 | 2,556 | 157 | 36 | 160 | 194 | 195 | 214 | 276 | 463 |
| EPS (NT$) | 2.93 | 2.43 | 3.62 | 2.95 | 6.12 | 9.65 | 13.63 | 0.85 | 0.20 | 0.86 | 1.04 | 1.04 | 1.14 | 1.47 | 2.47 |
| Ratios | |||||||||||||||
| Opex ratio | 19.6% | 21.0% | 17.2% | 16.3% | 12.8% | 11.7% | 11.5% | 17.3% | 17.3% | 15.4% | 15.5% | 14.5% | 15.4% | 13.0% | 10.0% |
| Tax rate | 18.4% | 16.9% | 17.9% | 17.9% | 18.2% | 19.9% | 19.9% | 20.0% | -48.8% | 19.9% | 21.2% | 19.9% | 9.8% | 19.9% | 19.9% |
| Margins | |||||||||||||||
| Gross margin | 41.8% | 41.2% | 39.5% | 36.1% | 41.5% | 45.4% | 47.4% | 39.9% | 34.4% | 32.9% | 37.3% | 38.1% | 38.6% | 41.0% | 45.7% |
| Operating margin | 22.3% | 20.1% | 22.3% | 19.8% | 28.7% | 33.7% | 36.0% | 22.6% | 17.1% | 17.4% | 21.8% | 23.6% | 23.2% | 28.0% | 35.7% |
| Net margin | 20.9% | 16.7% | 20.7% | 16.2% | 24.5% | 27.7% | 29.3% | 19.8% | 5.1% | 17.6% | 20.2% | 20.3% | 22.1% | 23.3% | 29.3% |
| YoY | |||||||||||||||
| Revenue | -28% | 3% | 20% | 4% | 39% | 39% | 33% | -5% | -18% | 13% | 33% | 21% | 35% | 30% | 64% |
| Gross profit | -28% | 2% | 15% | -5% | 59% | 52% | 39% | -7% | -29% | -9% | 37% | 15% | 52% | 62% | 102% |
| OP income | -45% | -7% | 33% | -7% | 101% | 63% | 42% | -10% | -41% | -18% | 71% | 27% | 83% | 109% | 169% |
| Net income | -36% | -17% | 49% | -18% | 109% | 58% | 41% | -18% | -82% | 11% | 46% | 24% | 488% | 72% | 139% |
| QoQ | |||||||||||||||
| Revenue | 10% | -10% | 28% | 5% | 0% | 1% | 23% | 33% | |||||||
| Gross profit | 22% | -22% | 22% | 19% | 2% | 2% | 30% | 48% | |||||||
| OP income | 47% | -32% | 30% | 31% | 8% | -1% | 49% | 69% | |||||||
| Net income | 18% | -77% | 342% | 21% | 1% | 9% | 29% | 67% |
Source: Company data, Goldman Sachs Global Investment Research
Valuation: We continue to derive target price from 2029E discounted P/E back to 2027E via 10.5% COE (no change), and derive target PE multiple from peers' trading P/E vs. forward year fundamentals (NI YoY and OPM). Based on our updated 2029-30E NI YoY of 20% (vs. 13% previously) and 2029-30E OPM of 37% (vs. 35% previously), and peers' PEG&M of 0.3x (vs. 0.4x previously), we derive target PE multiple at 18.2x (vs. 19.6x previously), re fl ecting the sector de-rating under the AI server rack model transition and concerns on AI spending sustainability. Our new target price is at NT$505 (vs. NT$504 previously). Our new TP implied 2027E PE is at 52x, within the company's trading range (vs. peak at 74x, and +1stv. at 46x). Maintain Buy.
Exhibit 7: VPEC peers comparison
| Ticker | Company | Rating | 2027E P/E | 2027-28E NI YoY | 2027-28E OPM | Ratio |
|---|---|---|---|---|---|---|
| 3081.TWO | LandMark | Buy | 42.3 | 85% | 48% | 0.3 |
| 688498.SS | YJ Semi | Neutral | 149.0 | 82% | 51% | 1.1 |
| 5802.JT | Sumitomo | Buy | 15.1 | 22% | 11% | 0.5 |
| LITE | Lumentum | NC | 30.3 | 80% | 41% | 0.2 |
| COHR | Coherent | NC | 24.5 | 45% | 24% | 0.4 |
| 6503.JT | Mitsubishi | Buy | 19.5 | 18% | 11% | 0.7 |
| 300502.SZ | Eoptolink | Buy | 17.2 | 30% | 47% | 0.2 |
| Avg. (excl. outliers) | Avg. (excl. outliers) | 25.9 | 52% | 34% | 0.3 | |
| 2029E P/E | 2029-30E NI YoY | 2029-30E OPM | PEG&M | |||
| 2455.TW | VPEC | Buy | 18.2 | 20% | 37% | 0.3 |
Outliers are in grey. NC companies' estimates are from Bloomberg consensus. Price as of July 30, 2026.
Source: Company data, Goldman Sachs Global Investment Research, Bloomberg
market exposure from consumer electronics to AI data centers.
Exhibit 5: GS vs. Bloomberg consensus
| 2026E | 2026E | 2026E | 2027E | 2027E | 2027E | |
|---|---|---|---|---|---|---|
| NT$m | GS | Cons. | Diff% | GS | Cons. | Diff% |
| Revenues | 4,688 | 4,401 | 7% | 6,532 | 6,185 | 6% |
| GP | 1,945 | 1,811 | 7% | 2,965 | 2,730 | 9% |
| OP | 1,346 | 1,214 | 11% | 2,201 | 2,064 | 7% |
| Net income | 1,148 | 1,018 | 13% | 1,811 | 1,692 | 7% |
| Margins | ||||||
| GM | 41.5% | 40.4% | 45.4% | 43.3% | ||
| OPM | 28.7% | 27.6% | 33.7% | 33.4% | ||
| NM | 24.5% | 23.1% | 27.7% | 27.4% |
Source: Goldman Sachs Global Investment Research, Bloomberg
e92c7a75ab8b4efbba794e6b187208c8
For the exclusive use of KEVINLU@LENOVO.COM
Exhibit 8: VPEC discounted PE
| (NT$mn) | 2022 | 2023 | 2024 | 2025 | 2026E | 2027E | 2028E | 2029E | 2030E |
|---|---|---|---|---|---|---|---|---|---|
| SiPh Rev contribution | 1% | 6% | 23% | 39% | 49% | ||||
| SiPh GP contribution | 1% | 8% | 32% | 49% | 59% | ||||
| Revenue | 2,604 | 2,694 | 3,241 | 3,380 | 4,688 | 6,532 | 8,714 | 10,587 | 12,175 |
| YoY | -28% | 3% | 20% | 4% | 39% | 39% | 33% | 22% | 15% |
| Gross margin | 41.8% | 41.2% | 39.5% | 36.1% | 41.5% | 45.4% | 47.4% | 47.9% | 48.4% |
| Operating profit | 580 | 542 | 721 | 669 | 1,346 | 2,201 | 3,133 | 3,859 | 4,499 |
| YoY | -45% | -7% | 33% | -7% | 101% | 63% | 42% | 23% | 17% |
| Operating margin | 22% | 20% | 22% | 20% | 29% | 34% | 36% | 36% | 37% |
| Pre-tax profit | 667 | 542 | 818 | 667 | 1,403 | 2,260 | 3,191 | 3,918 | 4,558 |
| Net profit | 545 | 450 | 671 | 548 | 1,148 | 1,811 | 2,556 | 3,138 | 3,651 |
| EPS (NT$, diluted) | 2.93 | 2.43 | 3.62 | 2.95 | 6.12 | 9.65 | 13.63 | 33.92 | 39.45 |
| YoY | -36% | -17% | 49% | -18% | 109% | 58% | 41% | 23% | 16% |
| TP implied P/E | 172 | 208 | 140 | 171 | 83 | 52 | 37 | 15 | 13 |
2029E target P/E
Target multiple x EPS
Discounted back to 2027; TP (NTD)
Implied 2027 P/E
18.2
617
505.0
52.3
| COE assumption | |
|---|---|
| Beta | 1.7 |
| Risk free | 1.6% |
| Market risk premium | 5.1% |
| COE | 10.5% |
Source: Company data, Goldman Sachs Global Investment Research, Bloomberg
Exhibit 9: VPEC 12M forward PE ratio
Source: Company data, Goldman Sachs Global Investment Research, Bloomberg
Exhibit 10: VPEC QFII holdings
Source: TEJ
Price Target Risks and Methodology - VPEC
Valuation: We adopt a discounted P/E method and apply a 18.2x target P/E on VPEC's 2029E EPS, discounting back to 2027E at a COE of 10.5% (beta 1.7x, risk free rate 1.6% and market risk premium at 5.1%), to derive our 12m TP of NT$505. Our target P/E is based on 0.3x PEG&M ratio derived from the average level of peers in the photonics supply chain.
Key risk: Slower-than-expected SiPh business ramp up; weaker-than-expected microelectronics demand from smartphones clients; IDM o ff ers EPI wafer in-house.
e92c7a75ab8b4efbba794e6b187208c8
For the exclusive use of KEVINLU@LENOVO.COM
| 2455.TW | 12m Price Target: NT$505.00 | 12m Price Target: NT$505.00 | Price: NT$265.50 | Upside: 90.2% | Upside: 90.2% |
|---|---|---|---|---|---|
| Buy | Buy | GS Forecast | |||
| Market c ap: NT$49.8b n / $ 1 . 5 b n En terpr is e v a lu e: NT$49. 1 b n / $ 1 . 5 b n 3m AD T V : NT$ 3 . 0 b n / $9 3 . 3mn Ta iw a n G reater Chin a Te chnology M &A R a n k: 3 L ea s e s incl . in n et d ebt & EV? : Y e s | Reven u e (NT$m n ) N e w Revenue (NT$ mn) Old EBITD A (NT$ mn) E PS(NT$) N e w EPS (NT$) Old P/E (X) P/B (X) Dividend yield (%) CROCI (%) | 12/25 12/26E 3,3 8 0. 1 4, 688 . 2 | 12/27E 6 , 5 3 2 .3 | 12/28E 8 , 71 3. 5 | |
| 3,380. 1 | 4,702.4 | 6,473.0 | 8,655.5 | ||
| 960.2 | 1 ,659.3 | 2,548.2 | 3,46 1 .7 | ||
| 2 .9 5 | 6 . 12 | 9. 65 | 1 3. 6 3 | ||
| 2.95 | 6. 1 2 | 9.49 | 1 3.27 | ||
| 46.4 | 43.4 | 27.5 1 | 9.5 | ||
| 7.7 | 1 4.6 | 1 3.8 | 1 2.8 | ||
| 1 .9 | 2. 1 | 3.3 | 4.6 | ||
| 11 .5 | 1 9.9 | 28.9 | 39.6 | ||
| 6/26 | 9 /26E | 12/26E | 3 /27E | ||
| EPS (NT$) | 1 . 1 4 | 1 .47 | 2.47 | 1 .92 |
Source: Company data, Goldman Sachs Research estimates, FactSet. Price as of 30 Jul 2026 close.
e92c7a75ab8b4efbba794e6b187208c8
For the exclusive use of KEVINLU@LENOVO.COM