PDF 原檔:報告_Daiwa_臻鼎4958_20261020_original.pdf
圖片清單(已驗證 2026-10-22)
| 檔名 | size | 分類 | 親眼所見內容 |
|---|---|---|---|
報告_Daiwa_臻鼎4958_20261020_003.png |
25KB | 真資料圖 | 臻鼎營收依終端應用堆疊圖 2022–2025:Server/Optical Module/IC Substrate 及其他 7%/7%/10%/12%,Mobile 59%/69%/64%/61%,Computer & Consumer 34%/24%/26%/27% |
報告_Daiwa_臻鼎4958_20261020_004.png |
143KB | 真資料圖 | 公司簡報「Building the One ZDT Platform」同心圓圖:中心 One ZDT,內圈 HDI/FPC/HLC+HDI/SMA/SLP/RPCB/FCBGA(ABF)/FCCSP(BT),外圍應用含 AI Server、Storage、Switch、Transceiver、AI Glasses、AR/VR、醫療、人形機器人、基地台、航空、衛星、車用、平板、筆電 |
報告_Daiwa_臻鼎4958_20261020_005.png |
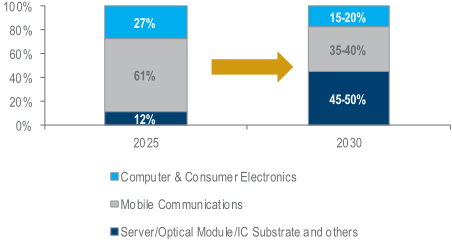
22KB | 真資料圖 | 終端應用占比 2025 vs 2030 目標:Server/Optical Module/IC Substrate 及其他 12%→45–50%,Mobile 61%→35–40%,Computer & Consumer 27%→15–20% |
原始內容
Zhen Ding Technology (4958 TT)
Target price: n.a.
Shareprice(19Oct):TWD547.00 | Up/downside:-
Business transformation bears fruit
- Key beneficiary of growth in optical transceiver & AI server HDI demand
- Aggressive substrate capacity strategy paying off in current conditions
- Margin expansion on fast-growing segments (HDI and substrates)
Background: Zhen Ding Technology (ZDT), the world's largest PCB manufacturer by revenue, generated revenue of TWD182.5bn in 2025. Historically focused on consumer electronics and smartphones, the company is shifting towards higher-value AI-server PCBs (HLC/iHDI), optical-module PCBs (mSAP), and IC substrates (ABF/BT). These businesses accounted for 21.6% of its revenue in 1H26, up from 11.7% in 2025. Management targets this ratio to reach c.25% in 2026 and c.30% in 2027. To support this shift, ZDT has 22 fabs under construction and plans to build nine more, primarily for mSAP/HDI, HLC, and ABF substrates.
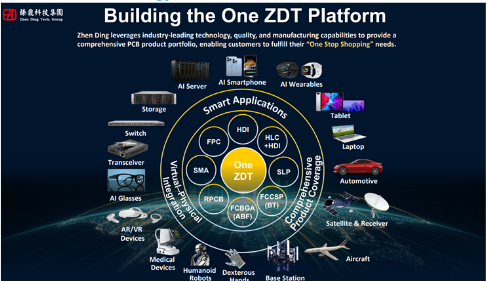
Highlights: ZDT's 'One ZDT strategy' is gradually bearing fruit. Since 2018, management has pursued its 'One ZDT strategy' to broaden the product portfolio - including HLC, substrates, mSAP/HDI, rigid-flex and SLP - by leveraging its strengths in FPCB and consumer HDI. This strategy is beginning to pay off, and management expects its fast-growing segments, including mSAP HDI for optical transceivers, AI-server HDI and ABF/BT substrates, to gain momentum from this year. Management expects revenue from these segments to increase by c.150% YoY and account for c.25% of total revenue (or c.TWD50bn) in 2026, and to further increase by 100% YoY to TWD100bn in 2027. ZDT targets these fastgrowing segments to reach 30% of its revenue mix in 2027 and c.45-50% in 2030. Given current progress, the 2030 target could be reached in 2028. For mSAP HDI, management expects the 800G/1.6T transceiver product mix to shift to 7:3 in 2027, from 5:5 in 2026, and aims to become the largest supplier of optical-transceiver HDI in 2027. In AI-server HDI, we expect the 2 leading ASIC vendors to gradually shift from pure HLC to thick HDI boards - a combination of HLC and HDI - in their next-generation designs, with ZDT a potential beneficiary. This could drive c.3x growth in ZDT's business in 2027.
Product mix to support gross margin expansion. Margin expansion is increasingly driven by a favourable product mix. Gross margin reached 22.4% in 1H26 (vs. 16.5% in 1H25). Management indicated that opticaltransceiver HDIs currently have the highest gross margin, at over 40%, followed by IC substrates, with ABF margins potentially reaching 50-60% and BT margins around 30% as a long-term target. Server HLC margins are around 20-30%, while HDI margins should be higher given their greater process complexity. With margins in traditional businesses at c.20%, ZDT expects growth in the newer segments to drive further margin expansion.
Valuation: The stock is trading at 36/19x PER for 2026/27E based on Bloomberg consensus. It's past 3-year PER range is 10-30x.
5
4
3
2
No Rating
Sheng Cheng (886) 2 8758 6253 sheng.cheng@daiwacm-cathay.com.tw
Thomas Kim (886) 2 8758 6249 thomas.kim@daiwacm-cathay.com.tw
Share price performance
| 12-month range | 136.00-646.00 |
|---|---|
| Market cap (USDbn) | 19.05 |
| 3m avg daily turnover (USDm) | 530.30 |
Source: FactSet, Daiwa forecasts
ZDT quarterly and annual P&L statement
| (TWDm) | 2024 - 1Q | 2024 - 2Q | 2024 - 3Q | 2024 - 4Q | 1Q | 2Q | 3Q | 2025 - 4Q | 2025 - 1Q | 2025 - 2026 2Q | 2023 | 2024 | 2025 | 1H26 |
|---|---|---|---|---|---|---|---|---|---|---|---|---|---|---|
| Net revenue | 32,510 | 32,411 | 50,609 | 56,133 | 40,082 | 38,203 | 47,366 | 56,870 | 40,728 | 48,431 | 151,398 | 171,664 | 182,522 | 89,159 |
| Gross profit | 5,337 | 4,247 | 11,406 | 11,471 | 5,885 | 7,011 | 10,410 | 12,830 | 8,812 | 11,186 | 27,459 | 32,461 | 36,136 | 19,998 |
| Operating profit | 743 | -644 | 5,933 | 5,554 | 1,056 | 2,425 | 4,530 | 5,921 | 2,503 | 3,761 | 9,160 | 11,586 | 13,932 | 6,265 |
| Non-operating profit | 755 | 1,153 | -655 | 2,206 | 401 | -153 | 131 | -248 | -103 | 1,170 | 888 | 3,459 | 131 | 1,067 |
| Pre-tax profit | 1,498 | 510 | 5,278 | 7,760 | 1,457 | 2,272 | 4,661 | 5,673 | 2,400 | 4,931 | 10,048 | 15,045 | 14,063 | 7,332 |
| Income taxes | -62 | 158 | -527 | -1,518 | -431 | -885 | -1,072 | -1,070 | -353 | -1,204 | -616 | -1,948 | -3,458 | -1,557 |
| Net profit | 977 | 486 | 3,353 | 4,363 | 632 | 605 | 2,392 | 3,161 | 1,426 | 2,392 | 6,189 | 9,180 | 6,791 | 3,817 |
| Net EPS (TWD) | 1.03 | 0.51 | 3.51 | 4.56 | 0.66 | 0.63 | 2.30 | 2.95 | 1.33 | 2.16 | 6.47 | 9.60 | 6.34 | 3.49 |
| Operating Ratios | ||||||||||||||
| Gross margin | 16.4% | 13.1% | 22.5% | 20.4% | 14.7% | 18.4% | 22.0% | 22.6% | 21.6% | 23.1% | 18.1% | 18.9% | 19.8% | 22.4% |
| Operating margin | 2.3% | -2.0% | 11.7% | 9.9% | 2.6% | 6.3% | 9.6% | 10.4% | 6.1% | 7.8% | 6.1% | 6.7% | 7.6% | 7.0% |
| Pre-tax margin | 4.6% | 1.6% | 10.4% | 13.8% | 3.6% | 5.9% | 9.8% | 10.0% | 5.9% | 10.2% | 6.6% | 8.8% | 7.7% | 8.2% |
| Net margin | 3.0% | 1.5% | 6.6% | 7.8% | 1.6% | 1.6% | 5.0% | 5.6% | 3.5% | 4.9% | 4.1% | 5.3% | 3.7% | 4.3% |
| YoY (%) | ||||||||||||||
| Net revenue | 3% | 38% | 21% | 3% | 23% | 18% | -6% | 1% | 2% | 27% | -12% | 13% | 6% | 14% |
| Gross profit | 5% | 100% | 33% | -2% | 10% | 65% | -9% | 12% | 50% | 60% | -31% | 18% | 11% | 55% |
| Operating profit | -39% | n.m. | 66% | -11% | 42% | n.m. | -24% | 7% | 137% | 55% | -59% | 26% | 20% | 80% |
| Pre-tax profit | 66% | 45% | 38% | 33% | -3% | 346% | -12% | -27% | 65% | 117% | -57% | 38% | -7% | 97% |
| Net profit | 94% | -36% | 46% | 25% | -35% | 25% | -29% | -28% | 125% | 295% | -56% | 30% | -26% | 208% |
| QoQ (%) | ||||||||||||||
| Net revenue | -40% | 0% | 56% | 11% | -29% | -5% | 24% | 20% | -28% | 19% | ||||
| Gross profit | -54% | -20% | 169% | 1% | -49% | 19% | 48% | 23% | -31% | 27% | ||||
| Operating profit | -88% | n.m. | n.m. | -6% | -81% | 130% | 87% | 31% | -58% | 50% | ||||
| Pre-tax profit | -74% | -66% | 935% | 47% | -81% | 56% | 105% | 22% | -58% | 105% | ||||
| Net profit | -72% | -50% | 590% | 30% | -86% | -4% | 295% | 32% | -55% | 68% |
Source: Company
ZDT: 1-year-forward PER bands
ZDT: revenue breakdown by product
Source: Company, Bloomberg consensus
ZDT: One ZDT strategy
Source: Company
ZDT: revenue breakdown by end applications (2025 vs. 2030)
Source: Company
Source: Company