PDF 原檔:報告_Daiwa_欣興3037_20260729_original.pdf
本份為 2Q26 法說會後正式 review(非 flash note);vault 既有 報告_Daiwa_欣興3037_20260728 為 7/28 盤後 first-take flash note,兩份內容不同,個別保留。
圖片清單(已驗證 2026-07-31)
| 檔名 | size | 分類 | 親眼所見內容 |
|---|---|---|---|
Daiwa-3037 20260729_001.png |
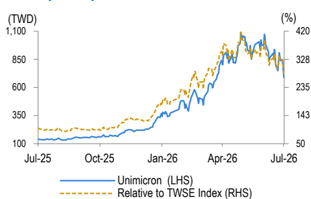
25KB | 真資料圖 | 股價與相對 TWSE 指數走勢圖(2025/07-2026/07),雙軸(TWD/%) |
Daiwa-3037 20260729_002.png |
22KB | 真資料圖 | 關鍵數據表格:12-month range/市值/日均成交額/流通股數/大股東(UMC 13.0%) |
Daiwa-3037 20260729_003.png |
33KB | 真資料圖 | 1 年期 forward PER band 圖(10x/20x/30x/40x,2019/07-2026/07) |
Daiwa-3037 20260729_004.png |
38KB | 真資料圖 | 1 年期 forward PBR band 圖(1x/4x/6.5x/9.5x,2019/07-2026/07) |
四張圖檔案大小皆低於 40KB 一般判準,但依 trimmed 內文明確標註為「Share price performance」「PER bands」「PBR bands」圖表脈絡,逐張 Read 後確認均為真資料圖(非 logo),故列入清單。
原始內容
Taiwan
Unimicron Technology Corp (3037 TT)
Target price:
TWD1,500.00 (from TWD1,000.00)
Share price (29 Jul):
TWD688.00 | Up/downside: +118.0%
2Q26 results: on-track gross margin expansion
- Gross margin further expands on price hikes and technology migration
- Strong capex guidance indicates a decent ABF substrate outlook
- Reiterating Buy (1) call; lifting 12M TP to TWD1,500 (from TWD1,000)
What's new: We provide our latest view on Unimicron after 2Q26 results.
What's the impact: 2Q26 results beat . Unimicron's 2Q26 earnings came in at TWD13.1bn (EPS: TWD8.53), which was 196% and 141% higher than our and the street's expectations due to a higher-than-expected gross margin and non-operating gains. Unimicron's 2Q26 revenue grew 15% QoQ to TWD42.9bn, while we attribute revenue strength to price hikes on substrate and new capacity ramp. Management attributes half of the margin expansion in 2Q26 to price hikes and the rest to utilisation rate (UTR) and yield improvement. As such, gross margin expanded 6.9pp QoQ to 24.8%; operating margin thus expanded by 8.2pp QoQ on gross margin expansion and better opex control. Additionally, Unimicron recognised a mark-to-market gain of TWD9.2bn mainly from its holding in UMC in 2Q26.
Business outlook . We believe management holds a positive view on both revenue and gross margin trends in 2H26 given the rising AI substrate and PCB sales mix and ongoing cost inflation. In the results call, we noted investors are keen to know the development of EMIB-T and glass-core substrate, capacity expansion plan, margin trend/pricing trend, HDI strategy, etc. For EMIB-T, management guides that end customers will likely adopt this technology for at least three generations in their products, which would lead to Unimicron and the other two JP substrate companies investing in related equipment in this new packaging technology and target the first stage of yield rate at 50% in 2H27E. Of total capex, management believes only 1-2% is tailored for EMIB-T equipment, while most of the rest (c.85%) is still marked for ABF substrate capacity expansion. As Unimicron further raised capex guidance to TWD53.7bn, we expect its ABF capacity expansion plan to reach 40%/20%/20% in 2026/27/28E respectively. Unimicron may also drive slightly incremental capacity from de- bottlenecking. As for HDI strategy, it mentioned no direct contest with its Chinese competitor and a focus on non-China markets. Considering the value from substrate to gradually increase with long-term GM target at 5060%. As such, we expect GM to expand to 26.3/38.6/45.4% (up 3-7pp vs.
enlarging substate body size due to die size or co-packaging requirements and advanced technology has to cooperate with substrate, mgmt. expects our prior estimate) in 2026/27/28, respectively, along with price hike trend.
What we recommend: We lift our 2026-28E EPS by 31-66% due to higher gross margin assumptions. We reaffirm our Buy (1) call and raise our 12M TP to TWD1,500 on an unchanged target PER of 35x applied to 1-yearforward EPS. Downside risk: weaker-than-expected PC/server demand.
How we differ: Our 2026-28E EPS are 26-33% above the Bloomberg consensus, likely due to our more bullish gross margin assumptions.
5
Daiwa
3
2
1
→
Buy
Sheng Cheng (886) 2 8758 6253 sheng.cheng@daiwacm-cathay.com.tw
Allan Wang (886) 2 8758 6249 allan.wang@daiwacm-cathay.com.tw
Forecast revisions (%)
| Year to 31 Dec | 26E | 27E | 28E |
|---|---|---|---|
| Revenue change | (0.5) | 16.7 | 30.4 |
| Net profit change | 31.0 | 37.1 | 65.7 |
| Core EPS (FD) change | 31.1 | 37.1 | 65.7 |
Source: Daiwa forecasts
Share price performance
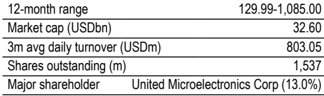
| 12-month range | 129.99-1,085.00 |
|---|---|
| Market cap (USDbn) | 32.60 |
| 3m avg daily turnover (USDm) | 803.05 |
| Shares outstanding (m) | 1,537 |
| Major shareholder | United Microelectronics Corp (13.0%) |
Financial summary (TWD)
| Year to 31 Dec | 26E | 27E | 28E |
|---|---|---|---|
| Revenue (m) | 186,355 | 278,423 | 371,883 |
| Operating profit (m) | 31,297 | 85,025 | 141,596 |
| Net profit (m) | 32,206 | 69,085 | 114,372 |
| Core EPS (fully-diluted) | 20.954 | 44.949 | 74.415 |
| EPS change (%) | 378.3 | 114.5 | 65.6 |
| Daiwa vs Cons. EPS (%) | 25.9 | 29.1 | 32.8 |
| PER (x) | 32.8 | 15.3 | 9.2 |
| Dividend yield (%) | 1.2 | 2.6 | 4.3 |
| DPS | 8.4 | 18.0 | 29.8 |
| PBR (x) | 7.9 | 5.6 | 3.9 |
| EV/EBITDA (x) | 20.2 | 9.3 | 5.5 |
| ROE (%) | 25.8 | 40.2 | 46.6 |
Source: FactSet, Daiwa forecasts
Unimicron Technology Corp (3037 TT): 29 July 2026
Unimicron: revenue and earnings forecasts - Daiwa vs. consensus
| 2026E | 2026E | 2026E | 2027E | 2027E | 2027E | 2028E | 2028E | 2028E | |
|---|---|---|---|---|---|---|---|---|---|
| (TWDm) | Previous | New | Consensus | Previous | New | Consensus | Previous | New | Consensus |
| Revenue | 187,308 | 186,355 | 184,396 | 238,636 | 278,423 | 265,798 | 285,284 | 371,883 | 349,156 |
| Diff (%) | -0.5% | 1.1% | 16.7% | 4.7% | 30.4% | 6.5% | |||
| Gross Margin (%) | 23.0% | 26.2% | 23.3% | 34.4% | 38.5% | 32.2% | 38.4% | 45.6% | 36.0% |
| Operating profit | 24,828 | 31,297 | 26,831 | 59,331 | 85,025 | 65,240 | 82,472 | 141,596 | 105,856 |
| Op Margin (%) | 13.3% | 16.8% | 14.6% | 24.9% | 30.5% | 24.5% | 28.9% | 38.1% | 30.3% |
| Net profit | 24,580 | 32,206 | 25,574 | 50,398 | 69,085 | 53,498 | 69,037 | 114,372 | 86,131 |
| EPS | 15.99 | 20.95 | 16.64 | 32.78 | 44.95 | 34.81 | 44.90 | 74.41 | 56.04 |
| Diff (%) | 31.0% | 25.9% | 37.1% | 29.1% | 65.7% | 32.8% |
Source: Bloomberg, Daiwa forecasts
Unimicron: quarterly and annual P&L statement
| 2026E | 2027E | 2026E | 2026E | 2025 | 2026E | 2027E | 2028E | |||||
|---|---|---|---|---|---|---|---|---|---|---|---|---|
| (TWDm) | 1Q | 2Q | 3QE | 4QE | 1QE | 2QE | 3QE | 4QE | ||||
| Net revenue | 37,446 | 42,890 | 51,251 | 54,767 | 55,111 | 65,643 | 79,387 | 78,281 | 131,241 | 186,355 | 278,423 | 371,883 |
| COGS | -30,720 | -32,252 | -36,738 | -37,849 | -37,056 | -41,729 | -47,450 | -45,086 | -112,949 | -137,560 | -171,322 | -202,396 |
| Gross profit | 6,726 | 10,638 | 14,513 | 16,918 | 18,055 | 23,914 | 31,937 | 33,195 | 18,292 | 48,795 | 107,101 | 169,488 |
| Operating expenses | 3,993 | 3,987 | 4,613 | 4,929 | 4,684 | 5,251 | 6,113 | 6,028 | 11,782 | 17,522 | 22,076 | 27,891 |
| Operating profit | 2,757 | 6,651 | 9,901 | 11,988 | 13,371 | 18,663 | 25,824 | 27,167 | 6,674 | 31,297 | 85,025 | 141,596 |
| Non-operating profit | 3,542 | 8,925 | -4,428 | 600 | 621 | 648 | 639 | 688 | 2,153 | 8,639 | 2,597 | 2,572 |
| Pre-tax profit | 6,299 | 15,576 | 5,473 | 12,588 | 13,992 | 19,311 | 26,463 | 27,856 | 8,827 | 39,936 | 87,621 | 144,168 |
| Income taxes | -918 | -2,233 | -1,095 | -2,518 | -2,798 | -3,862 | -5,293 | -5,571 | -1,277 | -6,764 | -17,524 | -28,834 |
| Net profit | 5,043 | 13,115 | 4,184 | 9,864 | 10,964 | 15,190 | 20,909 | 22,022 | 6,673 | 32,206 | 69,085 | 114,372 |
| Net EPS (TWD) | 3.28 | 8.53 | 2.72 | 6.42 | 7.13 | 9.88 | 13.60 | 14.33 | 4.4 | 21.0 | 44.9 | 74.4 |
| Operating Ratios | ||||||||||||
| Gross margin | 18.0% | 24.8% | 28.3% | 30.9% | 32.8% | 36.4% | 40.2% | 42.4% | 13.9% | 26.2% | 38.5% | 45.6% |
| Operating margin | 7.4% | 15.5% | 19.3% | 21.9% | 24.3% | 28.4% | 32.5% | 34.7% | 5.1% | 16.8% | 30.5% | 38.1% |
| Pre-tax margin | 16.8% | 36.3% | 10.7% | 23.0% | 25.4% | 29.4% | 33.3% | 35.6% | 6.7% | 21.4% | 31.5% | 38.8% |
| Net margin | 13.5% | 30.6% | 8.2% | 18.0% | 19.9% | 23.1% | 26.3% | 28.1% | 5.1% | 17.3% | 24.8% | 30.8% |
| YoY (%) | ||||||||||||
| Net revenue | 24% | 32% | 51% | 58% | 47% | 53% | 55% | 43% | 14% | 42% | 49% | 34% |
| Gross profit | 67% | 151% | 219% | 209% | 168% | 125% | 120% | 96% | 12% | 167% | 119% | 58% |
| Operating profit | 118% | 341% | 546% | 407% | 385% | 181% | 161% | 127% | 30% | 369% | 172% | 67% |
| Pre-tax profit | 359% | 4266% | 86% | 203% | 122% | 24% | 384% | 121% | 21% | 352% | 119% | 65% |
| Net profit | 451% | 44197% | 91% | 179% | 117% | 16% | 400% | 123% | 31% | 383% | 115% | 66% |
| QoQ (%) | ||||||||||||
| Net revenue | 8% | 15% | 19% | 7% | 1% | 19% | 21% | -1% | ||||
| Gross profit | 23% | 58% | 36% | 17% | 7% | 32% | 34% | 4% | ||||
| Operating profit | 17% | 141% | 49% | 21% | 12% | 40% | 38% | 5% | ||||
| Pre-tax profit | 52% | 147% | -65% | 130% | 11% | 38% | 37% | 5% | ||||
| Net profit | 43% | 160% | -68% | 136% | 11% | 39% | 38% | 5% |
Source: Company, Daiwa forecasts
Unimicron: 2Q26 comparison table
| (TWDm) | Actual | QoQ% | YoY% | Daiwa | Diff% | Consensus | Diff% |
|---|---|---|---|---|---|---|---|
| Revenue | 42,890 | 15% | 32% | 44,404 | -3% | 42,708 | 0% |
| Gross profit | 10,638 | 58% | 151% | 9,108 | 17% | 9,268 | 15% |
| Gross margin (%) | 24.8% | 20.5% | 21.7% | ||||
| Operating profit | 6,651 | 141% | 341% | 4,889 | 36% | 5,486 | 21% |
| Operating margin (%) | 15.5% | 11.0% | 12.8% | ||||
| Pre-tax profit | 15,576 | 147% | 4266% | 5,745 | 171% | 7,507 | 107% |
| Net profit | 13,115 | 160% | 44197% | 4,434 | 196% | 5,439 | 141% |
| EPS (TWD) | 8.53 | 160% | 44197% | 2.88 | 196% | 3.54 | 141% |
Source: Company data, Daiwa forecasts, Bloomberg
Unimicron: 1-year forward PER bands
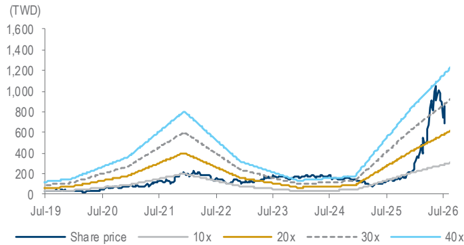
Source: TEJ, Daiwa forecasts
Unimicron: 1-year forward PBR bands
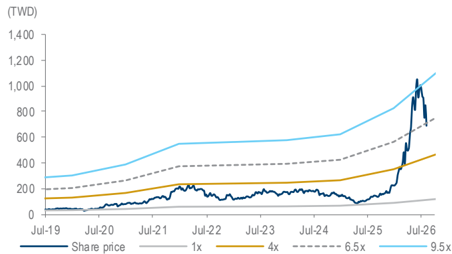
Source: Company, Daiwa forecasts
Daiwa
Financial summary
Key assumptions
| Year to 31 Dec | 2021 | 2022 | 2023 | 2024 | 2025 | 2026E | 2027E | 2028E |
|---|---|---|---|---|---|---|---|---|
| Global PC shipment (mn) | 361 | 301 | 260 | 263 | 287 | 244 | 244 | 244 |
| Regular server shipment (mn) | 14 | 15 | 12 | 14 | 16 | 18 | 22 | 26 |
| Global smartphone shipment (mn) | 1,655 | 1,437 | 1,380 | 1,437 | 1,429 | 1,249 | 1,255 | 1,300 |
Profit and loss (TWDm)
| Year to 31 Dec | 2021 | 2022 | 2023 | 2024 | 2025 | 2026E | 2027E | 2028E |
|---|---|---|---|---|---|---|---|---|
| Substrate | 57,486 | 93,989 | 66,057 | 70,882 | 76,127 | 117,366 | 203,631 | 293,207 |
| HDI | 27,167 | 26,940 | 21,073 | 27,826 | 35,736 | 46,397 | 52,299 | 55,797 |
| Other Revenue | 19,910 | 19,559 | 16,907 | 16,665 | 19,378 | 22,592 | 22,494 | 22,879 |
| Total Revenue | 104,563 | 140,489 | 104,036 | 115,373 | 131,241 | 186,355 | 278,423 | 371,883 |
| Other income | 0 | 0 | 0 | 0 | 0 | 0 | 0 | 0 |
| COGS | (80,900) | (90,056) | (83,735) | (99,058) | (112,949) | (137,560) | (171,322) | (202,396) |
| SG&A | (5,913) | (6,478) | (6,554) | (6,222) | (6,469) | (9,768) | (12,208) | (15,429) |
| Other op.expenses | (4,579) | (5,783) | (4,828) | (4,977) | (5,149) | (7,730) | (9,869) | (12,462) |
| Operating profit | 13,170 | 38,172 | 8,920 | 5,117 | 6,674 | 31,297 | 85,025 | 141,596 |
| Net-interest inc./(exp.) | (325) | (447) | (625) | (786) | (1,104) | (1,075) | (1,103) | (1,085) |
| Assoc/forex/extraord./others | 3,784 | 2,150 | 7,280 | 2,990 | 3,257 | 9,714 | 3,700 | 3,657 |
| Pre-tax profit | 16,629 | 39,875 | 15,575 | 7,321 | 8,827 | 39,936 | 87,621 | 144,168 |
| Tax | (3,104) | (8,649) | (3,350) | (1,765) | (1,277) | (6,764) | (17,524) | (28,834) |
| Min. int./pref. div./others | (302) | (1,607) | (245) | (474) | (877) | (966) | (1,012) | (963) |
| Net profit (reported) | 13,222 | 29,619 | 11,980 | 5,082 | 6,673 | 32,206 | 69,085 | 114,372 |
| Net profit (adjusted) | 13,222 | 29,619 | 11,980 | 5,082 | 6,673 | 32,206 | 69,085 | 114,372 |
| EPS (reported)(TWD) | 8.999 | 20.086 | 7.884 | 3.341 | 4.381 | 20.954 | 44.949 | 74.415 |
| EPS (adjusted)(TWD) | 8.999 | 20.086 | 7.884 | 3.341 | 4.381 | 20.954 | 44.949 | 74.415 |
| EPS (adjusted fully-diluted)(TWD) | 8.999 | 20.086 | 7.884 | 3.341 | 4.381 | 20.954 | 44.949 | 74.415 |
| DPS (TWD) | 3.400 | 7.993 | 3.000 | 1.500 | 1.752 | 8.381 | 17.980 | 29.766 |
| EBIT | 13,170 | 38,172 | 8,920 | 5,117 | 6,674 | 31,297 | 85,025 | 141,596 |
| EBITDA | 22,944 | 49,899 | 24,017 | 22,347 | 25,447 | 52,285 | 108,636 | 168,159 |
Cash flow (TWDm)
| Year to 31 Dec | 2021 | 2022 | 2023 | 2024 | 2025 | 2026E | 2027E | 2028E |
|---|---|---|---|---|---|---|---|---|
| Profit before tax | 16,629 | 39,875 | 15,575 | 7,321 | 8,827 | 39,936 | 87,621 | 144,168 |
| Depreciation and amortisation | 9,774 | 11,727 | 15,097 | 17,231 | 18,773 | 20,988 | 23,611 | 26,563 |
| Tax paid | (3,104) | (8,649) | (3,350) | (1,765) | (1,277) | (6,764) | (17,524) | (28,834) |
| Change in working capital | (8,156) | (7,696) | 12,490 | (5,295) | (4,548) | (8,883) | (13,631) | (11,324) |
| Other operational CF items | 27,814 | 25,826 | (8,913) | (7,198) | (6,808) | (2,070) | (0) | (0) |
| Cash flow from operations | 42,957 | 61,082 | 30,900 | 10,294 | 14,967 | 43,207 | 80,077 | 130,574 |
| Capex | (23,167) | (32,073) | (22,938) | (26,128) | (25,617) | (50,475) | (25,000) | (25,000) |
| Net (acquisitions)/disposals | 0 | 0 | 0 | 0 | 0 | 0 | 0 | 0 |
| Other investing CF items | (1,289) | (1,323) | 1,839 | (3,102) | 2,600 | 2,681 | 2,333 | 3,497 |
| Cash flow from investing | (24,456) | (33,396) | (21,099) | (29,230) | (23,018) | (47,793) | (22,667) | (21,503) |
| Change in debt | (1,412) | (818) | (6,210) | 13,215 | 9,324 | 6,917 | 8,455 | 8,471 |
| Net share issues/(repurchases) | 0 | 0 | 0 | 0 | 0 | 0 | 0 | 0 |
| Dividends paid | (2,055) | (5,016) | (12,190) | (4,575) | (2,295) | (2,693) | (12,882) | (27,634) |
| Other financing CF items | (518) | 1,003 | 341 | (303) | 12,044 | 3,730 | 0 | 0 |
| Cash flow from financing | (3,984) | (4,831) | (18,060) | 8,336 | 19,073 | 7,955 | (4,426) | (19,163) |
| Forex effect/others | 691 | (797) | (341) | 1,494 | 96 | 1,171 | 1,338 | 1,146 |
| Change in cash | 15,207 | 22,058 | (8,600) | (9,106) | 11,118 | 4,539 | 54,322 | 91,054 |
| Free cash flow | 19,789 | 29,009 | 7,962 | (15,834) | (10,650) | (7,268) | 55,077 | 105,574 |
Source: FactSet, Daiwa forecasts
Unimicron Technology Corp (3037 TT): 29 July 2026
Daiwa
Financial summary continued …
Balance sheet (TWDm)
| Year to 31 Dec | 2021 | 2022 | 2023 | 2024 | 2025 | 2026E | 2027E | 2028E |
|---|---|---|---|---|---|---|---|---|
| Cash & short-term investment | 39,498 | 61,496 | 52,948 | 43,972 | 55,049 | 59,651 | 113,973 | 205,027 |
| Inventory | 12,152 | 12,835 | 10,927 | 14,863 | 17,802 | 22,355 | 27,050 | 31,933 |
| Accounts receivable | 23,639 | 28,746 | 18,563 | 23,612 | 27,565 | 43,765 | 62,378 | 80,132 |
| Other current assets | 4,588 | 4,511 | 4,141 | 4,423 | 4,882 | 5,813 | 5,813 | 5,813 |
| Total current assets | 79,877 | 107,588 | 86,579 | 86,869 | 105,298 | 131,585 | 209,214 | 322,905 |
| Fixed assets | 77,869 | 99,297 | 116,168 | 127,593 | 134,103 | 162,556 | 163,945 | 162,382 |
| Goodwill & intangibles | 0 | 0 | 0 | 0 | 0 | 0 | 0 | 0 |
| Other non-current assets | 12,309 | 11,779 | 13,259 | 16,385 | 16,391 | 17,393 | 15,059 | 11,563 |
| Total assets | 170,055 | 218,663 | 216,006 | 230,847 | 255,792 | 311,533 | 388,218 | 496,850 |
| Short-term debt | 12,771 | 10,056 | 5,574 | 10,871 | 22,206 | 30,886 | 36,787 | 42,943 |
| Accounts payable | 29,928 | 33,419 | 29,839 | 34,362 | 38,848 | 50,190 | 59,866 | 71,179 |
| Other current liabilities | 6,361 | 11,417 | 8,834 | 13,148 | 14,401 | 21,236 | 21,236 | 21,236 |
| Total current liabilities | 49,060 | 54,893 | 44,247 | 58,382 | 75,455 | 102,311 | 117,888 | 135,358 |
| Long-term debt | 22,242 | 24,563 | 24,807 | 32,905 | 34,873 | 27,360 | 29,914 | 32,229 |
| Other non-current liabilities | 33,236 | 46,550 | 50,667 | 39,973 | 38,457 | 39,392 | 39,392 | 39,392 |
| Total liabilities | 104,539 | 126,005 | 119,721 | 131,260 | 148,785 | 169,063 | 187,195 | 206,980 |
| Share capital | 14,753 | 14,784 | 15,251 | 15,300 | 15,296 | 15,892 | 15,892 | 15,892 |
| Reserves/R.E./others | 50,764 | 77,875 | 81,033 | 84,287 | 91,711 | 126,577 | 185,131 | 273,978 |
| Shareholders' equity | 65,516 | 92,658 | 96,284 | 99,587 | 107,007 | 142,470 | 201,023 | 289,870 |
| Minority interests | 0 | 0 | 0 | 0 | 0 | 0 | 0 | 0 |
| Total equity & liabilities | 170,055 | 218,663 | 216,006 | 230,847 | 255,792 | 311,533 | 388,218 | 496,850 |
| EV | 1,052,940 | 1,030,548 | 1,034,857 | 1,057,228 | 1,059,454 | 1,056,019 | 1,010,152 | 927,570 |
| Net debt/(cash) | (4,484) | (26,876) | (22,567) | (196) | 2,030 | (1,405) | (47,272) | (129,855) |
| BVPS (TWD) | 41.154 | 57.993 | 59.445 | 60.958 | 65.749 | 87.005 | 123.212 | 178.512 |
Key ratios (%)
| Year to 31 Dec | 2021 | 2022 | 2023 | 2024 | 2025 | 2026E | 2027E | 2028E |
|---|---|---|---|---|---|---|---|---|
| Sales (YoY) | 19.0 | 34.4 | (25.9) | 10.9 | 13.8 | 42.0 | 49.4 | 33.6 |
| EBITDA (YoY) | 78.2 | 117.5 | (51.9) | (7.0) | 13.9 | 105.5 | 107.8 | 54.8 |
| Operating profit (YoY) | 227.9 | 189.8 | (76.6) | (42.6) | 30.4 | 368.9 | 171.7 | 66.5 |
| Net profit (YoY) | 142.1 | 124.0 | (59.6) | (57.6) | 31.3 | 382.6 | 114.5 | 65.6 |
| Core EPS (fully-diluted) (YoY) | 140.3 | 123.2 | (60.7) | (57.6) | 31.1 | 378.3 | 114.5 | 65.6 |
| Gross-profit margin | 22.6 | 35.9 | 19.5 | 14.1 | 13.9 | 26.2 | 38.5 | 45.6 |
| EBITDA margin | 21.9 | 35.5 | 23.1 | 19.4 | 19.4 | 28.1 | 39.0 | 45.2 |
| Operating-profit margin | 12.6 | 27.2 | 8.6 | 4.4 | 5.1 | 16.8 | 30.5 | 38.1 |
| Net profit margin | 12.6 | 21.1 | 11.5 | 4.4 | 5.1 | 17.3 | 24.8 | 30.8 |
| ROAE | 22.3 | 37.5 | 12.7 | 5.2 | 6.5 | 25.8 | 40.2 | 46.6 |
| ROAA | 9.0 | 15.2 | 5.5 | 2.3 | 2.7 | 11.4 | 19.7 | 25.8 |
| ROCE | 13.9 | 33.5 | 7.0 | 3.8 | 4.3 | 17.2 | 36.3 | 44.8 |
| ROIC | 16.9 | 47.1 | 10.0 | 4.5 | 5.5 | 20.8 | 46.1 | 72.2 |
| Net debt to equity | net cash | net cash | net cash | 0.0 | 2.1 | 2.0 | net cash | net cash |
| Effective tax rate | 18.7 | 21.7 | 21.5 | 24.1 | 14.5 | 16.9 | 20.0 | 20.0 |
| Accounts receivable (days) | 71.4 | 68.1 | 83.0 | 66.7 | 71.2 | 69.9 | 69.6 | 69.9 |
| Current ratio (x) | 1.6 | 2.0 | 2.0 | 1.5 | 1.4 | 1.3 | 1.8 | 2.4 |
| Net interest cover (x) | 52.2 | 90.2 | 25.9 | 10.3 | 9.0 | 38.1 | 80.4 | 133.8 |
| Net dividend payout | 37.8 | 39.8 | 38.1 | 44.8 | 40.0 | 40.0 | 40.0 | 40.0 |
| Free cash flow yield | 1.9 | 2.7 | 0.8 | n.a. | n.a. | n.a. | 5.2 | 10.0 |
Source: FactSet, Daiwa forecasts
Company profile
Unimicron is a leading global manufacturer of IC substrate. The company also produces high-density interconnection (HDI) boards, flexible PCBs (FPC), and rigid flex PCBs (RFPCB). The company has manufacturing sites in Taiwan, China, Japan and Germany, with products' major applications including servers, PC/NB, and smartphones.
Unimicron Technology Corp (3037 TT): 29 July 2026
Daiwa
ESG analysis
ESG risks
| Risks | Management | Analyst comments | |
|---|---|---|---|
| Executive/board quality | 1 | including business management, financial accounting, chemical industry, physics and investment. This diversity enables the board to provide comprehensive oversight and guidance across various aspects of corporate governance, environmental sustainability and social responsibility. The board includes three independent directors, one of whom is female, ensuring a degree of independence and gender diversity in its composition. | Unimicron's |
| G Capital | management | 1 | Unimicron's capital management strategy focuses on ensuring the availability of necessary financial resources to support its operations and growth. This approach reflects a commitment to maintaining a robust financial position, which is essential for sustainable development and resilience in the high-tech electronics industry. Overall, Unimicron's capital management practices demonstrate a prudent approach to financial governance, aligning with ESG principles by ensuring financial stability and supporting sustainable growth. |
| Related party & transaction | 2 | Unimicron engages in related-party transactions, primarily involving its subsidiaries and affiliates. These transactions include sales, purchases and investments conducted under terms comparable to those with independent third parties. The company adheres to established procedures for board meetings, which include provisions for handling related-party transactions. Significant transactions, such as donations to related parties or major donations to non-related parties, require board approval to ensure transparency and compliance with corporate governance standards. | |
| S Supply chain management | 1 | Unimicron demonstrates a strong commitment to sustainable supply chain management, integrating risk management into daily procurement activities. The company has established a Procurement Risk Management Procedure within its supply chain risk framework, utilising a risk matrix to assess and mitigate potential risks. The company holds annual supplier meetings to communicate standards and expectations, and to recognise outstanding suppliers. Overall, Unimicron's supply chain management practices reflect a comprehensive approach to sustainability, risk management and supplier collaboration, aligning with its corporate social responsibility objectives. | |
| E Data security | 1 | Unimicron places significant emphasis on data security and privacy protection. The company has established an Information Security Management Committee to oversee and implement its data security strategies. This committee is responsible for formulating and enforcing the Information Security Management Plan, which includes measures to protect customer privacy and ensure the integrity of information systems. The company also adheres to a comprehensive Privacy Policy that outlines the collection, use and protection of personal information. This policy ensures compliance with relevant data protection regulations and demonstrates the company's commitment to maintaining the confidentiality and security of personal data. |
Update Date: 25 Feb 2026 Source: Daiwa, Company Note: Management score represents a company's ability to manage/benefit from certain ESG topics. The scores range from 1 to 3, with 1 being the strongest.
Unimicron Technology Corp (3037 TT): 29 July 2026
Daiwa