trimmed 版本行數比例 39.5%(低於 40% 門檻)之說明
已核對完整版 .md(294 行)與 trimmed 版(116 行)之差異:被砍除部分全為 Daiwa 標準法遵揭露文字(Hong Kong/Singapore/Australia/Taiwan/Thailand/UK/US 等地區揭露、評等系統說明、Ownership/Investment Banking Relationship 制式段落),不含任何個股分析或數字內容。本頁採用 trimmed 版本落地(分析內容完整無漏),不另附法遵文字全文。
圖片清單(已驗證 2026-09-24)
| 檔名 | size | 分類 | 親眼所見內容 |
|---|---|---|---|
報告_Daiwa_尖點8021_20260923_001.png |
21KB | 真資料圖 | 「Share price performance」股價走勢圖:Topoint 股價(TWD,左軸藍線)與相對 TWSE 指數表現(%,右軸橘線),橫軸 Sep-25 至 Sep-26,兩線同步自低點約 100-150 攀升至 450-500 區間 |
報告_Daiwa_尖點8021_20260923_002.png |
26KB | 真資料圖 | 「1-year-forward PER」本益比河流圖:股價(深藍線)疊 1x/14x/27x/40x/53x 前瞻本益比參考線,橫軸 Sep-23 至 Sep-26,股價 2026 年大幅突破 27x 線、一度貼近 40x 線後拉回約落於 27x-40x 之間 |
報告_Daiwa_尖點8021_20260923_003.png |
20KB | 真資料圖 | 「product-mix trend」產品組合趨勢圖(堆疊柱狀,2021-1H26):PCB Drills(深藍,佔比由 2021 年 61% 逐年提升至 1H26 68%)/Drilling Service(灰,由 39% 降至 32%) |
報告_Daiwa_尖點8021_20260923_004.png |
19KB | 真資料圖 | 「UTR trend」稼動率趨勢折線圖(1Q24-2Q26):PCB Drills UTR(深藍線,由約 68% 升至約 88-95% 區間後 2Q26 微降至約 87%)/Drilling Service UTR(橘線,由約 44% 升至 2Q26 約 75%) |
報告_Daiwa_尖點8021_20260923_005.png |
11KB | 真資料圖 | 「monthly capacity trend」月產能柱狀圖(PCB Drills,mn units,2023-2028E):2023/2024/2025 約 30/32/33,2026E 約 47,2027E 約 73,2028E 約 95 |
上列 5 張圖檔案雖 <40KB(低於一般篩選門檻),但 trimmed 文字在每張圖前皆有明確圖表標題(Share price performance/1-year-forward PER/product-mix trend/UTR trend/monthly capacity trend),判斷為報告核心圖表,故例外逐張 Read 確認。
PDF 原檔:報告_Daiwa_尖點8021_20260923_original.pdf
原始內容
Topoint Technology (8021 TT)
Target price: n.a.
Shareprice(22Sep):TWD477.00 | Up/downside:-
A key supplier riding the drill-bit upcycle
- Top-3 global drill-bit supplier expanding capacity with customer backing
- Ongoing high-end drill-bit upgrades to sustain margin expansion
- Currently trading at 18x/14x 2027/28E PER based on consensus
Background: Topoint was among the world's top 3 PCB drill-bit suppliers by revenue and sales volume in 2025. It supplies drill bits and router bits to PCB manufacturers and expanded into PCB drilling services in 2010. In 2Q26, drill bits accounted for 68% of revenue, while drilling services accounted for 32%. It operates drill-bit manufacturing facilities and drillingservice sites in Taiwan, China and Thailand.
Highlights: AI PCB upgrades are driving drill-bit market growth. AI PCBs increasingly feature 30+ layers, M8-grade CCL or higher-grade materials, and denser routing, driving demand for PCB drill bits in 3 ways: 1) more interconnects increase the number of holes to be drilled; 2) thicker, harder boards accelerate bit wear and raise consumption; and 3) more demanding drilling requirements support greater adoption of high-end bits. Frost & Sullivan forecasts the global PCB drill-bit market to grow at a 9.6% CAGR in 2026-30, outpacing the global PCB market.
Customer investment underscores tight drill-bit supply. With drill-bit capacity running at near-full utilisation, management expects monthly drillbit capacity to rise from 32m units at end-2025 to 45-50m at end-2026, 7075m at end-2027 and 90-100m at end-2028. Notably, key customers Unimicron (3037 TT, TWD1,160, Buy [1], covered by Sheng Cheng), GCE (2368 TT, TWD1,140, Buy [1], covered by Sheng Cheng) and Zhen Ding (4958 TT, not rated) have participated in Topoint's private convertible-bond offering, providing funding for its expansion.
Coated drill bits and high-aspect-ratio drilling driving spec upgrades.
Tungsten is a key raw material for PCB drill bits, with Topoint sourcing it based on plant location. Topoint adjusts prices to reflect changes in costs and raised prices by 20% in 1H26. Alongside price hikes, a richer product mix lifted 2Q26 gross margin to a record high, up 5.2pp QoQ and 12.3pp YoY. As PCBs become harder, demand is shifting towards coated drill bits. Coatings such as diamond-like carbon improve wear resistance and bit life, while helping to maintain hole-wall quality and drilling yields. High-end coated products accounted for 56% of the drill-bit shipment mix in 1H26, up from 48% in 2025. Thicker boards and smaller hole diameters are also driving a shift towards micro drill bits with high aspect ratios, supporting ASPs and margins. Looking ahead, next-gen CCL materials present further drilling challenges: PTFE can adhere to the bit during machining, while quartz fibre accelerates wear. Per Topoint, these spec upgrades will sustain product-mix improvement and support higher margins over the long term.
Valuation: Topoint is currently trading at 17.7/13.8x 2027/28E PER based on Bloomberg consensus (vs. its average 1-year forward PER of 27x).
Rating No
Stacy Lin (886) 2 8758 6252 stacy.lin@daiwacm-cathay.com.tw
Leon Chen (886) 2 8758 6247 leon.chen@daiwacm-cathay.com.tw
Share price performance
| 12-month range | 89.12-581.00 |
|---|---|
| Market cap (USDbn) | 2.18 |
| 3m avg daily turnover (USDm) | 71.32 |
Source: FactSet, Daiwa forecasts
Topoint: quarterly and annual P&L statement
| (TWDm) | 2024 - 1Q | 2024 - 2Q | 2024 - 3Q | 2024 - 4Q | 2025 - 1Q | 2025 - 2Q | 2025 - 3Q | 2026 - 4Q | 2026 - 1Q | 2026 - 2Q | 2024 | 2025 | 1H26 |
|---|---|---|---|---|---|---|---|---|---|---|---|---|---|
| Net revenue | 736 | 890 | 962 | 953 | 887 | 1,013 | 1,169 | 1,341 | 1,340 | 1,826 | 3,541 | 4,410 | 3,166 |
| COGS | -569 | -654 | -696 | -694 | -658 | -715 | -803 | -874 | -849 | -1,063 | -2,614 | -3,050 | -1,913 |
| Gross profit | 167 | 236 | 266 | 259 | 229 | 298 | 366 | 467 | 490 | 763 | 927 | 1,361 | 1,253 |
| Operating expenses | -147 | -162 | -163 | -174 | -160 | -166 | -183 | -209 | -218 | -261 | -646 | -718 | -479 |
| Operating profit | 14 | 81 | 104 | 80 | 72 | 141 | 186 | 258 | 270 | 513 | 278 | 657 | 782 |
| Non-operating profit | 6 | 3 | 5 | -1 | 3 | -4 | 7 | 1 | 0 | 6 | 14 | 7 | 6 |
| Pre-tax profit | 21 | 84 | 109 | 79 | 75 | 137 | 193 | 259 | 270 | 518 | 292 | 664 | 788 |
| Income taxes | -9 | -10 | -34 | -27 | -21 | -43 | -64 | -80 | -80 | -156 | -79 | -207 | -236 |
| Net profit | 21 | 68 | 68 | 49 | 52 | 78 | 109 | 150 | 169 | 302 | 206 | 389 | 471 |
| Net EPS (TWD) | 0.15 | 0.48 | 0.48 | 0.34 | 0.36 | 0.55 | 0.77 | 1.06 | 1.17 | 2.08 | 1.45 | 2.74 | 3.25 |
| Operating Ratios | |||||||||||||
| Gross margin | 22.7% | 26.5% | 27.6% | 27.1% | 25.8% | 29.4% | 31.3% | 34.8% | 36.6% | 41.8% | 26.2% | 30.9% | 39.6% |
| Operating margin | 2.0% | 9.1% | 10.8% | 8.4% | 8.2% | 13.9% | 15.9% | 19.2% | 20.1% | 28.1% | 7.9% | 14.9% | 24.7% |
| Pre-tax margin | 2.8% | 9.4% | 11.3% | 8.3% | 8.5% | 13.5% | 16.5% | 19.3% | 20.1% | 28.4% | 8.2% | 15.1% | 24.9% |
| Net margin | 2.9% | 7.6% | 7.1% | 5.1% | 5.8% | 7.7% | 9.4% | 11.2% | 12.6% | 16.5% | 5.8% | 8.8% | 14.9% |
| YoY (%) | |||||||||||||
| Net revenue | 19% | 45% | 31% | 22% | 21% | 14% | 22% | 41% | 51% | 80% | 29% | 25% | 67% |
| Gross profit | 27% | 110% | 45% | 36% | 37% | 26% | 38% | 81% | 114% | 156% | 50% | 47% | 138% |
| Operating profit | 252% | nmf | 150% | 73% | 401% | 75% | 80% | 223% | 273% | 264% | 240% | 136% | 267% |
| Pre-tax profit | 22% | 1254% | 94% | 36% | 263% | 63% | 78% | 229% | 258% | 278% | 113% | 127% | 271% |
| Net profit | 32% | nmf | 97% | 33% | 144% | 16% | 60% | 207% | 225% | 286% | nmf | 89% | 261% |
| QoQ (%) | |||||||||||||
| Net revenue | -6% | 21% | 8% | -1% | -7% | 14% | 15% | 15% | 0% | 36% | |||
| Gross profit | -12% | 41% | 13% | -3% | -11% | 30% | 23% | 28% | 5% | 56% | |||
| Operating profit | -69% | 459% | 29% | -23% | -9% | 95% | 32% | 38% | 5% | 90% | |||
| Pre-tax profit | -64% | 304% | 29% | -28% | -4% | 82% | 41% | 34% | 4% | 92% | |||
| Net profit | -42% | 218% | 1% | -29% | 6% | 51% | 40% | 37% | 13% | 79% |
Source: Company
Topoint: 1-year-forward PER
Topoint: product-mix trend
Source: Bloomberg
Topoint: UTR trend
Source: Topoint
Topoint: monthly capacity trend
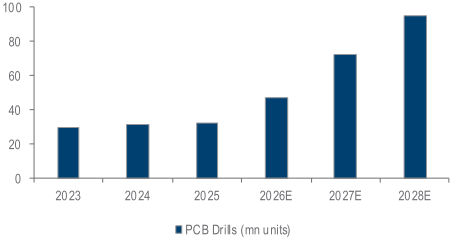
Source: Topoint
Source: Topoint
Notes: year-end capacity