PDF 原檔:報告_Daiwa_台達電2308_20260730_original.pdf
圖片清單(已驗證 2026-07-31)
| 檔名 | size | 分類 | 親眼所見內容 |
|---|---|---|---|
260730_daiwa_delta_001.png |
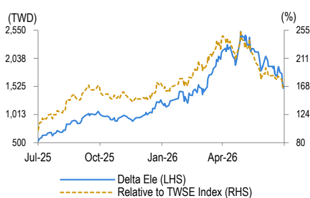
25KB | 真資料圖 | 台達電股價(藍線)與相對 TWSE 指數(橘虛線)走勢,Jul-25 至 Apr-26 |
260730_daiwa_delta_002.png |
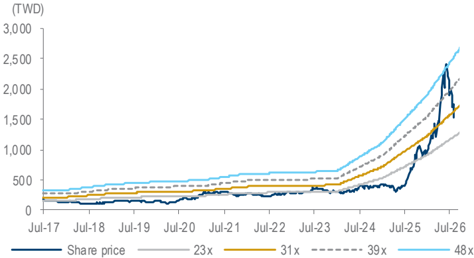
36KB | 真資料圖 | 台達電 1 年期遠期本益比帶圖(23x/31x/39x/48x),Jul-17 至 Jul-26,股價近期於高檔回落 |
260730_daiwa_delta_003.png |
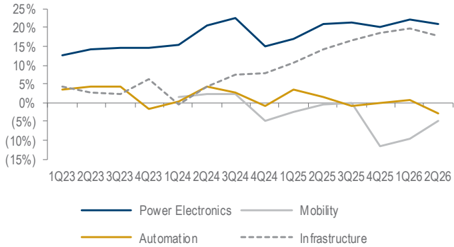
39KB | 真資料圖 | 各事業群別營益率季度走勢(Power Electronics/Mobility/Automation/Infrastructure),1Q23 至 2Q26 |
原始內容
Taiwan
Delta Electronics (2308 TT)
Target price:
TWD2,988.00 (from TWD2,922.00)
Share price (30 Jul):
TWD1,530.00 | Up/downside: +95.3%
2Q26 review: worst is likely over
- 2H26 outlook is promising on seasonality
- Competition and new product development are largely on track
- Reaffirming Buy (1) rating; lifting 12M TP to TWD2,988
What's new: We provide our latest view on Delta after its 2Q26 results call.
What's the impact: 2Q26 results beat on non-op gains. Delta's 2Q26 earnings came in at TWD25.1bn (EPS: TWD9.68), 2% above our estimate and largely in line with consensus. While revenue was higher than our forecast by 5%, it could have been even higher if there were no raw material shortages. Gross margin missed our estimate by 1pp, primarily driven by weaker-than-expected DET segment margins, which were weighed down by three factors: 1) a one-time inventory write-off on unsold products; 2) raw material cost hikes; and 3) an unfavourable product mix, as shortages impacted high-margin product lines. Operating margin also disappointed at 1.9pp below our forecast, as the component shortage drove an unfavourable product mix and less operating leverage. On a brighter note, net profit received a meaningful boost from a higher-thanexpected non-operating gain, driven by a TWD2.1bn FVTPL contribution.
Business outlook. During the results call, management had a positive tone on the business outlook regarding the AI capex cycle, near-term performance, competition landscape, and development of HVDC & other new technologies. For the near term, we believe Delta can achieve revenue growth on seasonality. We believe revenue growth QoQ would be 12% in 3Q26E and 3% in 4Q26E. We also forecast the gross margin to rebound to c.36% (1pp higher than in 2Q26) given the lack of one-off inventory writeoffs and an improving product mix. Per management, the component shortage is still under control and costs might be passed to end customers despite a time lag. While there are some concerns over rising competition in the power segment, including from Vertiv, Flex-Power, Megmeet, and Honoto, Delta is confident of its leading position within the server power segment given its track record and current fast spec migration trend. Delta is still confident that its +-400V VDC will see higher shipment (vs. 800V VDC) in 2026, while we might have wait until 2027 for a higher adoption of 800V VDC. In terms of the AI capex cycle, although there is a lot of noise in the short term, Delta does not expect a slowdown anytime soon.
What we recommend: We raise our 2026-28E EPS by 1-3% to reflect slightly higher revenue assumptions. We lift our 12M TP to TWD2,988 (from TWD2,922) based on an unchanged target PER of 55x (higher than its past-3-year range of 11-50x) applied to our 1-year-forward EPS forecast. Key downside risk: less-than-expected demand.
How we differ: Our 2028 revenue forecast is 9% above the Bloomberg consensus, likely due to our more bullish HVDC adoption rate assumption.
5
Daiwa
3
→
2
1
Buy
Sheng Cheng
(886) 2 8758 6253
sheng.cheng@daiwacm-cathay.com.tw
Allan Wang (886) 2 8758 6249 allan.wang@daiwacm-cathay.com.tw
Forecast revisions (%)
| Year to 31 Dec | 26E | 27E | 28E |
|---|---|---|---|
| Revenue change | 5.2 | 7.5 | 9.3 |
| Net profit change | 1.5 | 1.1 | 3 |
| Core EPS (FD) change | 1.5 | 1.1 | 3 |
Source: Daiwa forecasts
Share price performance
| 12-month range | 567.00-2,520.00 |
|---|---|
| Market cap (USDbn) | 122.75 |
| 3m avg daily turnover (USDm) | 787.47 |
| Shares outstanding (m) | 2,598 |
| Major shareholder | Hsiang Ta International (10.3%) |
Financial summary (TWD)
| Year to 31 Dec | 26E | 27E | 28E |
|---|---|---|---|
| Revenue (m) | 758,318 | 1,077,026 | 1,603,479 |
| Operating profit (m) | 136,739 | 218,460 | 354,257 |
| Net profit (m) | 103,133 | 160,325 | 258,555 |
| Core EPS (fully-diluted) | 39.704 | 61.722 | 99.538 |
| EPS change (%) | 71.6 | 55.5 | 61.3 |
| Daiwa vs Cons. EPS (%) | (3.2) | (5.6) | 2.3 |
| PER (x) | 38.5 | 24.8 | 15.4 |
| Dividend yield (%) | 0.8 | 1.3 | 2.0 |
| DPS | 11.6 | 20.0 | 30.0 |
| PBR (x) | 10.8 | 8.1 | 5.7 |
| EV/EBITDA (x) | 23.9 | 15.5 | 9.8 |
| ROE (%) | 32.5 | 37.3 | 43.5 |
Source: FactSet, Daiwa forecasts
Delta Electronics: revenue and earnings forecasts - Daiwa vs. consensus
| 2026E | 2026E | 2026E | 2027E | 2027E | 2027E | 2028E | 2028E | 2028E | |
|---|---|---|---|---|---|---|---|---|---|
| (TWDm) | Previous | New | Consensus | Previous | New | Consensus | Previous | New | Consensus |
| Revenue | 720,711 | 758,318 | 768,662 | 1,002,184 | 1,077,026 | 1,076,927 | 1,466,796 | 1,603,479 | 1,468,734 |
| Diff (%) | 5.2% | -1.3% | 7.5% | 0.0% | 9.3% | 9.2% | |||
| Gross Margin (%) | 36.7% | 36.3% | 36.8% | 36.7% | 36.4% | 37.8% | 37.4% | 36.8% | 38.6% |
| Operating profit | 135,098 | 136,739 | 146,337 | 215,592 | 218,460 | 231,685 | 342,138 | 354,257 | 345,130 |
| Op Margin (%) | 18.7% | 18.0% | 19.0% | 21.5% | 20.3% | 21.5% | 23.3% | 22.1% | 23.5% |
| Net profit | 101,656 | 103,133 | 106,528 | 158,647 | 160,325 | 169,892 | 251,013 | 258,555 | 252,712 |
| EPS | 39.14 | 39.70 | 41.01 | 61.08 | 61.72 | 65.40 | 96.63 | 99.54 | 97.29 |
| Diff (%) | 1.5% | -3.2% | 1.1% | -5.6% | 3.0% | 2.3% |
Source: Bloomberg, Daiwa forecasts
Delta: quarterly and annual P&L statement
| 2026E | 2026E | 2026E | 2026E | 2027E | 2027E | 2027E | 2027E | 2025 | 2026E | 2027E | 2028E | |
|---|---|---|---|---|---|---|---|---|---|---|---|---|
| (TWDm) | 1Q | 2Q | 3QE | 4QE | 1QE | 2QE | 3QE | 4QE | ||||
| Net revenue | 159,353 | 183,256 | 204,794 | 210,915 | 216,124 | 248,525 | 287,101 | 325,275 | 554,885 | 758,318 | 1,077,026 | 1,603,479 |
| COGS | -100,392 | -117,948 | -130,267 | -134,538 | -137,594 | -157,434 | -181,656 | -207,969 | -364,729 | -483,144 | -684,653 | -1,013,402 |
| Gross profit | 58,961 | 65,308 | 74,527 | 76,377 | 78,530 | 91,091 | 105,445 | 117,306 | 190,157 | 275,173 | 392,373 | 590,077 |
| Operating expenses | -30,544 | -34,738 | -36,453 | -36,699 | -37,606 | -41,504 | -45,362 | -49,442 | -106,224 | -138,434 | -173,913 | -235,821 |
| Operating profit | 28,417 | 30,570 | 38,074 | 39,678 | 40,925 | 49,587 | 60,083 | 67,864 | 83,932 | 136,739 | 218,460 | 354,257 |
| Non-operating profit | 2,676 | 4,430 | 1,797 | 1,811 | 1,520 | 1,513 | 1,510 | 1,813 | 3,934 | 10,713 | 6,356 | 5,752 |
| Pretax profit | 31,093 | 35,000 | 39,871 | 41,489 | 42,445 | 51,100 | 61,593 | 69,678 | 87,866 | 147,452 | 224,816 | 360,009 |
| Income taxes | -7,258 | -7,831 | -8,772 | -9,128 | -9,126 | -10,987 | -13,243 | -14,981 | -19,930 | -32,988 | -48,335 | -77,402 |
| Net profit | 20,556 | 25,142 | 28,027 | 29,408 | 30,077 | 36,386 | 44,044 | 49,818 | 60,108 | 103,133 | 160,325 | 258,555 |
| Net EPS (TWD) | 7.91 | 9.68 | 10.79 | 11.32 | 11.58 | 14.01 | 16.96 | 19.18 | 23.14 | 39.70 | 61.72 | 99.54 |
| Operating Ratios | ||||||||||||
| Gross margin | 37.0% | 35.6% | 36.4% | 36.2% | 36.3% | 36.7% | 36.7% | 36.1% | 34.3% | 36.3% | 36.4% | 36.8% |
| Operating margin | 17.8% | 16.7% | 18.6% | 18.8% | 18.9% | 20.0% | 20.9% | 20.9% | 15.1% | 18.0% | 20.3% | 22.1% |
| Pre-tax margin | 19.5% | 19.1% | 19.5% | 19.7% | 19.6% | 20.6% | 21.5% | 21.4% | 15.8% | 19.4% | 20.9% | 22.5% |
| Net margin | 12.9% | 13.7% | 13.7% | 13.9% | 13.9% | 14.6% | 15.3% | 15.3% | 10.8% | 13.6% | 14.9% | 16.1% |
| YoY (%) | ||||||||||||
| Net revenue | 34% | 48% | 36% | 31% | 36% | 36% | 40% | 54% | 32% | 37% | 42% | 49% |
| Gross profit | 56% | 48% | 42% | 37% | 33% | 39% | 41% | 54% | 39% | 45% | 43% | 50% |
| Operating profit | 102% | 64% | 53% | 50% | 44% | 62% | 58% | 71% | 76% | 63% | 60% | 62% |
| Pretax profit | 99% | 79% | 48% | 62% | 37% | 46% | 54% | 68% | 71% | 68% | 52% | 60% |
| Net profit | 101% | 80% | 51% | 70% | 46% | 45% | 57% | 69% | 71% | 72% | 55% | 61% |
| QoQ (%) | ||||||||||||
| Net revenue | -1% | 15% | 12% | 3% | 2% | 15% | 16% | 13% | ||||
| Gross profit | 5% | 11% | 14% | 2% | 3% | 16% | 16% | 11% | ||||
| Operating profit | 8% | 8% | 25% | 4% | 3% | 21% | 21% | 13% | ||||
| Pretax profit | 21% | 13% | 14% | 4% | 2% | 20% | 21% | 13% | ||||
| Net profit | 19% | 22% | 11% | 5% | 2% | 21% | 21% | 13% |
Source: Company, Daiwa forecast
Delta: 1-year forward PER band
Source: TEJ, Daiwa forecasts
Delta Electronics (2308 TT): 30 July 2026
Delta: operating margin by segment (quarterly)
Source: Company
Daiwa
Financial summary
Key assumptions
| Year to 31 Dec | 2021 | 2022 | 2023 | 2024 | 2025 | 2026E | 2027E | 2028E |
|---|---|---|---|---|---|---|---|---|
| Automation revenue growth (YoY) | 18 | 19 | (0) | (3) | 5 | 10 | 7 | 6 |
| Infrastructure revenue growth (YoY) | (8) | 26 | (4) | 2 | 82 | 45 | 74 | 61 |
| Power Electronics sales growth (YoY) | 21 | 21 | 9 | (10) | 25 | 43 | 30 | 46 |
Profit and loss (TWDm)
| Year to 31 Dec | 2021 | 2022 | 2023 | 2024 | 2025 | 2026E | 2027E | 2028E |
|---|---|---|---|---|---|---|---|---|
| Power Electronics | 187,316 | 227,311 | 248,257 | 223,992 | 280,032 | 400,303 | 518,398 | 754,808 |
| Automation | 45,881 | 54,519 | 54,296 | 52,403 | 54,943 | 60,345 | 64,800 | 68,944 |
| Other Revenue | 81,474 | 102,613 | 98,674 | 144,752 | 219,911 | 297,670 | 493,828 | 779,727 |
| Total Revenue | 314,671 | 384,443 | 401,227 | 421,148 | 554,885 | 758,318 | 1,077,026 | 1,603,479 |
| Other income | 0 | 0 | 0 | 0 | 0 | 0 | 0 | 0 |
| COGS | (224,461) | (273,671) | (284,013) | (284,567) | (364,729) | (483,144) | (684,653) | (1,013,402) |
| SG&A | (31,642) | (37,564) | (40,215) | (47,354) | (57,482) | (74,497) | (88,366) | (117,431) |
| Other op.expenses | (27,202) | (31,770) | (36,048) | (41,575) | (48,743) | (63,937) | (85,547) | (118,390) |
| Operating profit | 31,365 | 41,439 | 40,950 | 47,652 | 83,932 | 136,739 | 218,460 | 354,257 |
| Net-interest inc./(exp.) | 134 | 38 | 899 | 1,859 | 1,501 | 1,600 | 1,576 | 1,572 |
| Assoc/forex/extraord./others | 4,128 | 4,588 | 6,793 | 1,804 | 2,433 | 9,113 | 4,780 | 4,180 |
| Pre-tax profit | 35,628 | 46,065 | 48,642 | 51,316 | 87,866 | 147,452 | 224,816 | 360,009 |
| Tax | (7,128) | (9,075) | (9,762) | (10,925) | (19,930) | (32,988) | (48,335) | (77,402) |
| Min. int./pref. div./others | (1,703) | (4,325) | (5,488) | (5,163) | (7,828) | (11,331) | (16,155) | (24,052) |
| Net profit (reported) | 26,796 | 32,666 | 33,393 | 35,229 | 60,108 | 103,133 | 160,325 | 258,555 |
| Net profit (adjusted) | 26,796 | 32,666 | 33,393 | 35,229 | 60,108 | 103,133 | 160,325 | 258,555 |
| EPS (reported)(TWD) | 10.316 | 12.576 | 12.855 | 13.562 | 23.140 | 39.704 | 61.722 | 99.538 |
| EPS (adjusted)(TWD) | 10.316 | 12.576 | 12.855 | 13.562 | 23.140 | 39.704 | 61.722 | 99.538 |
| EPS (adjusted fully-diluted)(TWD) | 10.316 | 12.576 | 12.855 | 13.562 | 23.140 | 39.704 | 61.722 | 99.538 |
| DPS (TWD) | 5.500 | 5.500 | 9.840 | 6.430 | 7.000 | 11.600 | 20.000 | 30.000 |
| EBIT | 31,365 | 41,439 | 40,950 | 47,652 | 83,932 | 136,739 | 218,460 | 354,257 |
| EBITDA | 48,516 | 60,375 | 62,540 | 72,668 | 111,771 | 165,904 | 255,452 | 398,422 |
Cash flow (TWDm)
| Year to 31 Dec | 2021 | 2022 | 2023 | 2024 | 2025 | 2026E | 2027E | 2028E |
|---|---|---|---|---|---|---|---|---|
| Profit before tax | 35,628 | 46,065 | 48,642 | 51,316 | 87,866 | 147,452 | 224,816 | 360,009 |
| Depreciation and amortisation | 17,151 | 18,936 | 21,590 | 25,016 | 27,839 | 29,164 | 36,993 | 44,166 |
| Tax paid | (7,128) | (9,075) | (9,762) | (10,925) | (19,930) | (32,988) | (48,335) | (77,402) |
| Change in working capital | (20,506) | (20,062) | 2,466 | (2,538) | (24,348) | (75,550) | (99,259) | (103,852) |
| Other operational CF items | 3,175 | 10,665 | 8,151 | 10,025 | 27,047 | (97) | (80) | (80) |
| Cash flow from operations | 28,319 | 46,529 | 71,086 | 72,895 | 98,474 | 67,981 | 114,134 | 222,841 |
| Capex | (23,027) | (21,824) | (27,830) | (33,485) | (46,091) | (70,524) | (64,622) | (76,967) |
| Net (acquisitions)/disposals | (1,953) | (2,489) | (5,421) | (304) | (2,702) | 0 | 0 | 0 |
| Other investing CF items | (1,501) | (406) | (251) | (6,571) | (4,420) | 0 | 0 | 0 |
| Cash flow from investing | (26,481) | (24,719) | (33,502) | (40,360) | (53,214) | (70,524) | (64,622) | (76,967) |
| Change in debt | 6,993 | (1,900) | 10,327 | 7,135 | 11,729 | 0 | 0 | 0 |
| Net share issues/(repurchases) | 0 | 0 | 0 | 0 | 0 | 0 | 0 | 0 |
| Dividends paid | (15,751) | (15,026) | (27,455) | (18,696) | (20,313) | (30,132) | (51,951) | (77,926) |
| Other financing CF items | 421 | (2,814) | 6,651 | 444 | (817) | 0 | 0 | 0 |
| Cash flow from financing | (8,337) | (19,739) | (10,478) | (11,118) | (9,401) | (30,132) | (51,951) | (77,926) |
| Forex effect/others | (2,358) | 9,621 | (1,198) | 8,586 | (2,146) | 0 | 0 | 0 |
| Change in cash | (8,857) | 11,692 | 25,909 | 30,003 | 33,713 | (32,674) | (2,438) | 67,948 |
| Free cash flow | 5,292 | 24,705 | 43,257 | 39,410 | 52,383 | (2,542) | 49,513 | 145,874 |
Source: FactSet, Daiwa forecasts
Delta Electronics (2308 TT): 30 July 2026
Daiwa
Financial summary continued …
Balance sheet (TWDm)
| Year to 31 Dec | 2021 | 2022 | 2023 | 2024 | 2025 | 2026E | 2027E | 2028E |
|---|---|---|---|---|---|---|---|---|
| Cash & short-term investment | 51,268 | 63,572 | 92,620 | 121,793 | 155,113 | 122,439 | 120,001 | 187,949 |
| Inventory | 69,697 | 83,980 | 81,756 | 89,706 | 108,208 | 145,537 | 212,165 | 293,033 |
| Accounts receivable | 72,700 | 89,676 | 81,706 | 92,180 | 125,020 | 169,016 | 237,169 | 321,732 |
| Other current assets | 3,213 | 3,222 | 3,877 | 7,246 | 7,440 | 7,440 | 7,440 | 7,440 |
| Total current assets | 196,878 | 240,450 | 259,958 | 310,925 | 395,781 | 444,432 | 576,776 | 810,153 |
| Fixed assets | 76,607 | 86,267 | 98,002 | 115,710 | 142,040 | 183,399 | 211,028 | 243,829 |
| Goodwill & intangibles | 73,610 | 77,170 | 78,544 | 78,783 | 75,326 | 75,326 | 75,326 | 75,326 |
| Other non-current assets | 18,017 | 21,987 | 21,242 | 26,480 | 26,472 | 26,568 | 26,648 | 26,728 |
| Total assets | 365,112 | 425,874 | 457,747 | 531,898 | 639,619 | 729,726 | 889,778 | 1,156,037 |
| Short-term debt | 4,442 | 2,119 | 5,875 | 8,121 | 17,325 | 2,364 | 2,364 | 2,364 |
| Accounts payable | 54,570 | 62,716 | 53,539 | 69,223 | 94,452 | 100,226 | 135,749 | 197,327 |
| Other current liabilities | 49,157 | 60,179 | 66,671 | 74,939 | 97,888 | 97,888 | 97,888 | 97,888 |
| Total current liabilities | 108,169 | 125,013 | 126,085 | 152,283 | 209,665 | 200,479 | 236,001 | 297,579 |
| Long-term debt | 43,914 | 44,337 | 51,420 | 56,309 | 56,703 | 56,703 | 56,703 | 56,703 |
| Other non-current liabilities | 26,904 | 31,156 | 37,506 | 43,740 | 47,861 | 47,861 | 47,861 | 47,861 |
| Total liabilities | 178,988 | 200,507 | 215,011 | 252,332 | 314,230 | 305,043 | 340,566 | 402,144 |
| Share capital | 25,975 | 25,975 | 25,975 | 25,975 | 25,975 | 25,975 | 25,975 | 25,975 |
| Reserves/R.E./others | 128,811 | 160,813 | 173,188 | 204,112 | 242,083 | 341,376 | 465,906 | 670,587 |
| Shareholders' equity | 154,787 | 186,789 | 199,164 | 230,087 | 268,058 | 367,351 | 491,881 | 696,562 |
| Minority interests | 31,338 | 38,578 | 43,572 | 49,478 | 57,331 | 57,331 | 57,331 | 57,331 |
| Total equity & liabilities | 365,112 | 425,874 | 457,747 | 531,898 | 639,619 | 729,726 | 889,778 | 1,156,037 |
| EV | 4,002,668 | 3,995,704 | 3,982,488 | 3,966,357 | 3,950,488 | 3,968,200 | 3,970,638 | 3,902,691 |
| Net debt/(cash) | (2,912) | (17,115) | (35,325) | (57,363) | (81,085) | (63,372) | (60,934) | (128,881) |
| BVPS (TWD) | 59.590 | 71.910 | 76.674 | 88.579 | 103.197 | 141.423 | 189.364 | 268.162 |
Key ratios (%)
| Year to 31 Dec | 2021 | 2022 | 2023 | 2024 | 2025 | 2026E | 2027E | 2028E |
|---|---|---|---|---|---|---|---|---|
| Sales (YoY) | 11.3 | 22.2 | 4.4 | 5.0 | 31.8 | 36.7 | 42.0 | 48.9 |
| EBITDA (YoY) | 2.6 | 24.4 | 3.6 | 16.2 | 53.8 | 48.4 | 54.0 | 56.0 |
| Operating profit (YoY) | (0.2) | 32.1 | (1.2) | 16.4 | 76.1 | 62.9 | 59.8 | 62.2 |
| Net profit (YoY) | 5.1 | 21.9 | 2.2 | 5.5 | 70.6 | 71.6 | 55.5 | 61.3 |
| Core EPS (fully-diluted) (YoY) | 5.1 | 21.9 | 2.2 | 5.5 | 70.6 | 71.6 | 55.5 | 61.3 |
| Gross-profit margin | 28.7 | 28.8 | 29.2 | 32.4 | 34.3 | 36.3 | 36.4 | 36.8 |
| EBITDA margin | 15.4 | 15.7 | 15.6 | 17.3 | 20.1 | 21.9 | 23.7 | 24.8 |
| Operating-profit margin | 10.0 | 10.8 | 10.2 | 11.3 | 15.1 | 18.0 | 20.3 | 22.1 |
| Net profit margin | 8.5 | 8.5 | 8.3 | 8.4 | 10.8 | 13.6 | 14.9 | 16.1 |
| ROAE | 17.8 | 19.1 | 17.3 | 16.4 | 24.1 | 32.5 | 37.3 | 43.5 |
| ROAA | 7.6 | 8.3 | 7.6 | 7.1 | 10.3 | 15.1 | 19.8 | 25.3 |
| ROCE | 13.8 | 16.4 | 14.3 | 14.8 | 22.6 | 31.0 | 40.0 | 49.9 |
| ROIC | 14.6 | 17.0 | 15.7 | 17.5 | 27.8 | 35.1 | 40.4 | 50.0 |
| Net debt to equity | net cash | net cash | net cash | net cash | net cash | net cash | net cash | net cash |
| Effective tax rate | 20.0 | 19.7 | 20.1 | 21.3 | 22.7 | 22.4 | 21.5 | 21.5 |
| Accounts receivable (days) | 79.7 | 77.1 | 78.0 | 75.4 | 71.4 | 70.8 | 68.8 | 63.6 |
| Current ratio (x) | 1.8 | 1.9 | 2.1 | 2.0 | 1.9 | 2.2 | 2.4 | 2.7 |
| Net interest cover (x) | n.a. | n.a. | n.a. | n.a. | n.a. | n.a. | n.a. | n.a. |
| Net dividend payout | 56.1 | 53.3 | 78.2 | 50.0 | 51.6 | 50.1 | 50.4 | 48.6 |
| Free cash flow yield | 0.1 | 0.6 | 1.1 | 1.0 | 1.3 | n.a. | 1.2 | 3.7 |
Source: FactSet, Daiwa forecasts
Company profile
Founded in 1971, Delta Electronics has been the global leader in switching power supply solutions since 2002 and DC brushless fans since 2006. Its business covers 3 key areas: power electronics (eg, power supplies, thermal management products and passive components), automation (eg, controllers, robot arms and building management systems), and infrastructure (eg, datacentre infrastructure, networking and EV charging).
Delta Electronics (2308 TT): 30 July 2026
Daiwa
ESG analysis
ESG risks
| Risks | Management | Analyst comments | |
|---|---|---|---|
| Executive/board quality | 1 | Delta's board has 7 non-independent and 5 independent directors with a term of three years. The total number of directors and ratio of independent directors appear higher than most other listed companies. Besides, according to Delta's CSR report, enhancing the board's functions is one of the key goals for the company to achieve better corporate governance; also, the board members' diversity and professionalism will be taken into consideration to ensure a good board quality. Moreover, the company evaluates all the directors in the board using internal regulations and an external independent institution each year and at least once every three years, respectively. We believe Delta has implemented relatively more enhanced measure than most listed firms to improve its board quality. | |
| G | Capital management | 2 | During 2016-19, Delta's payout ratio was stable in the range of c.70%, but fell to 56% in 2020 and 53% in 2021. For 2020, it was mainly due to a sizeable non-cash re-valuation gain after the acquisition of Delta Thailand (DET), while the company maintained more cash on hand to deal with the uncertainties caused by COVID-19. However, the DPS growth from 2016 to 2021 was limited, as Delta struggled with business diversification into new end-markets (eg, smartphone, NEV). We believe that Delta's effort started to bear fruit in recent years after its NEV business has gradually picked up. Overall, we see a stable dividend policy from Delta and expect its DPS to continue to grow YoY in the future given that they declared a TWD7.0 DPS for 2024 which |
| Related party & transaction | 1 | equals a 52% payout ratio. Revenue from related parties stood at 4% of total 2024 revenue and purchases from related parties were at 9%. We see limited risk from related party transactions. | |
| S | Supply chain management | 1 | Delta focuses on: 1) localised management, 2) supplier certification and risk management, and 3) supplier sustainability engagement as key initiatives under the scope of supply chain management. In 2019, 144 new suppliers joined Delta's supply chain system. All of them passed environmental and social evaluations, signed the declaration of "non-use of conflict materials", and complied with Responsible Business Alliance's (BRA) Code of Conduct. Also, these vendors had to implement and abide by Delta's supply chain CSR policy and code of conduct. To lower ESG risks, Delta carries out RBA audits and monitors high-risk critical suppliers each year. The suppliers that fail these audits have to provide detailed improvement plans in response to identified issues. Besides, Delta has surveyed a total of 263 suppliers with potential risk and 63 suppliers with high risk of the total 1,331 suppliers, based on its CSR policy and code of conduct. If these suppliers are flagged as high-risk and no concrete improvements are made, Delta may consider terminating cooperation and transactions with them to improve the company's engagement on supplier sustainability. Overall, we think Delta has a solid plan to improve its supply chain management with specific KPIs, including: 1) achieving supplier improvement rate of 80% in 2025, 2) reducing GHG emissions rate of critical suppliers by 10% in 2025, and 3) improving water saving rate of critical suppliers by 12% in 2025. |
| S | Data security | 2 | Delta's Information Security team created Delta's Information Security Policy in November 2013 and started providing educational training to global employees in 2014. Delta gradually introduced the Information Security Management System (ISMS) in 2016 and obtained the ISO 27001 international certification in 2018. According to ISO27001, Delta has to conduct at least one internal audit on information security and appoint an independent institution to conduct audit externally. According to Delta, no major deficiencies have been found in recent years. |
Note: Management score represents a company's ability to manage/benefit from certain ESG topics. The scores range from 1 to 3, with 1 being the strongest.
Update Date: 30 Jul 2026
Source: Daiwa, Company
Delta Electronics (2308 TT): 30 July 2026
Daiwa