PDF 原檔:報告_Daiwa_台積電2330_20260716_original.pdf
圖片清單(已驗證 2026-07-17)
| 檔名 | size | 分類 | 親眼所見內容 |
|---|---|---|---|
報告_Daiwa_台積電2330_20260716_002.png |
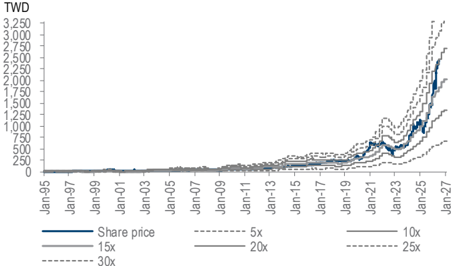
46KB | 真資料圖 | 4-quarter forward PER bands:TWD 股價走勢+5x-30x 本益比帶,1995-2027 |
報告_Daiwa_台積電2330_20260716_003.png |
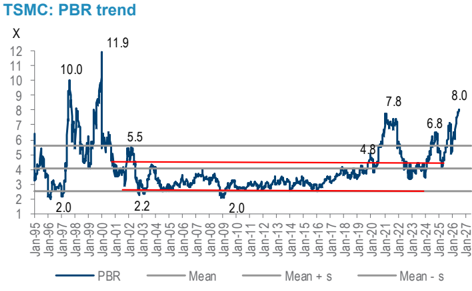
60KB | 真資料圖 | TSMC PBR trend:股價淨值比走勢+Mean/Mean±s 區間,1995-2026(近期 8.0x) |
報告_Daiwa_台積電2330_20260716_001.png(27KB)未達 40KB 門檻,預設 logo/裝飾未逐張 Read。
原始內容
Taiwan
16 July 2026
Taiwan Semiconductor Manufacturing (2330 TT)
5
Daiwa
N
1
Buy
Rick Hsu
Rick Hsu
(886) 2 8758 6261 rick.hsu@daiwacm-cathay.com.tw
Sharon Kao (886) 2 8758 6255 sharon.kao@daiwacm-cathay.com.tw
Forecast revisions (%)
| Year to 31 Dec | 26E | 27E | 28E |
|---|---|---|---|
| Revenue change | 3.9 | 8.6 | 5.9 |
| Net profit change | 8.4 | 11.8 | 8.1 |
| Core EPS (FD) change | 8.4 | 11.8 | 8.1 |
Source: Daiwa forecasts
Share price performance
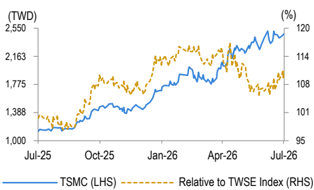
| 12-month range | 1,125.00-2,510.00 |
|---|---|
| Market cap (USDbn) | 1,989.97 |
| 3m avg daily turnover (USDm) | 2,716.56 |
| Shares outstanding (m) | 25,932 |
| Major shareholder | National Development Fund (6.4%) |
Financial summary (TWD)
| Year to 31 Dec | 26E | 27E | 28E |
|---|---|---|---|
| Revenue (m) | 5,482,671 | 6,896,580 | 7,707,441 |
| Operating profit (m) | 3,235,827 | 4,030,109 | 4,424,887 |
| Net profit (m) | 2,842,467 | 3,492,695 | 3,883,696 |
| Core EPS (fully-diluted) | 109.612 | 134.687 | 149.765 |
| EPS change (%) | 65.5 | 22.9 | 11.2 |
| Daiwa vs Cons. EPS (%) | 9.6 | 3.5 | (8.0) |
| PER (x) | 22.5 | 18.3 | 16.5 |
| Dividend yield (%) | 1.1 | 1.1 | 1.2 |
| DPS | 26.0 | 28.0 | 30.0 |
| PBR (x) | 8.1 | 6.0 | 4.6 |
| EV/EBITDA (x) | 15.1 | 11.6 | 9.8 |
| ROE (%) | 42.8 | 37.6 | 31.6 |
Source: FactSet, Daiwa forecasts
Target price:
TWD3,000.00 (from TWD2,330.00)
Share price (16 Jul):
TWD2,470.00
|
Up/downside:
+21.5%
Yes, it's good and it's true
- Another 'beat-n-raise' in 2Q26 results and 2026 guidance
- Raising our forecasts on AI demand scaling out to agentic
- Reaffirming Buy (1) with a higher 12M TP of TWD3,000
What's new: TSMC reported another 'beat-n-raise' in its quarterly results and guidance, and further lifted its 2026 top-line target as well as capex to accommodate such a strong growth. Though some investors may not be happy with its margin guidance, we merit TSMC's disciplined pricing strategy, which appears to be reflecting its structural value in the supply chain rather than anything opportunistic. We raise our forecasts and target price, and reaffirm our Buy (1) call on the counter.
What's the impact: Another beat-n-raise but … TSMC reported another beat-n-raise results and guidance ( Too good to be true (II)? ). 2Q26 EPS finished at TWD27.25, 13% above our/consensus estimates. We attribute the beat to higher non-operating gains since core operations were intact despite the margin beat on better opex control (table on p.2). TSMC further raised 2026 revenue growth in USD terms for the second time to above 40% YoY (previous: more than 30%). We attribute the delta to stronger demand for CPU (x86 and Arm) as AI architecture migrates to agentic from generative. To accommodate the stronger growth, TSMC raised its 2026 capex to USD60-64bn (previous: USD52-56bn), partially reflecting 'tool inflation' due to a ripple effect of cost hikes in the supply chain. Foreseeing strong AI demand with visibility into 2030, TSMC will add USD100bn in Arizona to bring up total investment to USD265bn, likely accommodating up to 9 front-end wafer fabs and 3 back-end facilities, in our view.
… margins may disappoint equity market. Though revenue guidance for 3Q26 looks intact (3% above the consensus), some equity investors may not be happy with the guided gross margin (GM) as they benchmark TSMC's profitability against that of memory makers, along with consideration of its margin-dilutive operations overseas and materials cost hikes. We, however, modelled 65-66% GM previously for TSMC in 2H26 and 2027 as we merit TSMC's disciplined pricing strategy of treating customers as long-term partners for a harmony of value proposition across the supply chain, rather than anything opportunistic by taking advantage of any seasonal volatility. In all, we raise our 2026-28E EPS by 8-12%.
What we recommend: Given our forecast revisions, we lift our 12M TP for TSMC to TWD3,000 (previous: TWD2,330), based on our higher ROEadjusted PBR of 7.7x (previous: 6.7x). Our TP translates into 4-quarter forward PER of 23x, undemanding from the PEG point of view despite the high PBR target, considering our revised 2025-28E EPS CAGR of 31%. We reaffirm our Buy (1) rating with downside risks of 'silicon inflation' and geopolitical overhangs leading to global inflation and AI capex cuts.
How we differ: Our 2026-27E EPS are 4-10% above the consensus forecasts as we believe the street has underestimated the CPU upside.
→
TSMC: quarterly P&L forecasts
Daiwa
| TWDbn | 1Q26 | 2Q26 | 3Q26E | 4Q26E | 1Q27E | 2Q27E | 3Q27E | 4Q27E | 2025 | 2026E | 2027E | 2028E |
|---|---|---|---|---|---|---|---|---|---|---|---|---|
| Total revenue | 1,134 | 1,270 | 1,463 | 1,615 | 1,553 | 1,682 | 1,828 | 1,833 | 3,809 | 5,483 | 6,897 | 7,707 |
| Total revenue (USDbn) | 35.9 | 40.2 | 45.7 | 50.5 | 48.5 | 52.6 | 57.1 | 57.3 | 122.5 | 172.3 | 215.5 | 240.9 |
| COGS | -383 | -410 | -477 | -529 | -528 | -553 | -605 | -612 | -1,528 | -1,800 | -2,298 | -2,651 |
| Gross profit | 751 | 860 | 985 | 1,086 | 1,025 | 1,129 | 1,223 | 1,221 | 2,281 | 3,683 | 4,599 | 5,057 |
| Opex | -92 | -94 | -130 | -131 | -129 | -140 | -150 | -150 | -345 | -447 | -569 | -632 |
| Operating profit | 659 | 767 | 855 | 955 | 896 | 990 | 1,073 | 1,071 | 1,936 | 3,236 | 4,030 | 4,425 |
| EBITDA | 824 | 965 | 1,065 | 1,196 | 1,151 | 1,250 | 1,362 | 1,370 | 2,624 | 4,051 | 5,133 | 5,827 |
| Pretax profit | 688 | 862 | 888 | 993 | 936 | 1,032 | 1,117 | 1,117 | 2,042 | 3,432 | 4,203 | 4,674 |
| Income taxes | -115 | -156 | -151 | -169 | -159 | -175 | -190 | -190 | -326 | -590 | -715 | -794 |
| Net profit | 572 | 707 | 738 | 825 | 778 | 858 | 928 | 929 | 1,718 | 2,842 | 3,493 | 3,884 |
| FD O/S (bn) | 26 | 26 | 26 | 26 | 26 | 26 | 26 | 26 | 26 | 26 | 26 | 26 |
| FD EPS (TWD) | 22.08 | 27.25 | 28.47 | 31.82 | 30.01 | 33.08 | 35.79 | 35.81 | 66.24 | 109.61 | 134.69 | 149.76 |
| Margin | ||||||||||||
| Gross | 66% | 68% | 67% | 67% | 66% | 67% | 67% | 67% | 60% | 67% | 67% | 66% |
| Operating | 58% | 60% | 58% | 59% | 58% | 59% | 59% | 58% | 51% | 59% | 58% | 57% |
| EBITDA | 73% | 76% | 73% | 74% | 74% | 74% | 74% | 75% | 69% | 74% | 74% | 76% |
| Net | 50% | 56% | 50% | 51% | 50% | 51% | 51% | 51% | 45% | 52% | 51% | 50% |
| Growth (QoQ) | ||||||||||||
| Total revenue | 8% | 12% | 15% | 10% | -4% | 8% | 9% | 0% | ||||
| Gross profit | 15% | 15% | 15% | 10% | -6% | 10% | 8% | 0% | ||||
| Operating profit | 17% | 16% | 12% | 12% | -6% | 10% | 8% | 0% | ||||
| EBITDA | 13% | 17% | 10% | 12% | -4% | 9% | 9% | 1% | ||||
| Net profit | 13% | 23% | 4% | 12% | -6% | 10% | 8% | 0% | ||||
| FD EPS | 13% | 23% | 4% | 12% | -6% | 10% | 8% | 0% | ||||
| Growth (YoY) | ||||||||||||
| Total revenue | 35% | 36% | 48% | 54% | 37% | 32% | 25% | 14% | 32% | 44% | 26% | 12% |
| Gross profit | 52% | 57% | 67% | 67% | 36% | 31% | 24% | 12% | 40% | 61% | 25% | 10% |
| Operating profit | 62% | 65% | 71% | 69% | 36% | 29% | 25% | 12% | 46% | 67% | 25% | 10% |
| EBITDA | 42% | 48% | 61% | 64% | 40% | 29% | 28% | 15% | 32% | 54% | 27% | 14% |
| Net profit | 58% | 77% | 63% | 63% | 36% | 21% | 26% | 13% | 46% | 65% | 23% | 11% |
| FD EPS | 58% | 77% | 63% | 63% | 36% | 21% | 26% | 13% | 46% | 65% | 23% | 11% |
Source: Company, Daiwa estimates and forecasts
TSMC: 2Q26 results review and 3Q26 guidance check
| 2Q26 | 2Q26 | 2Q26 | Growth | Growth | |||
|---|---|---|---|---|---|---|---|
| TWDm | Actual | Daiwa | Variance | QoQ | YoY | Guidance | Daiwa (previous) |
| Revenue | 1,270,381 | 1,265,654 | 0% | 12% | 36% | USD44.6-45.8bn (TWD1427-1466bn) | USD45bn (+12% QoQ) |
| Gross profit | 860,311 | 850,754 | 1% | 15% | 57% | 65-67% | 66.2% |
| Operating profit | 766,603 | 746,970 | 3% | 16% | 65% | 56-58% | 58.1% |
| EBITDA | 965,141 | 926,970 | 4% | 17% | 48% | ||
| Pretax profit | 862,430 | 778,885 | 11% | 25% | 75% | Capex raised to USD60-64bn | USD56bn |
| Net profit | 706,562 | 623,887 | 13% | 23% | 77% | ||
| Adjusted EPS (TWD) | 27.25 | 24.06 | 13% | 23% | 77% | ||
| Margin | |||||||
| Gross | 67.7% | 67.2% | 0.5% | ||||
| Operating | 60.3% | 59.0% | 1.3% | ||||
| EBITDA | 76.0% | 73.2% | 2.7% | ||||
| Net | 55.6% | 49.3% | 6.3% | ||||
| Operation | |||||||
| Shipment ('000, 12" equ.wafers) | 4,336 | 4,472 | -3% | ||||
| Utilization* | 86% | 89% | -3% | ||||
| <=3nm sales contribution | 33% | 30% | 3% |
Source: Company, Daiwa estimates and forecasts
Note: * Calculated as wafer shipment divided by capacity estimated by Daiwa
TSMC: 4-quarter forward PER bands
30x
Source: Company, TEJ, Daiwa forecasts
Taiwan Semiconductor Manufacturing (2330 TT): 16 July 2026
Source: Company, TEJ, Daiwa forecasts
Financial summary
Key assumptions
| Year to 31 Dec | 2021 | 2022 | 2023 | 2024 | 2025 | 2026E | 2027E | 2028E |
|---|---|---|---|---|---|---|---|---|
| Capacity utilization (%) | 102 | 98 | 73 | 76 | 80 | 90 | 99 | 100 |
| Blended ASP (USD) | 1,642 | 1,933 | 2,101 | 2,546 | 2,930 | 3,440 | 3,734 | 3,866 |
| Wafer shipment (8" equ., '000) | 31,902 | 34,320 | 27,005 | 29,051 | 33,802 | 40,889 | 47,454 | 51,233 |
Profit and loss (TWDm)
| Year to 31 Dec | 2021 | 2022 | 2023 | 2024 | 2025 | 2026E | 2027E | 2028E |
|---|---|---|---|---|---|---|---|---|
| Wafer Foundry Revenue | 1,463,158 | 1,979,215 | 1,770,430 | 2,377,502 | 3,079,347 | 4,476,254 | 5,670,879 | 6,337,629 |
| Sub & Other Revenue | 124,258 | 284,677 | 391,305 | 516,806 | 729,707 | 1,006,417 | 1,225,701 | 1,369,812 |
| Other Revenue | 0 | 0 | 0 | 0 | 0 | 0 | 0 | 0 |
| Total Revenue | 1,587,415 | 2,263,891 | 2,161,736 | 2,894,308 | 3,809,054 | 5,482,671 | 6,896,580 | 7,707,441 |
| Other income | 0 | 0 | 0 | 0 | 0 | 0 | 0 | 0 |
| COGS | (767,878) | (915,536) | (986,625) | (1,269,954) | (1,527,760) | (1,799,771) | (2,297,717) | (2,650,544) |
| SG&A | (44,822) | (63,813) | (71,275) | (98,119) | (98,775) | (117,396) | (154,960) | (169,564) |
| Other op.expenses | (124,735) | (163,262) | (182,370) | (204,182) | (246,427) | (329,678) | (413,795) | (462,446) |
| Operating profit | 649,981 | 1,121,279 | 921,466 | 1,322,053 | 1,936,092 | 3,235,827 | 4,030,109 | 4,424,887 |
| Net-interest inc./(exp.) | 488 | 10,672 | 48,295 | 76,718 | 93,369 | 121,900 | 162,500 | 237,920 |
| Assoc/forex/extraord./others | 12,657 | 12,239 | 9,411 | 7,068 | 12,202 | 73,881 | 10,394 | 10,714 |
| Pre-tax profit | 663,126 | 1,144,190 | 979,171 | 1,405,839 | 2,041,663 | 3,431,607 | 4,203,003 | 4,673,521 |
| Tax | (66,053) | (127,290) | (141,404) | (233,407) | (326,266) | (590,482) | (714,511) | (794,499) |
| Min. int./pref. div./others | (533) | (370) | 730 | 836 | 2,486 | 1,341 | 4,203 | 4,674 |
| Net profit (reported) | 596,540 | 1,016,530 | 838,498 | 1,173,268 | 1,717,883 | 2,842,467 | 3,492,695 | 3,883,696 |
| Net profit (adjusted) | 596,540 | 1,016,530 | 838,498 | 1,173,268 | 1,717,883 | 2,842,467 | 3,492,695 | 3,883,696 |
| EPS (reported)(TWD) | 23.005 | 39.204 | 32.334 | 45.252 | 66.255 | 109.612 | 134.687 | 149.765 |
| EPS (adjusted)(TWD) | 23.005 | 39.204 | 32.334 | 45.252 | 66.255 | 109.612 | 134.687 | 149.765 |
| EPS (adjusted fully-diluted)(TWD) | 23.006 | 39.203 | 32.334 | 45.242 | 66.243 | 109.612 | 134.687 | 149.765 |
| DPS (TWD) | 10.250 | 11.001 | 11.249 | 14.003 | 18.003 | 26.000 | 28.000 | 30.000 |
| EBIT | 649,981 | 1,121,279 | 921,466 | 1,322,053 | 1,936,092 | 3,235,827 | 4,030,109 | 4,424,887 |
| EBITDA | 1,072,375 | 1,558,533 | 1,453,657 | 1,984,848 | 2,624,188 | 4,050,666 | 5,133,229 | 5,827,072 |
Cash flow (TWDm)
| Year to 31 Dec | 2021 | 2022 | 2023 | 2024 | 2025 | 2026E | 2027E | 2028E |
|---|---|---|---|---|---|---|---|---|
| Profit before tax | 663,126 | 1,144,190 | 979,171 | 1,405,839 | 2,041,663 | 3,431,607 | 4,203,003 | 4,673,521 |
| Depreciation and amortisation | 422,395 | 437,254 | 532,191 | 662,795 | 688,096 | 814,839 | 1,103,120 | 1,402,185 |
| Tax paid | (66,053) | (127,290) | (141,404) | (233,407) | (326,266) | (590,482) | (714,511) | (794,499) |
| Change in working capital | (100,384) | (53,286) | 324 | (90,088) | 160 | (270,000) | (35,000) | (175,000) |
| Other operational CF items | 193,077 | 209,731 | (128,316) | 81,038 | (128,677) | (3,836) | (1,232) | (1,033) |
| Cash flow from operations | 1,112,161 | 1,610,599 | 1,241,967 | 1,826,177 | 2,274,976 | 3,382,130 | 4,555,381 | 5,105,174 |
| Capex | (839,196) | (1,082,672) | (949,817) | (956,007) | (1,272,411) | (1,963,599) | (1,960,000) | (2,161,600) |
| Net (acquisitions)/disposals | 4,676 | (128,712) | (55,781) | (57,882) | (37,079) | 738 | 0 | 0 |
| Other investing CF items | (1,847) | 20,456 | 99,477 | 149,046 | 165,097 | 0 | 0 | 0 |
| Cash flow from investing | (836,366) | (1,190,928) | (906,121) | (864,843) | (1,144,393) | (1,962,861) | (1,960,000) | (2,161,600) |
| Change in debt | (1,090) | (1,730) | (17,407) | 21,601 | (46,362) | (136,926) | (128,434) | (109,169) |
| Net share issues/(repurchases) | 0 | 0 | 0 | 0 | 0 | 0 | 0 | 0 |
| Dividends paid | (265,786) | (285,234) | (291,722) | (363,055) | (466,779) | (674,232) | (726,096) | (777,960) |
| Other financing CF items | (3,622) | 59,198 | 10,284 | 8,054 | (64,022) | 0 | 0 | 0 |
| Cash flow from financing | (270,499) | (227,766) | (298,844) | (333,399) | (577,163) | (811,158) | (854,530) | (887,129) |
| Forex effect/others | 0 | 0 | 0 | 0 | 0 | 0 | 0 | 0 |
| Change in cash | 5,296 | 191,905 | 37,002 | 627,935 | 553,420 | 608,111 | 1,740,851 | 2,056,445 |
| Free cash flow | 272,965 | 527,927 | 292,151 | 870,170 | 1,002,565 | 1,418,531 | 2,595,381 | 2,943,574 |
Source: FactSet, Daiwa forecasts
Taiwan Semiconductor Manufacturing (2330 TT): 16 July 2026
Daiwa
Financial summary continued …
Balance sheet (TWDm)
| Year to 31 Dec | 2021 | 2022 | 2023 | 2024 | 2025 | 2026E | 2027E | 2028E |
|---|---|---|---|---|---|---|---|---|
| Cash & short-term investment | 1,188,442 | 1,561,483 | 1,687,644 | 2,422,009 | 3,068,595 | 3,675,968 | 5,416,818 | 7,473,263 |
| Inventory | 193,102 | 221,149 | 250,997 | 287,869 | 288,109 | 398,109 | 458,109 | 508,109 |
| Accounts receivable | 207,637 | 231,409 | 201,938 | 272,088 | 281,791 | 461,791 | 466,791 | 596,791 |
| Other current assets | 17,892 | 38,856 | 53,453 | 106,387 | 178,635 | 180,000 | 30,000 | 30,000 |
| Total current assets | 1,607,073 | 2,052,897 | 2,194,033 | 3,088,352 | 3,817,131 | 4,715,868 | 6,371,719 | 8,608,164 |
| Fixed assets | 1,975,119 | 2,693,837 | 3,064,475 | 3,234,980 | 3,691,841 | 5,186,798 | 6,399,770 | 7,379,841 |
| Goodwill & intangibles | 113,927 | 149,117 | 144,421 | 219,565 | 251,682 | 179,500 | 189,200 | 194,000 |
| Other non-current assets | 29,385 | 68,928 | 129,442 | 149,040 | 172,370 | 172,370 | 172,370 | 172,370 |
| Total assets | 3,725,503 | 4,964,779 | 5,532,371 | 6,691,938 | 7,933,024 | 10,254,537 | 13,133,059 | 16,354,375 |
| Short-term debt | 127,171 | 19,314 | 9,293 | 59,858 | 136,926 | 128,434 | 109,169 | 92,794 |
| Accounts payable | 48,911 | 56,522 | 57,293 | 74,227 | 84,330 | 104,330 | 134,330 | 139,330 |
| Other current liabilities | 563,421 | 868,391 | 846,997 | 1,130,441 | 1,236,763 | 1,220,434 | 1,363,336 | 1,522,236 |
| Total current liabilities | 739,503 | 944,227 | 913,583 | 1,264,525 | 1,458,019 | 1,453,199 | 1,606,836 | 1,754,360 |
| Long-term debt | 610,071 | 834,336 | 913,900 | 926,605 | 856,228 | 727,793 | 618,624 | 525,831 |
| Other non-current liabilities | 205,196 | 225,727 | 221,625 | 177,233 | 157,982 | 160,000 | 165,000 | 170,000 |
| Total liabilities | 1,554,770 | 2,004,290 | 2,049,108 | 2,368,362 | 2,472,229 | 2,340,992 | 2,390,460 | 2,450,191 |
| Share capital | 259,304 | 259,304 | 259,321 | 259,327 | 259,325 | 259,325 | 259,325 | 259,325 |
| Reserves/R.E./others | 1,908,983 | 2,686,349 | 3,199,593 | 4,029,218 | 5,160,271 | 7,611,680 | 10,436,531 | 13,593,442 |
| Shareholders' equity | 2,168,287 | 2,945,653 | 3,458,914 | 4,288,545 | 5,419,596 | 7,871,005 | 10,695,856 | 13,852,768 |
| Minority interests | 2,447 | 14,836 | 24,349 | 35,031 | 41,199 | 42,540 | 46,743 | 51,417 |
| Total equity & liabilities | 3,725,503 | 4,964,779 | 5,532,371 | 6,691,938 | 7,933,024 | 10,254,537 | 13,133,059 | 16,354,375 |
| EV | 63,603,286 | 63,359,043 | 63,311,938 | 62,651,524 | 62,017,798 | 61,274,840 | 59,409,758 | 57,248,818 |
| Net debt/(cash) | (451,200) | (707,833) | (764,451) | (1,435,546) | (2,075,442) | (2,819,740) | (4,689,025) | (6,854,639) |
| BVPS (TWD) | 83.621 | 113.600 | 133.384 | 165.370 | 208.985 | 303.525 | 412.458 | 534.196 |
Key ratios (%)
| Year to 31 Dec | 2021 | 2022 | 2023 | 2024 | 2025 | 2026E | 2027E | 2028E |
|---|---|---|---|---|---|---|---|---|
| Sales (YoY) | 18.5 | 42.6 | (4.5) | 33.9 | 31.6 | 43.9 | 25.8 | 11.8 |
| EBITDA (YoY) | 19.4 | 45.3 | (6.7) | 36.5 | 32.2 | 54.4 | 26.7 | 13.5 |
| Operating profit (YoY) | 14.7 | 72.5 | (17.8) | 43.5 | 46.4 | 67.1 | 24.5 | 9.8 |
| Net profit (YoY) | 15.2 | 70.4 | (17.5) | 39.9 | 46.4 | 65.5 | 22.9 | 11.2 |
| Core EPS (fully-diluted) (YoY) | 15.2 | 70.4 | (17.5) | 39.9 | 46.4 | 65.5 | 22.9 | 11.2 |
| Gross-profit margin | 51.6 | 59.6 | 54.4 | 56.1 | 59.9 | 67.2 | 66.7 | 65.6 |
| EBITDA margin | 67.6 | 68.8 | 67.2 | 68.6 | 68.9 | 73.9 | 74.4 | 75.6 |
| Operating-profit margin | 40.9 | 49.5 | 42.6 | 45.7 | 50.8 | 59.0 | 58.4 | 57.4 |
| Net profit margin | 37.6 | 44.9 | 38.8 | 40.5 | 45.1 | 51.8 | 50.6 | 50.4 |
| ROAE | 29.7 | 39.8 | 26.2 | 30.3 | 35.4 | 42.8 | 37.6 | 31.6 |
| ROAA | 18.4 | 23.4 | 16.0 | 19.2 | 23.5 | 31.3 | 29.9 | 26.3 |
| ROCE | 25.5 | 33.4 | 22.4 | 27.2 | 32.9 | 42.5 | 39.8 | 34.0 |
| ROIC | 37.5 | 50.2 | 31.7 | 39.3 | 51.9 | 63.2 | 60.0 | 56.1 |
| Net debt to equity | n.a. | n.a. | n.a. | n.a. | n.a. | n.a. | n.a. | n.a. |
| Effective tax rate | 10.0 | 11.1 | 14.4 | 16.6 | 16.0 | 17.2 | 17.0 | 17.0 |
| Accounts receivable (days) | 41.7 | 35.4 | 36.6 | 29.9 | 26.5 | 24.8 | 24.6 | 25.2 |
| Current ratio (x) | 2.2 | 2.2 | 2.4 | 2.4 | 2.6 | 3.2 | 4.0 | 4.9 |
| Net interest cover (x) | n.a. | n.a. | n.a. | n.a. | n.a. | n.a. | n.a. | n.a. |
| Net dividend payout | 55.1 | 47.8 | 34.8 | 30.9 | 27.2 | 23.7 | 20.8 | 20.0 |
| Free cash flow yield | 0.4 | 0.8 | 0.5 | 1.4 | 1.6 | 2.2 | 4.1 | 4.6 |
Source: FactSet, Daiwa forecasts
Company profile
Incorporated in Taiwan in 1987, Taiwan Semiconductor Manufacturing Co. (TSMC) is the world's largest complementary metal oxide semiconductor (CMOS) foundry in revenue terms. TSMC offers foundry services such as wafer masking, fabrication, probing, packaging and testing, to a high variety of customers including fabless chipmakers and IDMs. Its manufacturing fabs are located in Taiwan, China, the US and Singapore.
Taiwan Semiconductor Manufacturing (2330 TT): 16 July 2026
Daiwa
Taiwan Semiconductor Manufacturing (2330 TT): 16 July 2026
ESG analysis
ESG risks
| Management | Analyst comments | |
|---|---|---|
| Executive/board quality | 1 | TSMC's board of directors (BoD) has 10 members, including 6 independent directors representing 60% of total directors. The background of TSMC's BoD is diversified, with members from industries, academia, and law. Also, its board members include representatives from not only Taiwan but also Europe and the US, bringing their experience in operating international businesses to the board. We believe the high percentage of independent directors and a diverse mix of expertise from the board members strengthen the functionality of its BoD, as evidenced by TSMC's leading position in the foundry market. |
| Capital management | 1 | TSMC pays its dividend on a quarterly basis. In the past 5 years, it has managed its dividend payout well, as evidenced by its dividend in dollar terms, where it has never lowered its dividend. As the leader in advanced technology nodes, TSMC has kept expanding its capacity for advanced nodes; as such, we expect its capital intensity to increase to the level near or above 40% over 2022-23 (vs. its long-term target of mid-30%). However, we believe TSMC will at least sustain its cash dividend payout in dollar terms over 2022-23E. We see its balance between |
| Related party & transaction | 1 | TSMC's sales to related parties were 0.5-0.7% of its total revenue in 2021-22. Its purchase from related parties was 1.0% and 0.7% of its total cost of goods sold in 2021 and 2022, respectively. We see these percentages as insignificant and thus see limited risk for TSMC. |
| Supply chain management | 1 | As the leader in the global foundry industry, TSMC approaches supply chain management by focusing on 2 main strategies: sustainability risk management and local supply chain optimisation. It requires all its suppliers to comply with its "Code with Ethics and Business Conduct", and to follow regulations on human rights and conflict-free minerals. In 2019, 100% of its tier-1 suppliers signed the "Supplier Code of Conduct" and self-assessment questionnaire on sustainable management. Also, TSMC's raw materials purchased are 100% Democratic Republic of the Congo (DRC) conflict-free. It also requires its critical suppliers to report on the status of sustainability management in their critical upstream supply chains. Through these measures, we see TSMC reducing its supply chain risk. |
| Water & wastewater management | 2 | TSMC applies internal and external company resources to develop water reclaimation technology, implements water conservation measures and uses reeclaimed water in the manufacturing process. For example, on September 19, 2022, TSMC Tainan Science Park Reclaimed Water Plant started supplying reclaimed water. In 2023, TSMC aims to replace 5% of water resources with reclaimed water, and continue to cooperate with the government to complete the 2nd water reclamation plan in Anping, Tainan. In 2030, TSMC targets to replace > 60% of water resources with reclaimed water. |
| Waste & hazardous materials management | 1 | TSMC's waste recycling rate reached 96% in 2022 for 8 years in a row. Also, the percentage of waste sent to landfills was less than 1% for 13 years in a row in 2022. TSMC achieved reducing its outsourced unit waste disposal (kg/12" equivalent wafer mask layer) to 0.99 in 2022. Furthermore, TSMC has set a goal to reduce its outsourced unit waste disposal per wafer to no more than 0.5 in 2030. |
| GHG emissions | 1 | TSMC has continued its efforts to reduce greenhouse gas (GHG) emissions to drive low-carbon manufacturing. In 2022, TSMC achieved net zero emissions of direct and indirect (from purchased energy) GHG Emissions in overseas factories, and 100% use of carbon-neutral natural gas in Taiwan fabs. It has set a target to achieve Net Zero Emissions by 2050. |
Note: Management score represents a company's ability to manage/benefit from certain ESG topics. The scores range from 1 to 3, with 1 being the strongest.
Update Date: 16 Jan 2025
Source: Daiwa, Company
Daiwa