PDF 原檔:報告_Daiwa_台光電2383_20260729_original.pdf
圖片清單(已驗證 2026-07-31)
| 檔名 | size | 分類 | 親眼所見內容 |
|---|---|---|---|
Daiwa-2383 20260729_001.png |
26.2KB | 文字卡 | 「12-month range/Market cap/3m avg daily turnover/Shares outstanding/Major shareholder」統計數字卡 |
Daiwa-2383 20260729_002.png |
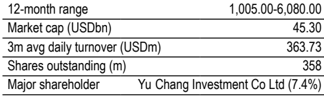
21.7KB | 真資料圖 | 台光電股價(藍實線)與相對台灣加權指數(橘虛線)雙軸走勢圖,橫軸 Jul-25 至 Jul-26 |
Daiwa-2383 20260729_003.png |
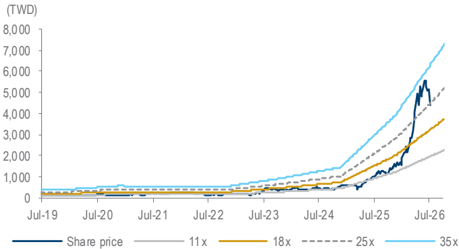
32.5KB | 真資料圖 | 台光電 1 年期遠期本益比區間圖,11x/18x/25x/35x 四條 PER 帶疊加股價,橫軸 Jul-19 至 Jul-26 |
Daiwa-2383 20260729_004.png |
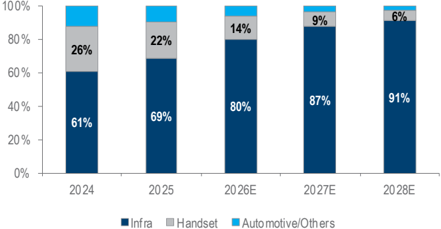
23.2KB | 真資料圖 | 台光電營收結構堆疊柱狀圖(Infra/Handset/Automotive-Others 占比),2024-2028E,Infra 占比自 61% 升至 2028E 91% |
原始內容
Taiwan
Elite Material (2383 TT)
Target price:
TWD7,200.00 (from TWD6,022.00)
Share price (29 Jul): TWD4,100.00 | Up/downside: +75.6%
2Q26 results review: beat on higher price hikes
- High-end CCL tightness continues with on-going spec upgrade trend
- New upsides likely due to substrate CCL opportunities
- Reaffirming our Buy (1) rating; lifting our 12M TP to TWD7,200
What's new: We provide our latest view on EMC after 2Q26 results.
What's the impact: 2Q26 results beat on higher-than-expected price hikes. EMC posted 2Q26 net profit at TWD9.8bn (EPS: TWD27.55), which was 18-27% higher than expectations. We attribute the strength mainly to ASP increases in 2Q26. EMC's 2Q26 revenue came in at TWD47.2bn (up 43% QoQ and 110% YoY), which was higher than management's original guidance of 15-20% QoQ, while we attribute the strength to c.30% ASP hikes in 2Q26 to factor in cost inflation from 3Q25 to 1Q26. Hence, gross margin improved 4.4pp QoQ to 33.9% (vs. our prior estimate of 31.6%), while operating margin increased 5.4pp QoQ to 26.9% (vs. our estimate of 23.8%) on gross margin expansion and better operating control. In general, we believe the 2Q26 results were without any particular surprise as EMC released its preliminary results in May due to regulatory requirements.
Business outlook. We expect the revenue to grow c.15% QoQ in 3Q26, which could be 3x from June sales given EMC's new capacity ramp up is behind them. However, gross margin could further lift to 35% in 3Q26 given the price hike impact has not been fully factored in 2Q26. Based on our understanding, EMC might have a chance to further pass through higher material costs in 2H26. As of now, EMC deems e-glass and high-end copper prices as the tightest components for CCL (similar comments from its key Taiwan competitors). When we compare EMC and TUC, we believe EMC's revenue from M7 and above should reach 60-65% in 2Q26 and will likely increase to c.70% in 2H26. The room for EMC to further optimise its product mix may be smaller than its peers. However, we believe new upsides for EMC will come from the substrate CCL that will likely provide multiple-time ASP increases when we compare EMC with M8 CCL for PCB. Also, gross margin for substrate CCL can easily reach c.50%, per our estimate. It is likely to be a key growth driver for EMC; but we have not factored it into our model yet. Per management, EMC hopes to pass the substrate CCL certification in 3Q26 and achieve c.80k substrate CCL shipment (c.10% capacity) target in 2027. For spec upgrades, the company indicates M9 (including M9 and M9Q) will have single-digit/teens % contribution in 2H26/2027. However, PTFE is not a choice from EMC while the company focuses on the M10 development as its tech roadmap.
What we recommend: We reaffirm our Buy (1) rating. We raise our 202628E EPS by 27-34% and our 12-month TP to TWD7,200, based on a lower PER multiple of 38x (vs. prior: 48x) on 1-year-forward EPS as its earnings growth rate starts to slow down from 4Q26E. Key downside risk: weakerthan-expected AI server demand.
How we differ: Our 2026-28E EPS are 14-15% above the Bloomberg consensus, likely due to our higher gross margin assumptions.
5
Daiwa
3
→
2
1
Buy
Sheng Cheng
(886) 2 8758 6253
sheng.cheng@daiwacm-cathay.com.tw
Allan Wang
(886) 2 8758 6249 allan.wang@daiwacm-cathay.com.tw
Forecast revisions (%)
| Year to 31 Dec | 26E | 27E | 28E |
|---|---|---|---|
| Revenue change | 15 | 22.3 | 22.8 |
| Net profit change | 26.5 | 34.1 | 33.5 |
| Core EPS (FD) change | 26.5 | 34.1 | 33.5 |
Source: Daiwa forecasts
Share price performance
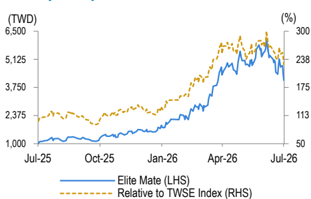
| 12-month range | 1,005.00-6,080.00 |
|---|---|
| Market cap (USDbn) | 45.30 |
| 3m avg daily turnover (USDm) | 363.73 |
| Shares outstanding (m) | 358 |
| Major shareholder | Yu Chang Investment Co Ltd (7.4%) |
Financial summary (TWD)
| Year to 31 Dec | 26E | 27E | 28E |
|---|---|---|---|
| Revenue (m) | 193,997 | 330,550 | 484,308 |
| Operating profit (m) | 51,970 | 101,298 | 156,513 |
| Net profit (m) | 40,324 | 79,072 | 122,177 |
| Core EPS (fully-diluted) | 112.462 | 220.531 | 340.748 |
| EPS change (%) | 169.9 | 96.1 | 54.5 |
| Daiwa vs Cons. EPS (%) | 14.9 | 14.4 | 15.1 |
| PER (x) | 36.5 | 18.6 | 12.0 |
| Dividend yield (%) | 1.6 | 3.2 | 5.0 |
| DPS | 67.5 | 132.4 | 204.6 |
| PBR (x) | 19.0 | 11.0 | 7.0 |
| EV/EBITDA (x) | 27.2 | 14.1 | 9.0 |
| ROE (%) | 63.1 | 75.2 | 71.6 |
Source: FactSet, Daiwa forecasts
EMC: Daiwa revenue and earnings forecasts revisions vs. the consensus
| 2026E | 2026E | 2026E | 2027E | 2027E | 2027E | 2028E | 2028E | 2028E | |
|---|---|---|---|---|---|---|---|---|---|
| (TWDm) | Previous | New | Consensus | Previous | New | Consensus | Previous | New | Consensus |
| Revenue | 168,675 | 193,997 | 177,555 | 270,192 | 330,550 | 296,214 | 394,466 | 484,308 | 427,819 |
| Diff (%) | 15.0% | 9.3% | 22.3% | 11.6% | 22.8% | 13.2% | |||
| Gross Margin (%) | 32.1% | 34.3% | 32.7% | 35.2% | 37.9% | 35.8% | 36.7% | 39.3% | 36.9% |
| Operating profit | 41,090 | 51,970 | 45,321 | 75,568 | 101,298 | 89,119 | 117,298 | 156,513 | 135,379 |
| Op Margin (%) | 24.4% | 26.8% | 25.5% | 28.0% | 30.6% | 30.1% | 29.7% | 32.3% | 31.6% |
| Net profit | 31,867 | 40,324 | 35,086 | 58,978 | 79,072 | 69,134 | 91,549 | 122,177 | 106,138 |
| EPS (TWD) | 88.93 | 112.46 | 97.85 | 164.60 | 220.53 | 192.81 | 255.50 | 340.75 | 296.02 |
| Diff (%) | 26.5% | 14.9% | 34.1% | 14.4% | 33.5% | 15.1% |
Source: Bloomberg, Daiwa forecasts
EMC: quarterly and annual P&L statement
| 2026E | 2026E | 2026E | 2026E | 2027E | 2027E | 2027E | 2027E | 2025 | 2026E | 2027E | 2028E | |
|---|---|---|---|---|---|---|---|---|---|---|---|---|
| (TWDm) | 1Q | 2Q | 3QE | 4QE | 1QE | 2QE | 3QE | 4QE | ||||
| Net revenue | 33,067 | 47,275 | 54,443 | 59,211 | 68,588 | 78,384 | 86,460 | 97,119 | 94,261 | 193,997 | 330,550 | 484,308 |
| COGS | (23,338) | (31,272) | (35,241) | (37,667) | (43,044) | (48,850) | (53,555) | (59,867) | (66,141) | (127,519) | (205,316) | (293,893) |
| Gross profit | 9,729 | 16,003 | 19,201 | 21,544 | 25,544 | 29,534 | 32,904 | 37,252 | 28,120 | 66,477 | 125,235 | 190,415 |
| Operating expenses | 2,601 | 3,269 | 4,138 | 4,500 | 5,075 | 5,644 | 6,225 | 6,993 | 9,012 | 14,508 | 23,937 | 33,902 |
| Operating profit | 7,128 | 12,734 | 15,064 | 17,044 | 20,469 | 23,890 | 26,679 | 30,260 | 19,108 | 51,970 | 101,298 | 156,513 |
| Non-operating profit | 66 | 52 | 39 | 42 | 44 | 45 | (8) | (11) | (232) | 199 | 70 | 116 |
| Pre-tax profit | 7,194 | 12,785 | 15,103 | 17,086 | 20,513 | 23,935 | 26,672 | 30,249 | 18,876 | 52,168 | 101,368 | 156,630 |
| Income taxes | (1,855) | (2,914) | (3,323) | (3,759) | (4,513) | (5,266) | (5,868) | (6,655) | (4,231) | (11,851) | (22,301) | (34,459) |
| Net profit | 5,340 | 9,873 | 11,782 | 13,328 | 16,001 | 18,671 | 20,805 | 23,595 | 14,649 | 40,324 | 79,072 | 122,177 |
| Net EPS (TWD) | 14.89 | 27.54 | 32.86 | 37.17 | 44.63 | 52.07 | 58.03 | 65.81 | 40.8 | 112.5 | 220.5 | 340.7 |
| Operating Ratios | ||||||||||||
| Gross margin | 29.4% | 33.9% | 35.3% | 36.4% | 37.2% | 37.7% | 38.1% | 38.4% | 29.8% | 34.3% | 37.9% | 39.3% |
| Operating margin | 21.6% | 26.9% | 27.7% | 28.8% | 29.8% | 30.5% | 30.9% | 31.2% | 20.3% | 26.8% | 30.6% | 32.3% |
| Pre-tax margin | 21.8% | 27.0% | 27.7% | 28.9% | 29.9% | 30.5% | 30.8% | 31.1% | 20.0% | 26.9% | 30.7% | 32.3% |
| Net margin | 16.1% | 20.9% | 21.6% | 22.5% | 23.3% | 23.8% | 24.1% | 24.3% | 15.5% | 20.8% | 23.9% | 25.2% |
| YoY (%) | ||||||||||||
| Net revenue | 53% | 110% | 117% | 138% | 107% | 66% | 59% | 64% | 46% | 106% | 70% | 47% |
| Gross profit | 48% | 134% | 153% | 202% | 163% | 85% | 71% | 73% | 56% | 136% | 88% | 52% |
| Operating profit | 57% | 174% | 202% | 245% | 187% | 88% | 77% | 78% | 57% | 172% | 95% | 55% |
| Pre-tax profit | 54% | 186% | 195% | 270% | 185% | 87% | 77% | 77% | 56% | 176% | 94% | 55% |
| Net profit | 54% | 184% | 197% | 257% | 200% | 89% | 77% | 77% | 53% | 175% | 96% | 55% |
| QoQ (%) | ||||||||||||
| Net revenue | 33% | 43% | 15% | 9% | 16% | 14% | 10% | 12% | ||||
| Gross profit | 37% | 64% | 20% | 12% | 19% | 16% | 11% | 13% | ||||
| Operating profit | 44% | 79% | 18% | 13% | 20% | 17% | 12% | 13% | ||||
| Pre-tax profit | 56% | 78% | 18% | 13% | 20% | 17% | 11% | 13% | ||||
| Net profit | 43% | 85% | 19% | 13% | 20% | 17% | 11% | 13% |
Source: Company, Daiwa forecasts
EMC: 2Q26 comparison table
| (TWDm) | Actual | QoQ% | YoY% | Daiwa | Diff% | Consensus | Diff% |
|---|---|---|---|---|---|---|---|
| Revenue | 47,275 | 43% | 110% | 42,246 | 12% | 43,045 | 10% |
| Gross profit | 16,003 | 64% | 134% | 13,334 | 20% | 13,983 | 14% |
| Gross margin (%) | 33.9% | 31.6% | 32.5% | ||||
| Operating profit | 12,734 | 79% | 174% | 10,038 | 27% | 12,571 | 1% |
| Operating margin (%) | 26.9% | 23.8% | 29.2% | ||||
| Pre-tax profit | 12,785 | 78% | 186% | 10,004 | 28% | 10,713 | 19% |
| Net profit | 9,873 | 85% | 184% | 7,805 | 27% | 8,398 | 18% |
| EPS (TWD) | 27.55 | 85% | 184% | 21.78 | 27% | 23.44 | 18% |
Source: Company data, Daiwa forecasts, Bloomberg
EMC: 1-year forward PER bands
Source: TEJ, Daiwa forecasts
Elite Material (2383 TT): 29 July 2026
EMC: revenue breakdown by product
Source: Company, Daiwa forecasts
Daiwa
Financial summary
Key assumptions
| Year to 31 Dec | 2021 | 2022 | 2023 | 2024 | 2025 | 2026E | 2027E | 2028E |
|---|---|---|---|---|---|---|---|---|
| Global PC shipment (m) | 361 | 301 | 260 | 263 | 287 | 244 | 244 | 244 |
| Regular server shipment (m) | 14 | 15 | 12 | 14 | 16 | 18 | 22 | 26 |
| Global smartphone shipment (m) | 1,655 | 1,437 | 1,381 | 1,439 | 1,429 | 1,249 | 1,255 | 1,300 |
Profit and loss (TWDm)
| Year to 31 Dec | 2021 | 2022 | 2023 | 2024 | 2025 | 2026E | 2027E | 2028E |
|---|---|---|---|---|---|---|---|---|
| Infra | 12,089 | 15,289 | 21,125 | 39,046 | 64,617 | 155,214 | 288,379 | 439,188 |
| Handset | 19,413 | 16,378 | 14,716 | 17,033 | 20,538 | 26,352 | 28,739 | 30,101 |
| Other Revenue | 6,998 | 7,005 | 5,455 | 8,297 | 9,106 | 12,431 | 13,432 | 15,019 |
| Total Revenue | 38,500 | 38,673 | 41,296 | 64,377 | 94,261 | 193,997 | 330,550 | 484,308 |
| Other income | 0 | 0 | 0 | 0 | 0 | 0 | 0 | 0 |
| COGS | (28,431) | (28,962) | (29,964) | (46,407) | (66,141) | (127,519) | (205,316) | (293,893) |
| SG&A | (2,379) | (2,532) | (2,717) | (4,048) | (6,320) | (10,052) | (16,676) | (23,628) |
| Other op.expenses | (767) | (953) | (1,269) | (1,770) | (2,692) | (4,455) | (7,261) | (10,274) |
| Operating profit | 6,923 | 6,225 | 7,346 | 12,152 | 19,108 | 51,970 | 101,298 | 156,513 |
| Net-interest inc./(exp.) | (76) | (184) | (319) | (459) | (476) | (499) | (496) | (494) |
| Assoc/forex/extraord./others | 66 | 255 | 392 | 440 | 244 | 698 | 566 | 610 |
| Pre-tax profit | 6,912 | 6,296 | 7,420 | 12,133 | 18,876 | 52,168 | 101,368 | 156,630 |
| Tax | (1,412) | (1,220) | (1,931) | (2,564) | (4,231) | (11,851) | (22,301) | (34,459) |
| Min. int./pref. div./others | (7) | (3) | 0 | 9 | 4 | 6 | 5 | 6 |
| Net profit (reported) | 5,493 | 5,073 | 5,488 | 9,578 | 14,649 | 40,324 | 79,072 | 122,177 |
| Net profit (adjusted) | 5,493 | 5,073 | 5,488 | 9,578 | 14,649 | 40,324 | 79,072 | 122,177 |
| EPS (reported)(TWD) | 16.500 | 15.238 | 16.349 | 27.807 | 41.667 | 112.535 | 220.674 | 340.970 |
| EPS (adjusted)(TWD) | 16.500 | 15.238 | 16.349 | 27.807 | 41.667 | 112.535 | 220.674 | 340.970 |
| EPS (adjusted fully-diluted)(TWD) | 16.472 | 14.798 | 15.797 | 27.552 | 41.667 | 112.462 | 220.531 | 340.748 |
| DPS (TWD) | 10.000 | 8.407 | 9.979 | 16.575 | 24.996 | 67.520 | 132.405 | 204.582 |
| EBIT | 6,923 | 6,225 | 7,346 | 12,152 | 19,108 | 51,970 | 101,298 | 156,513 |
| EBITDA | 7,642 | 7,000 | 8,648 | 13,921 | 20,958 | 54,684 | 105,012 | 161,228 |
Cash flow (TWDm)
| Year to 31 Dec | 2021 | 2022 | 2023 | 2024 | 2025 | 2026E | 2027E | 2028E |
|---|---|---|---|---|---|---|---|---|
| Profit before tax | 6,912 | 6,296 | 7,420 | 12,133 | 18,876 | 52,168 | 101,368 | 156,630 |
| Depreciation and amortisation | 719 | 774 | 1,302 | 1,769 | 1,849 | 2,714 | 3,714 | 4,714 |
| Tax paid | (1,412) | (1,220) | (1,931) | (2,564) | (4,231) | (11,851) | (22,301) | (34,459) |
| Change in working capital | 7,481 | (4,810) | 12,237 | 16,078 | 25,148 | 81,685 | 119,550 | 85,649 |
| Other operational CF items | (9,679) | 6,457 | (16,138) | (20,153) | (29,674) | (118,115) | (153,972) | (113,748) |
| Cash flow from operations | 4,022 | 7,498 | 2,890 | 7,263 | 11,968 | 6,602 | 48,359 | 98,786 |
| Capex | (2,470) | (6,493) | (3,281) | (5,867) | (9,490) | (18,664) | (21,463) | (24,683) |
| Net (acquisitions)/disposals | (26) | 0 | 6 | 13 | (18) | 1 | (9) | (4) |
| Other investing CF items | (122) | (103) | (782) | (47) | (380) | (8) | 0 | 0 |
| Cash flow from investing | (2,618) | (6,596) | (4,057) | (5,901) | (9,888) | (18,671) | (21,472) | (24,687) |
| Change in debt | 1,719 | 2,732 | 2,954 | 5,296 | 8,721 | 11,241 | 9,530 | 9,748 |
| Net share issues/(repurchases) | 0 | 0 | 0 | 0 | 0 | 0 | 0 | 0 |
| Dividends paid | (2,333) | (3,333) | (2,830) | (3,439) | (5,894) | (8,957) | (24,194) | (47,443) |
| Other financing CF items | 194 | 3,289 | (15) | 2,259 | (51) | 3,109 | 0 | 0 |
| Cash flow from financing | (420) | 2,687 | 109 | 4,116 | 2,776 | 5,394 | (14,664) | (37,695) |
| Forex effect/others | (73) | 211 | (126) | 251 | 163 | 800 | 786 | 700 |
| Change in cash | 910 | 3,802 | (1,185) | 5,729 | 5,020 | (5,875) | 13,009 | 37,104 |
| Free cash flow | 1,551 | 1,005 | (391) | 1,397 | 2,478 | (12,061) | 26,895 | 74,103 |
Source: FactSet, Daiwa forecasts
Elite Material (2383 TT): 29 July 2026
Daiwa
Financial summary continued …
Balance sheet (TWDm)
| Year to 31 Dec | 2021 | 2022 | 2023 | 2024 | 2025 | 2026E | 2027E | 2028E |
|---|---|---|---|---|---|---|---|---|
| Cash & short-term investment | 6,642 | 10,444 | 9,259 | 14,989 | 20,008 | 14,133 | 27,142 | 64,246 |
| Inventory | 5,465 | 4,236 | 6,135 | 9,437 | 16,752 | 31,105 | 52,885 | 66,066 |
| Accounts receivable | 13,274 | 11,683 | 17,327 | 25,897 | 36,115 | 84,197 | 139,404 | 183,097 |
| Other current assets | 463 | 217 | 955 | 1,171 | 1,106 | 1,110 | 1,110 | 1,110 |
| Total current assets | 25,844 | 26,580 | 33,675 | 51,494 | 73,980 | 130,545 | 220,540 | 314,518 |
| Fixed assets | 10,721 | 16,803 | 19,746 | 24,568 | 33,933 | 51,105 | 68,854 | 88,822 |
| Goodwill & intangibles | 0 | 0 | 0 | 0 | 0 | 0 | 0 | 0 |
| Other non-current assets | 0 | 0 | 6 | 18 | 0 | (1) | 8 | 12 |
| Total assets | 36,565 | 43,382 | 53,427 | 76,080 | 107,913 | 181,649 | 289,403 | 403,353 |
| Short-term debt | 2,717 | 5,299 | 7,866 | 7,781 | 11,264 | 15,405 | 19,226 | 22,909 |
| Accounts payable | 10,969 | 9,802 | 14,491 | 21,199 | 33,285 | 65,276 | 107,839 | 136,614 |
| Other current liabilities | 799 | 659 | 716 | 1,202 | 1,682 | 4,098 | 4,098 | 4,098 |
| Total current liabilities | 14,485 | 15,760 | 23,073 | 30,182 | 46,231 | 84,779 | 131,163 | 163,621 |
| Long-term debt | 721 | 4,218 | 2,109 | 8,772 | 8,219 | 15,799 | 21,508 | 27,573 |
| Other non-current liabilities | 1,585 | 1,330 | 1,435 | 2,032 | 3,027 | 3,726 | 3,726 | 3,726 |
| Total liabilities | 16,791 | 21,308 | 26,617 | 40,986 | 57,477 | 104,304 | 156,397 | 194,920 |
| Share capital | 3,329 | 3,329 | 3,432 | 3,466 | 3,583 | 3,583 | 3,583 | 3,583 |
| Reserves/R.E./others | 16,424 | 18,745 | 23,378 | 31,644 | 46,872 | 73,789 | 129,454 | 204,887 |
| Shareholders' equity | 19,753 | 22,075 | 26,809 | 35,111 | 50,456 | 77,372 | 133,037 | 208,470 |
| Minority interests | 21 | 0 | 0 | (17) | (20) | (27) | (32) | (37) |
| Total equity & liabilities | 36,565 | 43,382 | 53,427 | 76,080 | 107,913 | 181,649 | 289,403 | 403,353 |
| EV | 1,465,934 | 1,468,190 | 1,469,832 | 1,470,663 | 1,468,571 | 1,486,161 | 1,482,676 | 1,455,315 |
| Net debt/(cash) | (3,203) | (926) | 716 | 1,564 | (525) | 17,071 | 13,592 | (13,764) |
| BVPS (TWD) | 59.332 | 66.306 | 79.860 | 101.931 | 143.516 | 215.929 | 371.278 | 581.797 |
Key ratios (%)
| Year to 31 Dec | 2021 | 2022 | 2023 | 2024 | 2025 | 2026E | 2027E | 2028E |
|---|---|---|---|---|---|---|---|---|
| Sales (YoY) | 41.5 | 0.4 | 6.8 | 55.9 | 46.4 | 105.8 | 70.4 | 46.5 |
| EBITDA (YoY) | 44.4 | (8.4) | 23.6 | 61 | 50.5 | 160.9 | 92 | 53.5 |
| Operating profit (YoY) | 47.8 | (10.1) | 18.0 | 65.4 | 57.2 | 172.0 | 94.9 | 54.5 |
| Net profit (YoY) | 48.9 | (7.7) | 8.2 | 74.5 | 52.9 | 175.3 | 96.1 | 54.5 |
| Core EPS (fully-diluted) (YoY) | 48.9 | (10.2) | 6.7 | 74.4 | 51.2 | 169.9 | 96.1 | 54.5 |
| Gross-profit margin | 26.2 | 25.1 | 27.4 | 27.9 | 29.8 | 34.3 | 37.9 | 39.3 |
| EBITDA margin | 19.8 | 18.1 | 20.9 | 21.6 | 22.2 | 28.2 | 31.8 | 33.3 |
| Operating-profit margin | 18.0 | 16.1 | 17.8 | 18.9 | 20.3 | 26.8 | 30.6 | 32.3 |
| Net profit margin | 14.3 | 13.1 | 13.3 | 14.9 | 15.5 | 20.8 | 23.9 | 25.2 |
| ROAE | 30.1 | 24.3 | 22.5 | 30.9 | 34.2 | 63.1 | 75.2 | 71.6 |
| ROAA | 17.1 | 12.7 | 11.3 | 14.8 | 15.9 | 27.9 | 33.6 | 35.3 |
| ROCE | 33.2 | 22.7 | 21.5 | 27.5 | 31.4 | 58.2 | 71.8 | 72.4 |
| ROIC | 37.6 | 26.6 | 22.3 | 29.9 | 34.3 | 55.7 | 65.6 | 71.5 |
| Net debt to equity | net cash | net cash | 2.7 | 4.5 | net cash | 22.1 | 10.2 | net cash |
| Effective tax rate | 20.4 | 19.4 | 26.0 | 21.1 | 22.4 | 22.7 | 22 | 22.0 |
| Accounts receivable (days) | 110.0 | 117.8 | 128.2 | 122.5 | 120.1 | 113.2 | 123.5 | 121.5 |
| Current ratio (x) | 1.8 | 1.7 | 1.5 | 1.7 | 1.6 | 1.5 | 1.7 | 1.9 |
| Net interest cover (x) | 0.9 | 0.4 | 0.2 | 0.3 | 0.4 | 1.1 | 2.1 | 3.2 |
| Net dividend payout | 60.6 | 55.2 | 61.1 | 59.6 | 60.0 | 60.0 | 60 | 60.0 |
| Free cash flow yield | 0.1 | 0.1 | n.a. | 0.1 | 0.2 | n.a. | 1.8 | 5.0 |
Source: FactSet, Daiwa forecasts
Company profile
Established in 1992 and listed on the Taiwan Stock Exchange in 1996, Elite Material Co. (EMC) is a leading manufacturer of copper clad laminate (CCL) and prepreg (PP), and a mass lamination foundry for PCB players. The company is also the world's largest green (halogen-free) CCL supplier.
Elite Material (2383 TT): 29 July 2026
Daiwa
ESG analysis
ESG risks
| Risks | Risks | Management | Analyst comments |
|---|---|---|---|
| G | Executive/board quality | 2 | EMC has incorporated 3 independent members into its 7-people board of directors in pursuit of better governance. Besides, EMC's Chairman and CEO roles are held separately, which reduce the risk of conflict of interest and excessive concentration of power. In addition, the company has 2 committees: the Audit Committee and the Remuneration Committee to assist the Board of Directors in performing their supervisory duties |
| G | Capital management | 1 | EMC has declared a dividend payout ratio of over 50% in the past ten years, which we view as a shareholder-friendly dividend policy. |
| G | Related party & transaction | 2 | Revenue from related parties accounted for <1% of total revenue, and the purchases from related parties comprised <1% of cost of sales. We see limited risk from related-party transactions |
| S | Product design & lifecycle management | 2 | EMC strives to create a safe and healthy workplace for every employee. EMC has introduced the occupational safety and health management systems (ISO 45001) in its Headquarters and all production plants to reduce the workplace hazards and enhance its safety and health management level. |
| S GHG | emissions | 2 | To ensure data security, EMC has formulated its Directions for Information Security Management based on three principles for information security management, which are confidentiality, integrity, and availability. In 2023, there were no incidents involving the violation of information-security-related laws and regulations, and no information security incidents occurred. |
| Company specific | Company specific | Management | Analyst comments |
| E | GHG emissions | 2 | EMC follows ISO 14061-1 2018 standards to conduct GHG emissions inventory and propose feasible solutions for greenhouse gas reduction. Besides, a third-party inspection agency is appointed to perform external verification. |
Note: Management score represents a company's ability to manage/benefit from certain ESG topics. The scores range from 1 to 3, with 1 being the strongest.
Update Date: 30 Jul 2025
Source: Daiwa, Company
Elite Material (2383 TT): 29 July 2026
Daiwa