PDF 原檔:報告_Daiwa_亞德客1590_20260721_original.pdf
圖片清單(已驗證 2026-07-22)
| 檔名 | size | 分類 | 親眼所見內容 |
|---|---|---|---|
報告_Daiwa_亞德客1590_20260721_002.png |
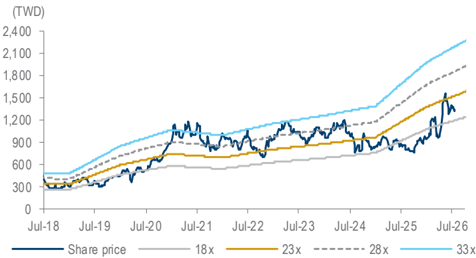
41KB | 真資料圖 | Airtac 1-year-forward PER bands 圖:股價(深藍線)與 18x/23x/28x/33x 本益比帶,2018/07-2026/07 |
報告_Daiwa_亞德客1590_20260721_003.png |
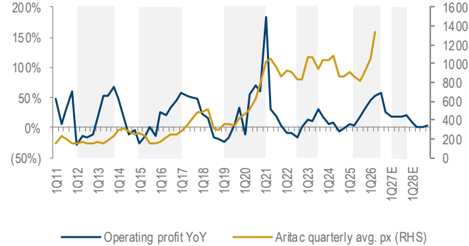
51KB | 真資料圖 | Airtac operating profit YoY growth(藍柱)vs. quarterly average share price(橘線)雙軸圖,1Q11-1Q28E |
001.png(31KB)<40KB 未 Read,預設 logo(Share price performance 區塊小圖)。
原始內容
Taiwan
Airtac International Group (1590 TT)
Target price:
TWD1,950.00 (from TWD1,840.00)
Share price (21 Jul): TWD1,360.00 | Up/downside: +43.4%
2Q26 preview: solid profitability on the cards
- Solid 2026-30E revenue CAGR outlook on pneumatic share gain and…
- … new growth drivers, alongside the margin expansion trend
- Reaffirming our Buy (1) rating; lifting 12M TP to TWD1,950
What's new: We provide our preview on Airtac's 2Q26 results.
What's the impact: Though it has taken longer than expected, we believe we are nearing the linear guide (LG) business bearing fruit from 4Q26. After a 6-7 year ramp-up, we estimate CNY250m in revenue from LG in 2Q26 (internal usage: c.CNY75m) and a c.50% utilisation rate. As such, we expect LG's gross margin to gradually expand from the current c.30% to c.40% by 2H28E, and believe this will be a key driver of gross margin expansion over our forecast horizon. On top of this, we estimate Airtac's electrical controller contributed c.CNY400m (c.5% of total sales) in 2025 with a c.60% gross margin. We forecast this to reach CNY500m in 2026E. Longer term, the company targets c.CNY3bn in annual revenue within the next 10 years. For electrical cylinder, we expect this to be introduced by 2028-29. Given the potential market share gains from the pneumatic market (from 30% now to c.35% in the long term) and new growth drivers from LG, electrical controllers and electrical cylinders, we believe Airtac should deliver teens % revenue CAGR over 2026-30E, alongside improving operating margins. While we see a continuing favourable revenue trend at Airtac, we see YoY revenue growth decelerating from 4Q26 given the high base in 4Q25. As such, we expect share-price momentum to recover on revenue growth acceleration in 2Q27E.
2Q26 preview. We now estimate higher 2Q26 sales at TWD12.2bn (up 21% QoQ and 36% YoY), 10% higher than our previous estimate of TWD11.1bn on stronger industrial demand. We estimate the gross margin to rise 1.8pp QoQ to 49.8% (vs. our prior estimate of 48.6%) on higher leverage on lower fixed costs, and the operating margin to only improve 1.1pp QoQ to 34.3% (still the highest level over past 10 years) as the China government implemented stricter policies on social welfare benefits in 2Q26. The additional and unrealised cost in 1Q26 was reflected in 2Q26, which led to a one-off slightly higher opex ratio. We believe the loss from disposal of assets will largely be offset by government subsidies in 2Q26. Hence, we estimate net income of TWD3.3bn (EPS: TWD16.63).
What we recommend: We raise our 2026-28E EPS by 10-14% to reflect our higher gross-margin assumption. We lift our 12-month TP to TWD1,950 (from TWD1,840), now based on a target PER of 28x (prior: 31x; the high end of its past-3-year range of 18-31x), given the likely earnings growth deceleration ahead, on our 1-year forward EPS. We reaffirm our Buy (1) call. Downside risk: worse-than-expected pneumatic demand in China.
How we differ: Our 2026-28E EPS are 6-14% higher than the consensus, likely due to our more positive view on the company's operating margin.
21 July 2026
5
Daiwa
3
→
2
1
Buy
Sheng Cheng
(886) 2 8758 6253
sheng.cheng@daiwacm-cathay.com.tw
Allan Wang (886) 2 8758 6249
allan.wang@daiwacm-cathay.com.tw
Forecast revisions (%)
| Year to 31 Dec | 26E | 27E | 28E |
|---|---|---|---|
| Revenue change | 7.1 | 8.9 | 6.7 |
| Net profit change | 10.1 | 14.3 | 13.7 |
| Core EPS (FD) change | 10.1 | 14.3 | 13.7 |
Source: Daiwa forecasts
Share price performance
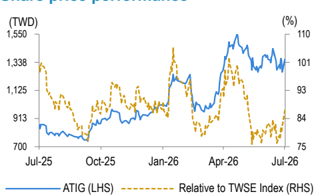
| 12-month range | 741.00-1,550.00 |
|---|---|
| Market cap (USDbn) | 8.43 |
| 3m avg daily turnover (USDm) | 45.48 |
| Shares outstanding (m) | 200 |
| Major shareholder | Ding Kan Invest Ltd. (14.8%) |
Financial summary (TWD)
| Year to 31 Dec | 26E | 27E | 28E |
|---|---|---|---|
| Revenue (m) | 44,670 | 52,080 | 54,997 |
| Operating profit (m) | 14,966 | 17,859 | 18,494 |
| Net profit (m) | 11,958 | 14,290 | 14,746 |
| Core EPS (fully-diluted) | 59.788 | 71.452 | 73.731 |
| EPS change (%) | 42.4 | 19.5 | 3.2 |
| Daiwa vs Cons. EPS (%) | 8.6 | 13.8 | 6.1 |
| PER (x) | 22.7 | 19.0 | 18.4 |
| Dividend yield (%) | 2.0 | 2.9 | 3.4 |
| DPS | 27.3 | 38.9 | 46.4 |
| PBR (x) | 4.6 | 4.1 | 3.8 |
| EV/EBITDA (x) | 15.0 | 12.7 | 12.0 |
| ROE (%) | 21.4 | 22.9 | 21.6 |
Source: FactSet, Daiwa forecasts
Airtac: Daiwa's revenue and earnings forecasts vs. consensus
| 2026E | 2026E | 2026E | 2027E | 2027E | 2027E | 2028E | 2028E | 2028E | |
|---|---|---|---|---|---|---|---|---|---|
| (TWDm) | Previous | New | Consensus | Previous | New | Consensus | Previous | New | Consensus |
| Revenue | 41,723 | 44,670 | 41,595 | 47,804 | 52,080 | 47,020 | 51,534 | 54,997 | 58,691 |
| Diff (%) | 7.1% | 7.4% | 8.9% | 10.8% | 6.7% | -6.3% | |||
| Gross Margin (%) | 47.9% | 48.6% | 48.1% | 48.2% | 48.8% | 48.0% | 47.6% | 48.4% | 48.0% |
| Operating profit | 13,750 | 14,966 | 13,591 | 15,819 | 17,859 | 15,499 | 16,462 | 18,494 | 17,486 |
| Op Margin (%) | 33.0% | 33.5% | 32.7% | 33.1% | 34.3% | 33.0% | 31.9% | 33.6% | 29.8% |
| Net profit | 10,864 | 11,958 | 11,007 | 12,504 | 14,290 | 12,556 | 12,969 | 14,746 | 13,894 |
| EPS (TWD) | 54.32 | 59.79 | 55.03 | 62.52 | 71.45 | 62.78 | 64.85 | 73.73 | 69.47 |
| Diff (%) | 10.1% | 8.6% | 14.3% | 13.8% | 13.7% | 6.1% |
Source: Bloomberg, Daiwa forecasts
Airtac: quarterly and annual P&L statement
| 2026E | 2026E | 2026E | 2026E | 2027E | 2027E | 2027E | 2027E | 2025 | 2026E | 2027E | 2028E | |
|---|---|---|---|---|---|---|---|---|---|---|---|---|
| (TWDm) | 1Q | 2QE | 3QE | 4QE | 1QE | 2QE | 3QE | 4QE | ||||
| Net revenue | 10,014 | 12,164 | 11,512 | 10,981 | 11,818 | 13,890 | 13,419 | 12,953 | 34,330 | 44,670 | 52,080 | 54,997 |
| COGS | -5,210 | -6,108 | -5,923 | -5,705 | -6,089 | -7,006 | -6,863 | -6,704 | -18,548 | -22,946 | -26,662 | -28,354 |
| Gross profit | 4,804 | 6,056 | 5,589 | 5,276 | 5,730 | 6,884 | 6,556 | 6,249 | 15,782 | 21,725 | 25,418 | 26,643 |
| Operating expenses | -1,479 | -1,885 | -1,692 | -1,702 | -1,749 | -1,986 | -1,932 | -1,891 | -5,494 | -6,758 | -7,559 | -8,149 |
| Operating profit | 3,325 | 4,170 | 3,897 | 3,574 | 3,981 | 4,897 | 4,624 | 4,358 | 10,288 | 14,966 | 17,859 | 18,494 |
| Non-operating profit | 99 | 93 | 85 | 86 | 91 | 89 | 84 | 86 | 358 | 364 | 350 | 343 |
| Pre-tax profit | 3,424 | 4,263 | 3,982 | 3,661 | 4,071 | 4,986 | 4,707 | 4,444 | 10,645 | 15,330 | 18,209 | 18,838 |
| Income taxes | -753 | -938 | -876 | -805 | -871 | -1,073 | -1,014 | -961 | -2,245 | -3,372 | -3,919 | -4,091 |
| Net profit | 2,671 | 3,325 | 3,106 | 2,855 | 3,200 | 3,913 | 3,694 | 3,484 | 8,400 | 11,958 | 14,290 | 14,746 |
| Net EPS (TWD) | 13.35 | 16.63 | 15.53 | 14.28 | 16.00 | 19.56 | 18.47 | 17.42 | 42.00 | 59.79 | 71.45 | 73.73 |
| Operating Ratios | ||||||||||||
| Gross margin | 48.0% | 49.8% | 48.6% | 48.1% | 48.5% | 49.6% | 48.9% | 48.2% | 46.0% | 48.6% | 48.8% | 48.4% |
| Operating margin | 33.2% | 34.3% | 33.9% | 32.6% | 33.7% | 35.3% | 34.5% | 33.6% | 30.0% | 33.5% | 34.3% | 33.6% |
| Pre-tax margin | 34.2% | 35.0% | 34.6% | 33.3% | 34.4% | 35.9% | 35.1% | 34.3% | 31.0% | 34.3% | 35.0% | 34.3% |
| Net margin | 26.7% | 27.3% | 27.0% | 26.0% | 27.1% | 28.2% | 27.5% | 26.9% | 24.5% | 26.8% | 27.4% | 26.8% |
| YoY (%) | ||||||||||||
| Net revenue | 24% | 36% | 40% | 22% | 18% | 14% | 17% | 18% | 12% | 30% | 17% | 6% |
| Gross profit | 34% | 47% | 47% | 23% | 19% | 14% | 17% | 18% | 10% | 38% | 17% | 5% |
| Operating profit | 46% | 53% | 58% | 27% | 20% | 17% | 19% | 22% | 14% | 45% | 19% | 4% |
| Pre-tax profit | 39% | 66% | 50% | 24% | 19% | 17% | 18% | 21% | 11% | 44% | 19% | 3% |
| Net profit | 38% | 63% | 48% | 23% | 20% | 18% | 19% | 22% | 10% | 42% | 20% | 3% |
| QoQ (%) | ||||||||||||
| Net revenue | 11% | 21% | -5% | -5% | 8% | 18% | -3% | -3% | ||||
| Gross profit | 12% | 26% | -8% | -6% | 9% | 20% | -5% | -5% | ||||
| Operating profit | 18% | 25% | -7% | -8% | 11% | 23% | -6% | -6% | ||||
| Pre-tax profit | 16% | 25% | -7% | -8% | 11% | 22% | -6% | -6% | ||||
| Net profit | 15% | 25% | -7% | -8% | 12% | 22% | -6% | -6% |
Source: Company, Daiwa forecasts
Airtac: 1-year-forward PER bands
Source: TEJ, Daiwa forecasts
Airtac International Group (1590 TT): 21 July 2026
Daiwa
Airtac: operating profit YoY growth vs. share price movement
Source: Company
Financial summary
Key assumptions
| Year to 31 Dec | 2021 | 2022 | 2023 | 2024 | 2025 | 2026E | 2027E | 2028E |
|---|---|---|---|---|---|---|---|---|
| YoY growth of cylinder revenue (%) | 32 | 0 | 11 | 6 | 13 | 33 | 17 | 3 |
| YoY growth of valve revenue (%) | 34 | (4) | 11 | 7 | 14 | 28 | 16 | 3 |
| Airtac's market share in China (%) | 23 | 25 | 26 | 27 | 28 | 30 | 31 | 32 |
Profit and loss (TWDm)
| Year to 31 Dec | 2021 | 2022 | 2023 | 2024 | 2025 | 2026E | 2027E | 2028E |
|---|---|---|---|---|---|---|---|---|
| Cylinder | 13,039 | 13,081 | 14,555 | 15,373 | 17,434 | 23,202 | 27,117 | 27,928 |
| Valve | 6,446 | 6,212 | 6,895 | 7,371 | 8,379 | 10,766 | 12,486 | 12,867 |
| Other Revenue | 5,915 | 6,780 | 8,378 | 7,916 | 8,517 | 10,702 | 12,476 | 14,202 |
| Total Revenue | 25,400 | 26,073 | 29,827 | 30,660 | 34,330 | 44,670 | 52,080 | 54,997 |
| Other income | 0 | 0 | 0 | 0 | 0 | 0 | 0 | 0 |
| COGS | (13,063) | (14,180) | (16,072) | (16,346) | (18,548) | (22,946) | (26,662) | (28,354) |
| SG&A | (3,556) | (3,590) | (4,007) | (4,221) | (4,370) | (5,471) | (6,157) | (6,638) |
| Other op.expenses | (595) | (736) | (896) | (1,040) | (1,124) | (1,287) | (1,402) | (1,511) |
| Operating profit | 8,186 | 7,568 | 8,852 | 9,052 | 10,288 | 14,966 | 17,859 | 18,494 |
| Net-interest inc./(exp.) | (88) | (51) | (58) | 36 | 65 | 64 | 63 | 63 |
| Assoc/forex/extraord./others | (2) | 198 | (102) | 328 | 293 | 300 | 287 | 281 |
| Pre-tax profit | 8,097 | 7,715 | 8,692 | 9,416 | 10,645 | 15,330 | 18,209 | 18,838 |
| Tax | (1,943) | (1,811) | (1,932) | (2,010) | (2,246) | (3,372) | (3,919) | (4,092) |
| Min. int./pref. div./others | 1 | 0 | 0 | 0 | 0 | 0 | 0 | 0 |
| Net profit (reported) | 6,154 | 5,905 | 6,761 | 7,406 | 8,400 | 11,958 | 14,290 | 14,746 |
| Net profit (adjusted) | 6,154 | 5,905 | 6,761 | 7,406 | 8,400 | 11,958 | 14,290 | 14,746 |
| EPS (reported)(TWD) | 30.771 | 29.523 | 33.803 | 37.029 | 42.000 | 59.788 | 71.452 | 73.731 |
| EPS (adjusted)(TWD) | 30.771 | 29.523 | 33.803 | 37.029 | 42.000 | 59.788 | 71.452 | 73.731 |
| EPS (adjusted fully-diluted)(TWD) | 30.771 | 29.523 | 33.803 | 37.029 | 42.000 | 59.788 | 71.452 | 73.731 |
| DPS (TWD) | 9.148 | 10.148 | 11.148 | 17.370 | 19.550 | 27.300 | 38.862 | 46.444 |
| EBIT | 8,186 | 7,568 | 8,852 | 9,052 | 10,288 | 14,966 | 17,859 | 18,494 |
| EBITDA | 9,913 | 9,728 | 11,267 | 11,613 | 12,866 | 17,638 | 20,728 | 21,593 |
Cash flow (TWDm)
| Year to 31 Dec | 2021 | 2022 | 2023 | 2024 | 2025 | 2026E | 2027E | 2028E |
|---|---|---|---|---|---|---|---|---|
| Profit before tax | 8,097 | 7,715 | 8,692 | 9,416 | 10,645 | 15,330 | 18,209 | 18,838 |
| Depreciation and amortisation | 1,727 | 2,161 | 2,414 | 2,561 | 2,578 | 2,672 | 2,869 | 3,098 |
| Tax paid | (1,943) | (1,811) | (1,932) | (2,010) | (2,246) | (3,372) | (3,919) | (4,092) |
| Change in working capital | (1,866) | (3,392) | (576) | 364 | (3,819) | (3,066) | (3,701) | (1,524) |
| Other operational CF items | 17 | 445 | 243 | 131 | 507 | 0 | (0) | 0 |
| Cash flow from operations | 6,032 | 5,118 | 8,842 | 10,461 | 7,667 | 11,563 | 13,458 | 16,320 |
| Capex | (5,164) | (5,589) | (2,447) | (2,653) | (2,815) | (3,127) | (3,646) | (3,850) |
| Net (acquisitions)/disposals | (452) | 1,619 | (1,096) | (1,411) | 0 | 0 | 0 | 0 |
| Other investing CF items | 124 | 279 | (8) | 0 | 0 | 0 | 0 | 0 |
| Cash flow from investing | (5,492) | (3,692) | (3,551) | (4,064) | (2,815) | (3,127) | (3,646) | (3,850) |
| Change in debt | (6,879) | 3,214 | 135 | (5,838) | (5,341) | 0 | 0 | 0 |
| Net share issues/(repurchases) | 7,873 | 0 | 0 | 0 | 0 | 0 | 0 | 0 |
| Dividends paid | (1,712) | (2,676) | (2,688) | (3,595) | (4,002) | (5,460) | (7,772) | (9,289) |
| Other financing CF items | (76) | (83) | (87) | (85) | (86) | 0 | 0 | 0 |
| Cash flow from financing | (794) | 455 | (2,639) | (9,518) | (9,429) | (5,460) | (7,772) | (9,289) |
| Forex effect/others | (20) | (19) | (11) | 71 | (18) | 0 | 0 | 0 |
| Change in cash | (274) | 1,863 | 2,641 | (3,051) | (4,594) | 2,976 | 2,040 | 3,182 |
| Free cash flow | 868 | (472) | 6,395 | 7,808 | 4,852 | 8,436 | 9,813 | 12,470 |
Source: FactSet, Daiwa forecasts
Airtac International Group (1590 TT): 21 July 2026
Daiwa
Financial summary continued …
Balance sheet (TWDm)
| Year to 31 Dec | 2021 | 2022 | 2023 | 2024 | 2025 | 2026E | 2027E | 2028E |
|---|---|---|---|---|---|---|---|---|
| Cash & short-term investment | 6,222 | 6,608 | 10,064 | 8,617 | 4,085 | 7,061 | 9,101 | 12,283 |
| Inventory | 5,302 | 7,250 | 6,528 | 6,803 | 6,292 | 8,825 | 10,255 | 10,905 |
| Accounts receivable | 7,506 | 9,070 | 9,920 | 9,760 | 14,419 | 15,731 | 18,340 | 19,367 |
| Other current assets | 284 | 326 | 301 | 239 | 251 | 251 | 251 | 251 |
| Total current assets | 19,314 | 23,254 | 26,814 | 25,419 | 25,047 | 31,869 | 37,947 | 42,807 |
| Fixed assets | 24,467 | 28,829 | 28,560 | 28,987 | 28,753 | 29,208 | 29,985 | 30,737 |
| Goodwill & intangibles | 52 | 41 | 35 | 31 | 29 | 29 | 29 | 29 |
| Other non-current assets | 3,846 | 2,475 | 2,640 | 3,124 | 3,711 | 3,711 | 3,711 | 3,711 |
| Total assets | 47,679 | 54,600 | 58,049 | 57,561 | 57,540 | 64,817 | 71,672 | 77,283 |
| Short-term debt | 4,493 | 11,282 | 11,371 | 5,611 | 217 | 217 | 217 | 217 |
| Accounts payable | 1,303 | 1,291 | 1,118 | 1,129 | 1,307 | 2,086 | 2,424 | 2,578 |
| Other current liabilities | 3,424 | 2,361 | 2,324 | 2,364 | 3,106 | 3,106 | 3,106 | 3,106 |
| Total current liabilities | 9,219 | 14,934 | 14,812 | 9,103 | 4,630 | 5,409 | 5,747 | 5,901 |
| Long-term debt | 2,806 | 0 | 10 | 0 | 0 | 0 | 0 | 0 |
| Other non-current liabilities | 502 | 733 | 630 | 558 | 323 | 323 | 323 | 323 |
| Total liabilities | 12,527 | 15,666 | 15,452 | 9,662 | 4,953 | 5,732 | 6,070 | 6,224 |
| Share capital | 2,000 | 2,000 | 2,000 | 2,000 | 2,000 | 2,000 | 2,000 | 2,000 |
| Reserves/R.E./others | 33,144 | 36,926 | 40,589 | 45,893 | 50,581 | 57,078 | 63,596 | 69,054 |
| Shareholders' equity | 35,144 | 38,926 | 42,589 | 47,893 | 52,581 | 59,078 | 65,596 | 71,054 |
| Minority interests | 8 | 7 | 7 | 6 | 6 | 6 | 6 | 6 |
| Total equity & liabilities | 47,679 | 54,600 | 58,049 | 57,561 | 57,540 | 64,817 | 71,672 | 77,283 |
| EV | 273,084 | 276,681 | 273,323 | 269,001 | 268,138 | 265,162 | 263,122 | 259,940 |
| Net debt/(cash) | 1,076 | 4,674 | 1,317 | (3,006) | (3,868) | (6,844) | (8,884) | (12,066) |
| BVPS (TWD) | 175.720 | 194.629 | 212.947 | 239.463 | 262.906 | 295.392 | 327.981 | 355.268 |
Key ratios (%)
| Year to 31 Dec | 2021 | 2022 | 2023 | 2024 | 2025 | 2026E | 2027E | 2028E |
|---|---|---|---|---|---|---|---|---|
| Sales (YoY) | 33 | 2.6 | 14.4 | 2.8 | 12.0 | 30.1 | 16.6 | 5.6 |
| EBITDA (YoY) | 31.6 | (1.9) | 15.8 | 3.1 | 10.8 | 37.1 | 17.5 | 4.2 |
| Operating profit (YoY) | 36.7 | (7.6) | 17 | 2.3 | 13.6 | 45.5 | 19.3 | 3.6 |
| Net profit (YoY) | 32.7 | (4.1) | 14.5 | 9.5 | 13.4 | 42.4 | 19.5 | 3.2 |
| Core EPS (fully-diluted) (YoY) | 25.5 | (4.1) | 14.5 | 9.5 | 13.4 | 42.4 | 19.5 | 3.2 |
| Gross-profit margin | 48.6 | 45.6 | 46.1 | 46.7 | 46.0 | 48.6 | 48.8 | 48.4 |
| EBITDA margin | 39 | 37.3 | 37.8 | 37.9 | 37.5 | 39.5 | 39.8 | 39.3 |
| Operating-profit margin | 32.2 | 29.0 | 29.7 | 29.5 | 30.0 | 33.5 | 34.3 | 33.6 |
| Net profit margin | 24.2 | 22.6 | 22.7 | 24.2 | 24.5 | 26.8 | 27.4 | 26.8 |
| ROAE | 21.4 | 15.9 | 16.6 | 16.4 | 16.7 | 21.4 | 22.9 | 21.6 |
| ROAA | 13.8 | 11.5 | 12 | 12.8 | 14.6 | 19.5 | 20.9 | 19.8 |
| ROCE | 20.7 | 16.3 | 17 | 16.8 | 19.4 | 26.7 | 28.5 | 27.0 |
| ROIC | 18.5 | 14.5 | 15.7 | 16.0 | 17.3 | 23.1 | 25.7 | 25.0 |
| Net debt to equity | 3.1 | 12.0 | 3.1 | n.a. | n.a. | n.a. | n.a. | n.a. |
| Effective tax rate | 24 | 23.5 | 22.2 | 21.4 | 21.1 | 22.0 | 21.5 | 21.7 |
| Accounts receivable (days) | 104.8 | 116.0 | 116.2 | 117.1 | 128.5 | 123.2 | 119.4 | 125.1 |
| Current ratio (x) | 2.1 | 1.6 | 1.8 | 2.8 | 5.4 | 5.9 | 6.6 | 7.3 |
| Net interest cover (x) | 93.5 | 149.8 | 151.7 | n.a. | n.a. | n.a. | n.a. | n.a. |
| Net dividend payout | 37.3 | 33.0 | 37.8 | 51.4 | 52.8 | 65.0 | 54.4 | 63.0 |
| Free cash flow yield | 0.3 | n.a. | 2.4 | 2.9 | 1.8 | 3.1 | 3.6 | 4.6 |
Source: FactSet, Daiwa forecasts
Company profile
Founded in 1988, Airtac is the second-largest manufacturer of pneumatic components in China, with a 20% market share based on sales volume for 2018. Its key products include cylinder, valves, and filters, regulators & lubricators (FRL). The company sells all the products under its own product brand, AirTAC, and also provides after-sales services that include installation, maintenance, etc.
Airtac International Group (1590 TT): 21 July 2026
Daiwa
ESG analysis
ESG risks
| Risks | Management | Analyst comments |
|---|---|---|
| Executive/board quality | 2 | Airtac has 10 directors on its board, with 4 independent directors. All its independent directors have passed the independence requirements set by local governments and experts in the following areas, including business management, the pneumatic industry, and law. We see the diversified background of Airtac's independent directors being positive for the company's governance. |
| Capital management | 3 | Between 2021-23, Airtac's dividend payout ratio has been below 50%. The payout ratio was even lower at 33-36% during 2019-20 due to higher capex (especially in 2017 and 2018) to increase Airtac's capacities in both pneumatic products and linear guides. Despite a lower payout ratio than other listed companies, we attribute it to the unique business model of the pneumatic industry as it requires higher working capital than other industries due to its longer cash conversion cycle period. According to Airtac, the payout ratio should slightly increase in 1-2 years due to improving free cash flows and increasing revenue scale. For 2025, Airtac declared a DPS of TWD19.55, for a payout ratio of 53%. |
| Related party & transaction | 1 | Sales to related parties accounted for limited 2024 sales, and there were no purchases from related parties. We see limited risk from related-party transactions. Airtac Ningbo has been certified by the Provincial High-tech Enterprise Research and |
| Product design & lifecycle management | 2 | system to track data related to product lifecycles, which should increase the speed of development while ensuring product quality, in our view. Green design is another of its R&D targets. Airtac plans to: 1) use environmental-friendly materials that meet RoHS 2.0 regulations, 2) reduce energy consumption by reducing product size, and 3) improve the decomposability of products and reduce the substances in use to facilitate the disposal treatment after the end of product lifecycle. In 2022, Airtac invested TWD140.6m in environmental protection. As the greenhouse gas (GHG) by Airtac during the manufacturing process is mainly from electricity and a small amount petrochemicals, the emissions are indirect and limited. The types of GHG emissions include CH4, N2O. The total GHG emissions produced in 2022 were 118.3 thousand tonnes. To |
| GHG emissions | 2 | created of CO2, reduce the risk of climate change, Airtac aims to reduce its energy consumption per sales unit by 8-15% in 2025 compared with 2021. |
Note: Management score represents a company's ability to manage/benefit from certain ESG topics. The scores range from 1 to 3, with 1 being the strongest.
Update Date: 21 Jul 2026
Source: Daiwa, Company
Airtac International Group (1590 TT): 21 July 2026
Daiwa