PDF 原檔:報告_Citi_順達3211首次評等_20260707_original.pdf
圖片清單(已驗證 2026-07-08)
ingest 時建立的「眼見為憑」圖片索引,是 lib/ 嵌圖的唯一真相來源。<40KB 未 Read(預設 logo/裝飾)。
| 檔名 | size | 分類 | 親眼所見內容 |
|---|---|---|---|
報告_Citi_順達3211首次評等_20260707_001.png |
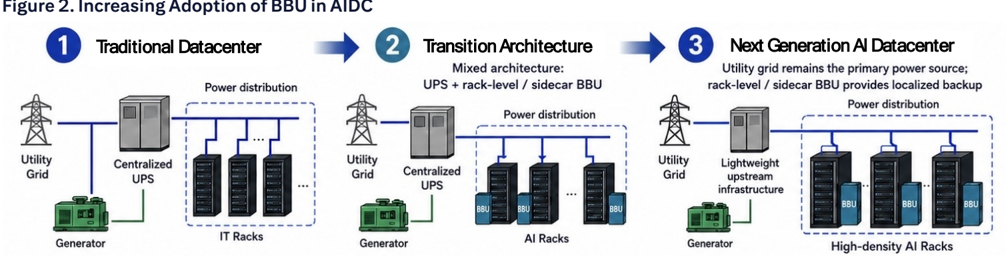
269KB | 真資料圖 | Figure 2:BBU in AIDC 架構演進示意圖——傳統資料中心(集中式 UPS)→ 過渡架構(UPS + rack-level BBU)→ 次世代 AI 資料中心(分散式 BBU)三步驟流程圖 |
報告_Citi_順達3211首次評等_20260707_002.png |
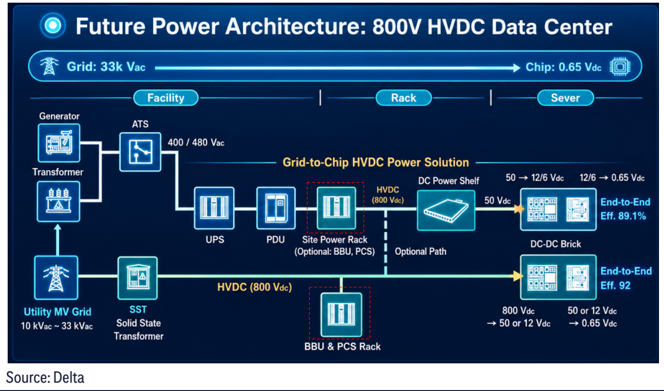
253KB | 真資料圖 | Figure 3:800V HVDC 資料中心電力架構圖——Utility Grid→Generator→Transformer→ATS→UPS→PDU→Site Power Rack(含 BBU/PCS 選配)→HVDC 800V DC→DC Power Shelf→DC-DC Brick→Chip(Source: Delta) |
報告_Citi_順達3211首次評等_20260707_003.png |
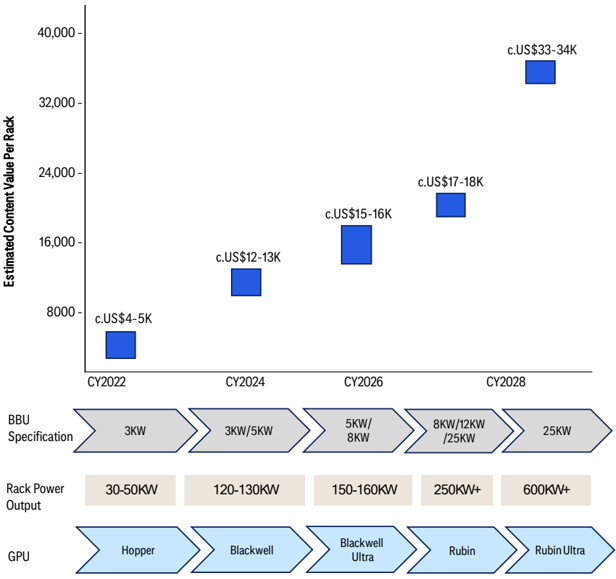
64KB | 真資料圖 | Figure 4:每機架 BBU 內含價值估算長條圖——CY2022(3kW, 30-50kW, Hopper, US$4-5K)→CY2024(3kW/5kW, 120-130kW, Blackwell, US$12-13K)→CY2026(5kW/8kW, 150-160kW, Blackwell Ultra, US$15-16K)→CY2028(8kW/12kW/25kW, 250kW+/600kW+, Rubin/Rubin Ultra, US$17-18K/US$33-34K) |
報告_Citi_順達3211首次評等_20260707_004.png |
39KB | 未 Read(<40KB) | — |
報告_Citi_順達3211首次評等_20260707_005.png |
38KB | 未 Read(<40KB) | — |
報告_Citi_順達3211首次評等_20260707_006.png |
45KB | 真資料圖 | Figure 8:順達 Forward P/E 與 EPS 成長率時序圖(Dec-13 至 Dec-26)——平均 14x(2013-2024)到 4Q24 起平均 20x,EPS 成長率(右軸)為灰色階梯線 |
報告_Citi_順達3211首次評等_20260707_007.png |
29KB | 未 Read(<40KB) | — |
報告_Citi_順達3211首次評等_20260707_008.png |
24KB | 未 Read(<40KB) | — |
報告_Citi_順達3211首次評等_20260707_009.png |
268KB | 真資料圖 | Figure 12:同 _001,BBU in AIDC 架構演進圖(重複出現)——傳統→過渡→次世代 AI 資料中心三步驟 |
報告_Citi_順達3211首次評等_20260707_010.png |
70KB | 真資料圖 | Figure 14:3kW BBU 實物產品照——矩形金屬模組,正面有 OK/LVD/EOL/FAULT 指示燈及 HEALTH 按鈕 |
報告_Citi_順達3211首次評等_20260707_011.png |
91KB | 真資料圖 | BBU vs UPS 資料中心比較示意圖——左側 BBU(分散式,安裝於各機架旁/Battery shelf)vs 右側 UPS(集中化,獨立機房),空間需求比較(Limited Space vs Large Space) |
報告_Citi_順達3211首次評等_20260707_012.png |
279KB | 真資料圖 | Figure 15:800 VDC Power Rack 實物照片——左為電源機架(6個 BBU 用紅色框標示),右為 NVIDIA BlueField-4 STX Storage Rack,顯示 BBU 在 power rack 中的實際安裝位置 |
報告_Citi_順達3211首次評等_20260707_013.png |
33KB | 未 Read(<40KB) | — |
報告_Citi_順達3211首次評等_20260707_014.png |
493KB | 真資料圖 | Figure 18:800V HVDC 資料中心電力架構圖(高解析版,同 _002 架構,Source: Delta)——從 Utility MV Grid 10kVac~33kVac 到 Chip 0.65Vdc 完整路徑,含 SST(Solid State Transformer)支路 |
報告_Citi_順達3211首次評等_20260707_015.png |
162KB | 真資料圖 | Figure 19:BBU 供應鏈全圖——上游(電芯廠:Panasonic/Google+Meta+AWS+Microsoft, Murata, Samsung SDI, LG Energy Solution)→中游(BBU 模組廠:AES/AWS, Dynapack/AWS+Meta, STL/Google, Sysgration/Google, BorgWarner, Flex)→下游(PSU 整合商:Delta, Lite-on, Vertiv, Schneider, Eaton)三層架構 |
報告_Citi_順達3211首次評等_20260707_016.png |
53KB | 真資料圖 | Figure 20:BBU 供應鏈兩種商業模式圖——直連 CSP 型(Panasonic/FLEX/AES → Google/AWS/Meta/Microsoft)vs PSU 合作型(AES/Dynapack/STL/Sysgration → Delta/Lite-On → Google/AWS/Meta/Microsoft) |
報告_Citi_順達3211首次評等_20260707_017.png |
64KB | 真資料圖 | Figure 21:同 _003,每機架 BBU 內含價值估算長條圖(重複出現),各世代 BBU 規格與機架功率對應 |
報告_Citi_順達3211首次評等_20260707_018.png |
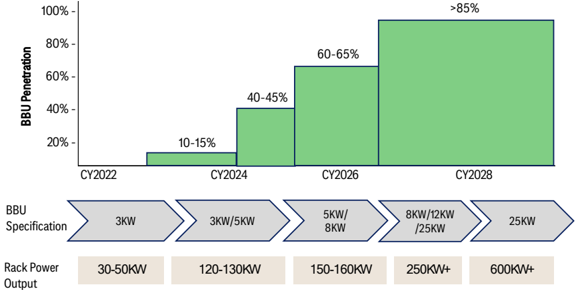
52KB | 真資料圖 | Figure 22:BBU 滲透率估算階梯長條圖——CY2024(10-15%)→CY2026(60-65%)→CY2028(>85%),含各世代 BBU 規格(3kW→5kW/8kW→8kW/12kW/25kW)與機架功率 |
報告_Citi_順達3211首次評等_20260707_019.png |
44KB | 真資料圖 | Figure 23:每機架 BBU 內含價值估算(同 _003 另一版本,無 GPU 世代底部標籤)US$4-5K→US$12-13K→US$15-16K→US$17-18K→US$33-34K |
報告_Citi_順達3211首次評等_20260707_020.png |
29KB | 未 Read(<40KB) | — |
報告_Citi_順達3211首次評等_20260707_021.png |
23KB | 未 Read(<40KB) | — |
報告_Citi_順達3211首次評等_20260707_022.png |
27KB | 未 Read(<40KB) | — |
報告_Citi_順達3211首次評等_20260707_023.png |
43KB | 真資料圖 | Figure 27:順達 Group Sales and YoY 堆疊長條圖(2018-2028E)——深藍 IT、淺藍 Non-IT、深綠 Others,黑色折線為 Group Sales YoY;2025 起 Non-IT 超越 IT,2026E 達 55% |
報告_Citi_順達3211首次評等_20260707_024.png |
36KB | 未 Read(<40KB) | — |
報告_Citi_順達3211首次評等_20260707_025.png |
24KB | 未 Read(<40KB) | — |
報告_Citi_順達3211首次評等_20260707_026.png |
36KB | 未 Read(<40KB) | — |
報告_Citi_順達3211首次評等_20260707_027.png |
19KB | 未 Read(<40KB) | — |
報告_Citi_順達3211首次評等_20260707_028.png |
41KB | 真資料圖 | Figure 32:順達毛利率(GPM)、營益率(OPM)、淨利率(Net Margin)趨勢折線圖(2018-2028E)——GPM 從 7-11% 擴張至 2028E 28.4%,OPM 從 4-5% 升至 22.1%,Net Margin 同步改善 |
報告_Citi_順達3211首次評等_20260707_029.png |
29KB | 未 Read(<40KB) | — |
報告_Citi_順達3211首次評等_20260707_030.png |
35KB | 未 Read(<40KB) | — |
報告_Citi_順達3211首次評等_20260707_031.png |
29KB | 未 Read(<40KB) | — |
報告_Citi_順達3211首次評等_20260707_032.png |
33KB | 未 Read(<40KB) | — |
報告_Citi_順達3211首次評等_20260707_033.png |
31KB | 未 Read(<40KB) | — |
報告_Citi_順達3211首次評等_20260707_034.png |
14KB | 未 Read(<40KB) | — |
報告_Citi_順達3211首次評等_20260707_035.png |
57KB | 真資料圖 | Figure 44:順達 Forward P/E vs EPS 成長率時序圖(Dec-13 至 Dec-26)——藍線 Forward P/E(左軸),灰色階梯 EPS 成長率(右軸);avg 14x(2013-2024),avg 20x since 4Q24 |
報告_Citi_順達3211首次評等_20260707_036.png |
47KB | 真資料圖 | Figure 45:順達 Forward P/B vs ROE 時序圖(Dec-13 至 Jan-26)——藍線 Forward P/B(左軸),灰階 ROE %(右軸);2024-25 後顯著上升 |
報告_Citi_順達3211首次評等_20260707_037.png |
36KB | 未 Read(<40KB) | — |
報告_Citi_順達3211首次評等_20260707_038.png |
135KB | 真資料圖 | Figure 47:順達產品實物照——左側:5 款不同型號 IT 筆記型電腦電池包(HP/ASUS/其他品牌);右側:BBU 鋰離子電池模組外殼(上)與開蓋後顯示圓柱形電芯排列(下) |
報告_Citi_順達3211首次評等_20260707_039.png |
40KB | 真資料圖 | Figure 49:順達 IT vs Non-IT 營收結構堆疊長條圖(2018-2028E)——IT(深藍)自 2018 年 94% 逐步降至 2028E 25%,Non-IT(淺藍)自 6% 升至 74% |
報告_Citi_順達3211首次評等_20260707_040.png |
130KB | 真資料圖 | Figure 50:順達亞洲生產地點地圖——中國(標示「Mostly produce battery packs for IT products」)、泰國(「Produce battery packs for both IT & non-IT products」)、台灣(「Mostly produce battery packs for non-IT products」) |
報告_Citi_順達3211首次評等_20260707_041.png |
18KB | 未 Read(<40KB) | — |
報告_Citi_順達3211首次評等_20260707_042.png |
48KB | 真資料圖 | Figure 53:順達外資持股比率(Dynapack FINI %)時序圖(Jul-20 至 Jul-26)——從 17% 震盪至 2025 年初上升至 30%,後回落至 26-27% 區間 |
報告_Citi_順達3211首次評等_20260707_043.png |
29KB | 未 Read(<40KB) | — |
報告_Citi_順達3211首次評等_20260707_044.png |
28KB | 未 Read(<40KB) | — |
報告_Citi_順達3211首次評等_20260707_045.png |
37KB | 未 Read(<40KB) | — |
報告_Citi_順達3211首次評等_20260707_046.png |
55KB | 真資料圖 | Figure 57:AES(6781)Forward P/E 與 EPS 成長率雙軸時序圖(Mar-21 至 Jul-26)——藍線 Forward P/E(左軸,0-60x),灰色折線 EPS 成長率(右軸,-50%至200%),標示平均 27x 虛線 |
報告_Citi_順達3211首次評等_20260707_047.png |
167KB | 真資料圖 | AES(6781)Bull/Bear/Base 情境股價圖——當前 NT$1,250(06 Jul 26),Base NT$1,680(+34%),Bull NT$2,400(+92%),Bear NT$650(-48%);含各假設(Base: 銷售 CAGR 24%、獲利 CAGR 27%、27x 目標 PE) |
報告_Citi_順達3211首次評等_20260707_048.png |
97KB | 真資料圖 | 順達(3211)Bull/Bear/Base 情境股價圖——當前 NT$422.50(06 Jul 26),Base NT$800(+89%),Bull NT$1,000(+137%),Bear NT$390(-7.7%);含各假設(Base: 銷售 CAGR 35%、獲利 CAGR 66%、32x 2027E PE) |
報告_Citi_順達3211首次評等_20260707_049.png |
175KB | 真資料圖 | 順達(3211.TWO)與三星 SDI(006400.KS)評等與目標價歷史圖(法規揭露頁)——順達歷史為虛線(Not covered,2023-2026,股價自約 NT$50 升至 NT$400+);三星 SDI 評等歷史含 10 個標記點 |
報告_Citi_順達3211首次評等_20260707_050.png |
327KB | 真資料圖 | LG 能源(373220.KS)、AES(6781.TW)評等與目標價歷史及 AES Short-Term View 圖(法規揭露頁)——AES TP 歷史共 8 點(NT$805→870→820→670→1020→1220→1330→1660) |
報告_Citi_順達3211首次評等_20260707_051.png |
221KB | 真資料圖 | LG 能源(373220.KS)Short-Term View 與三星 SDI Short-Term View 圖(法規揭露頁)——各含 CW(Catalyst Watch)與 STV 標記點 |
原始內容
Deep
Dive
a
Taiwan Electronic Components & Equipment
Riding the AIDC BBU Growth Cycle; Initiate Dynapack at Buy
CITI'S TAKE
We believe AI infrastructure is entering a new power architecture cycle, where rising power density is driving a structural shift from centralized UPS toward rack-level backup power. We expect this transition to significantly increase both BBU content value per rack and industry penetration over the next several years, creating a multi-year growth opportunity that remains underappreciated by the market. We initiate Dynapack at Buy with TP NT$800 (32x 2027E P/E) as we believe it is one of the most direct beneficiaries of this structural transition. Boosted by accelerating BBU demand, improving product mix and expanding profitability, we forecast 34% sales CAGR and 60% earnings CAGR over 2025-2028E.
AI power architecture is shifting toward distributed backup power, making BBU increasingly essential -Battery Backup Unit (BBU) is emerging as a key enabling technology in next gen AIDC as rack power density continues to rise. Compared with centralized UPS, localized backup power provides faster ride-through capability, lower power conversion losses and better scalability. We believe this represents a structural evolution in AI power architecture, making BBU an increasingly standard component in high-density AI racks.
We see both BBU content value and penetration expanding meaningfully as AI power architecture evolves -Based on our bottom-up module approach, we estimate BBU content value per AI rack rises from c.US$15-16K today for GB300 NVL72 to US$17-18K for Rubin and could exceed US$33K under Rubin Ultra as higher-power BBU modules become necessary. We also estimate BBU penetration increases from 40-45% in 2025 to 60-65% in 2026 and above 85% in 2027, supported by the adoption of rack-scale architectures and HVDC power distribution. We believe the combination of rising content value and penetration creates a compelling structural growth opportunity for the BBU ecosystem.
Initiate Dynapack at Buy with TP NT$800 as we view it as the most direct beneficiary of the strong BBU growth cycle -We believe the company is well positioned to benefit from the structural migration toward rack-level backup power, capturing accelerating BBU demand as AI rack power increases, driving 34% group sales CAGR in 2025-2028E, supported by 74% CAGR in non-IT sales. With product mix shifting toward high-margin BBU products, we forecast GPM to reach 28.4% in 2028E from 16.6% in 2025, driving 60% earnings CAGR over 2025-2028E. We assign a 32x target P/E on our 2027E EPS of NT$25 to derive our TP NT$800.
Prefer Dynapack over AES -While AES remains the dominant BBU supplier given its scale, customer relationships, and technology leadership, we believe Dynapack offers a more attractive risk-reward profile at the current stage of the AI infrastructure investment cycle, as its earnings remain in the early phase of a multiyear growth and margin expansion story. We estimate 60% earnings CAGR over 2025-2028E for Dynapack vs. AES's 27% driven by product mix improvement and stronger op leverage.
See Appendix A-1 for Analyst Certification, Important Disclosures and Research Analyst Affiliations.
Not for distribution in the People's Republic of China, excluding the Hong Kong Special Administrative Region and Qualified Foreign Institutional Investors.
Prepared for Kevin Lu
Angela Hsu AC +886-2-8726-9083 angela.hc.hsu@citi.com
Prepared for Kevin Lu
Data Summary
| Current | Current | Next Fiscal Year | Next Fiscal Year | ||||||||||||||
|---|---|---|---|---|---|---|---|---|---|---|---|---|---|---|---|---|---|
| Rating | Short- Term | Price | Price | EPS | EPS | ||||||||||||
| Company | Ticker | Ccy | Price | MktCap (M) | Date& Time | Old | New | View | Old | New ESPR(%) | Div Yld (%) | ETR(%) | Last Rpt Yr | Old | New | Old | New |
| Advanced Energy Solution | 6781.TW | NT$ | 1,250.00 | 106,773 | 06Jul 13:30 | 1 | nc | - 1,660.00 | 1,680.00 | 34.4 | 1.8 | 36.2 | Dec-25 | 51.89 | 46.35 | 65.91 | 61.35 |
| Dynapack International | 3211.TWO | NT$ | 422.50 | 65,194 | 06Jul 15:00 | 1 | - | - 800.00 | 89.3 | 2.8 | 92.2 | Dec-25 | - | 15.00 | - | 25.00 | |
| 1=Buy,2=Neutral,3=Sell,H=HighRisk | 1=Buy,2=Neutral,3=Sell,H=HighRisk | 1=Buy,2=Neutral,3=Sell,H=HighRisk | 1=Buy,2=Neutral,3=Sell,H=HighRisk | 1=Buy,2=Neutral,3=Sell,H=HighRisk | ESPR=ExpectedSharePriceReturn, ETR=ExpectedTotalReturn, nc=nochange | ESPR=ExpectedSharePriceReturn, ETR=ExpectedTotalReturn, nc=nochange | ESPR=ExpectedSharePriceReturn, ETR=ExpectedTotalReturn, nc=nochange | ESPR=ExpectedSharePriceReturn, ETR=ExpectedTotalReturn, nc=nochange | ESPR=ExpectedSharePriceReturn, ETR=ExpectedTotalReturn, nc=nochange | ESPR=ExpectedSharePriceReturn, ETR=ExpectedTotalReturn, nc=nochange | ESPR=ExpectedSharePriceReturn, ETR=ExpectedTotalReturn, nc=nochange | ESPR=ExpectedSharePriceReturn, ETR=ExpectedTotalReturn, nc=nochange | ESPR=ExpectedSharePriceReturn, ETR=ExpectedTotalReturn, nc=nochange | ESPR=ExpectedSharePriceReturn, ETR=ExpectedTotalReturn, nc=nochange | ESPR=ExpectedSharePriceReturn, ETR=ExpectedTotalReturn, nc=nochange | ESPR=ExpectedSharePriceReturn, ETR=ExpectedTotalReturn, nc=nochange | ESPR=ExpectedSharePriceReturn, ETR=ExpectedTotalReturn, nc=nochange |
| Source: Citi Research | Source: Citi Research | Source: Citi Research | Source: Citi Research | Source: Citi Research | ^CatalystWatch | ^CatalystWatch | ^CatalystWatch | ^CatalystWatch | ^CatalystWatch | ^CatalystWatch | ^CatalystWatch | ^CatalystWatch | ^CatalystWatch | ^CatalystWatch | ^CatalystWatch | ^CatalystWatch | ^CatalystWatch |
3
Prepared for Kevin Lu
Earnings Estimates
| Last Reported Year | Last Reported Year | Last Reported Year | Last Reported Year | Last Reported Year | Current Fiscal Year | Current Fiscal Year | Current Fiscal Year | Current Fiscal Year | Current Fiscal Year | Next Fiscal Year | Next Fiscal Year | Next Fiscal Year | Next Fiscal Year | Next Fiscal Year | ||||
|---|---|---|---|---|---|---|---|---|---|---|---|---|---|---|---|---|---|---|
| CompanyName | Ticker | Last Rpt Year | Currency | 1Q | 2Q | 3Q | 4Q | FY0 | 1Q | 2Q | 3Q | 4Q | FY1 | 1Q | 2Q | 3Q | 4Q | FY2 |
| Advanced Energy Solution | 6781.TW | Dec-25 | NT$ | 9.70 | 9.66 | 9.35 | 9.49 | 38.20 | 10.64 | 11.41 | 12.12 | 12.19 | 46.35 | 12.79 | 14.64 | 16.73 | 17.19 | 61.35 |
| Old | Dec-24 | NT$ | 5.41 | 5.22 | 6.27 | 8.49 | 25.39 | 9.70 | 9.66 | 10.71 | 9.99 | 40.06 | 8.89 | 11.76 | 15.75 | 15.49 | 51.89 | |
| DynapackInternational | 3211.TWO | Dec-25 | NT$ | 1.07 | 3.89 | 1.56 | 2.53 | 9.05 | 2.05 | 2.37 | 4.19 | 6.39 | 15.00 | 3.85 | 3.82 | 6.78 | 10.55 | 25.00 |
| Source: Citi Research |
Prepared for Kevin Lu
Contents
| ExecutiveSummary | 6 |
|---|---|
| BBU:PoweringNextGenAIRacks | 12 |
| ACloserLookatBBUSupplyChain | 17 |
| BBU: Rising Content Value andPenetrationAsPower Density Further Accelerates | 20 |
| Dynapack(3211.TWO): OurInvestment Thesis | 26 |
| Investment positive #1 - riding on the strongdemandofBBU from AIDC buildout, driving structural growth | 26 |
| Investment positive #2-Intact margin expansion from rising non-IT sales | 30 |
| Investment positive #3-Strong Partnership with PSUoperators provides access to a broaderCSPbase | 32 |
| Dynapack(3211.TWO): Financial Analysis | 35 |
| Dynapack(3211.TWO): Valuation Methodology andRisks | 40 |
| Dynapack(3211.TWO):CompanyOverview | 42 |
| Bull/Bear: AdvancedEnergy Solution (6781.TW) | 49 |
| Bull/Bear: DynapackInternational (3211.TWO) | 50 |
| AdvancedEnergy Solution | 51 |
| Companydescription | 51 |
| Investment strategy | 51 |
| Valuation | 51 |
| Risks | 51 |
| DynapackInternational | 51 |
| Companydescription | 51 |
| Investment strategy | 52 |
| Valuation | 52 |
| Risks | 52 |
| Appendix A-1 | 53 |
Prepared for Kevin Lu
| Figure1.ValuationCompofBBUSupplyChain | Target | Price | Mkt-Cap | 3M ADT | P/E (x) | EV/EBITDA (x) | EV/EBITDA (x) | EV/EBITDA (x) | P/B (x) | P/B (x) | 25- 27E 2yr Dividend yield (%) | 25- 27E 2yr Dividend yield (%) | ROE | ROE | ROE | ROE | ROE | ROE | ROE | ROE | ROE | |||||||||
|---|---|---|---|---|---|---|---|---|---|---|---|---|---|---|---|---|---|---|---|---|---|---|---|---|---|---|---|---|---|---|
| Company | RIC | Rating* | Curr | Price | 6-Jul | US$M | US$M | FY26E | FY27E | FY28E | FY26E | FY27E | FY28E | FY26E | FY27E | FY28E | FY26E | FY28E | EPS CAGR (%) | FY26E | FY27E | FY28E | FY28E | FY28E | FY28E | FY28E | FY28E | FY28E | FY28E | |
| Taiwan | FY27E | |||||||||||||||||||||||||||||
| Dynapack | 3211.TWO | 1 | TWD | 800.0 | 422.5 | 2,041.1 | 116.9 | 28.2 | 16.9 | 11.3 | 19.2 | 11.7 | 7.9 | 7.3 | 6.7 | 2.8 | 4.7 | 7.1 | 66.3 | 24% | 41% | 56% | 56% | 56% | 56% | 56% | 56% | 56% | 56% | |
| AES-KY | 6781.TW | 1 | TWD | 1,680.0 | 1,250.0 | 3,342.8 | 61.1 | 27.0 | 20.4 | 16.0 | 18.4 | 13.6 | 5.2 | 4.5 | 6.0 3.8 | 1.8 | 2.4 | 26.7 | 21% | 24% | 26% | 26% | 26% | 26% | 26% | 26% | 26% | 26% | ||
| STL | 4931.TWO | NR | TWD | NA | 261.0 | 535.8 | 72.2 | na | na | na | na | na | 10.6 na | na | na | na | na | 3.1 na | na | na | na | na | na | na | na | na | na | na | na | |
| Sysgration | 5309.TWO | NR | TWD | NA | 68.9 | 496.9 | 18.4 | 53.0 | 20.4 | na | na | na | na | 7.4 | 5.7 | na na | 0.9 | 1.7 | na | 72.8 | 9% | 26% | na | na | na | na | na | na | na | na |
| Simplo | 6121.TWO | 1 | TWD | 480.0 | 467.5 | 2,707.3 | 12.0 | 14.6 | 12.3 | na | 4.5 | 3.6 | na | 2.4 | 2.2 | na | 4.9 | 5.8 | na | 16.2 | 17% | 19% | na | na | na | na | na | na | na | na |
| Celxpert | 3323.TWO | NR | TWD | NA | 37.6 | 117.0 | 2.1 | na | na | na | na | na | na | na | na | na | na | na | na | na | na | na | na | na | na | na | na | na | na | na |
| Delta | 2308.TW | 1 | TWD | 2,480.0 | 1,995.0 | 162,239.7 | 849.2 | 50.9 | 32.3 | 19.6 | 26.7 | 17.8 | 10.9 | 13.3 | 9.7 | 1.0 | 1.6 | 2.6 | 63.3 | 28% | 35% | 40% | 40% | 40% | 40% | 40% | 40% | 40% | 40% | |
| Lite-On | 2301.TW | NR | TWD | NA | 224.0 | 16,242.7 | 229.6 | 25.9 | 18.7 | 14.9 | 16.2 | 11.5 | 9.8 | 5.2 | 4.7 | 6.7 4.6 | 2.9 | 3.8 4.8 | 34.6 | 21% | 27% | 31% | 31% | 31% | 31% | 31% | 31% | 31% | 31% | |
| AcBel | 6282.TW | NR | TWD | NA | 74.7 | na | na | na | na | na | na | na | na | na | na | na | na | na | na | na | na | na | na | na | na | na | na | |||
| Voltronic | 6409.TW | NR | 59.8 | 1,602.7 | na 2.5 | 2.8 | 2.6 | 31% | 36% | 41% | 41% | 41% | 41% | 41% | 41% | 41% | 41% | |||||||||||||
| Chicony | TWD | NA | 3,564.3 | 34.5 | 38.8 | 30.9 | 25.6 | 26.0 | 22.1 | 18.7 | 12.0 | 10.7 | 9.9 | 2.4 | 13.0 | na | na | na | na | na | na | na | na | |||||||
| 6412.TW | NR | TWD | 1,290.0 | 5.5 | na | 14% | 19% | |||||||||||||||||||||||
| Sub-Average | NA | 92.0 | 1,154.3 | 9.7 | 16.3 31.8 | 13.9 20.7 | na 17.5 | 7.9 17.0 | 6.2 12.3 | na 11.6 | 2.2 6.9 | 2.4 5.8 | na 6.2 | 4.5 2.7 | 3.5 | 4.1 | 36.9 | 21% | 28% | 39% | 39% | 39% | 39% | 39% | 39% | 39% | 39% | |||
| Korea & Japan | ||||||||||||||||||||||||||||||
| Panasonic | 6752.T | 1 1 | JPY JPY | 5,100.0 | 4,557.0 | 65,932.3 | 272.7 | 65.5 | 23.3 | 18.5 | 17.9 | 11.1 | 9.3 | 2.0 | 1.9 | 1.8 | 0.9 | 1.2 | 1.5 | 11.7 | 3% | 9% | 10% | 10% | 10% | 10% | 10% | 10% | 10% | 10% |
| Murata | 6981.T | 1 | KRW | 15,000.0 900,000.0 | 10,250.0 451,500.0 | 115,618.9 | 1,175.3 294.5 | 80.7 | 53.8 | 37.8 | 38.6 | 28.9 | 21.1 | 6.9 | 6.4 | 5.7 | 0.6 0.2 | 0.2 | 0.7 | 0.8 | 12% | 6% | 0.2 | 21.8 na | 9% 1% | 16% 8% | 16% 8% | 16% 8% | ||
| SamsungSDI | 006400.KS | KRW | 565,000.0 | 23,791.5 54,242.5 | 142.6 | 161.9 335.8 | 21.5 38.1 | 16.4 16.6 | 29.5 18.9 | 9.3 11.6 | 8.2 7.5 | 3.8 | 1.4 | 1.4 3.4 | 1.3 2.9 | na | na | na | 1% | 9% | 19% | 19% | 19% | 19% | 19% | 19% | 19% | |||
| LG Energy | 373220.KS | 1 | 354,500.0 | 160.9 | 34.2 | 22.3 | 26.2 | 15.2 | 11.5 | 3.5 | 2.9 | 0.6 | na 0.7 | 0.8 | ||||||||||||||||
| Sub-Average | 3.3 | 16.8 | 4% | 9% | 13% | 13% | 13% | 13% | 13% | 13% | ||||||||||||||||||||
| China | ||||||||||||||||||||||||||||||
| Kehua | 002335.SZ | NR | CNY CNY | NA | 37.9 | 4,188.7 | 263.5 | 38.0 | 27.9 | 22.4 | 20.2 | 16.4 | 14.5 | 3.7 | 3.4 | 3.1 | 1.3 | 1.8 3.0 | 11% | 56.0 15% | 17% | 17% | 17% | 17% | 17% | 17% | 17% | 17% | 17% | 17% |
| KSTAR | 002518.SZ | NR | CNY | NA | 120.9 | 30.4 | 21.6 | 16.7 | 22.1 | 16.2 | 12.4 | 5.0 | 3.5 | 1.3 | 1.9 | 2.7 44.2 | 17% | 20% | 22% | 22% | 22% | 22% | 22% | 22% | 22% | |||||
| INVT | 002334.SZ | NR 1 | CNY | NA | 47.5 | 4,081.2 | na | na | na | 4.3 na | na | na | na 32.3 | na | 28% | na 29% | na | na | na | na | na | na | na | |||||||
| CATL | 300750.SZ | 1 | CNY | 603.0 | 7.1 | 858.1 | 53.1 | na | na | na | na | 6.8 | 4.2 | 3.6 | na | na | 3.7 | 4.4 na | 29% | 29% | 29% | 29% | 29% | 29% | 29% | 29% | 29% | |||
| BYD | 002594.SZ | 374.5 | 262,482.4 | 2,231.0 | 16.6 | 13.5 | 11.5 12.7 | 11.0 | 8.5 | 2.9 | 3.0 | 3.0 2.3 | 1.7 | 2.7 | 21.0 | 18% | 15% | 16% | 19% | 19% | 19% | 19% | 19% | 19% | ||||||
| EVEEnergy | 300014.SZ | 1 | CNY CNY | 131.0 | 87.5 | 97,413.2 | 643.4 | 19.8 14.8 | 16.8 12.0 | 9.0 | 4.5 10.6 | 3.6 8.7 | 2.7 6.1 | 2.5 | 2.6 2.2 | na | na | 2.1 | 3.0 | 57.8 83.3 | 20% | 22% | 22% | 22% | 22% | |||||
| Sunwoda | NR | 87.9 NA | 19,060.9 | 747.5 | 1.1 | 1.8 | 2.4 | 3.1 | 14% | 14% | 14% | 14% | 14% | 14% | 14% | 14% | ||||||||||||||
| 300207.SZ | 59.4 18.2 | 4,964.4 | 253.2 | 13.9 | 9.5 | 7.4 | 6.9 | 4.9 | 3.5 | 1.3 | 1.0 | 1.6 | 2.4 | 49.1 | 9% | 12% | 19% | |||||||||||||
| Sub-Average | 22.2 | 16.9 | 13.3 | 12.6 9.7 | 7.7 | 3.3 | 2.9 | 2.5 | 1.8 | 16% | 20% | 20% | 20% | 20% | 20% | 20% | 20% | 20% | ||||||||||||
| Global | USD | 414.0 | 138.6 | 122,327.1 | 461.0 | 36.6 | 8.9 | na | na | |||||||||||||||||||||
| Vertiv | VRT.N | 1 | USD | NA | 318.5 | 50,799.9 | 9.6 | 50.2 42.0 | 31.2 | 28.6 20.1 | 36.8 | 25.6 | 19.6 | 20.2 | 13.2 6.5 | 0.0 | 0.0 | na | 53.4 25.3 | 42% 31% | 45% | 38% | 38% | 38% | ||||||
| Flextronic | FLEX.N | NR | 85.0 | 87.1 | 197,668.2 | 253.6 | 33.5 | 23.1 | 18.2 | 12.4 | 9.9 | 9.0 8.4 | 1.1 | 0.0 | 25% | 38% | 38% | 38% | 38% | 38% | 38% | 38% | 38% | 38% | 38% | |||||
| ABB | ABBN.S | 2 | CHF | 30.7 | 28.1 | 24.8 | 20.8 | 18.9 | 9.8 | 7.3 | 1.1 | 1.2 | 14.2 | 43% | 29% | 27% | 27% | 27% | 27% | 27% | ||||||||||
| SiemensEnergy | ENR1n.DE | 2 | EUR | 185.0 | 170.4 | 167,849.8 | 507.8 | 38.1 | 26.0 | 19.3 | 22.1 15.5 | 11.9 | 14.1 | 12.2 | 9.2 | 1.2 1.7 | 2.3 | 96.2 | 54% | 54% | 54% | 54% | 54% | 54% | 54% | |||||
| Schneider Electric | SCHN.PA | 1 | EUR | 340.0 | 278.4 | 183,718.3 | 308.4 | 26.6 | 23.3 | 18.4 | 16.2 | 5.2 | 4.6 | 1.6 | 1.7 | 1.9 | 21.9 | 22% | 23% | 23% | 23% | 23% | 23% | 23% | 23% | |||||
| Eaton | ETN.N | 1 | USD | 471.0 | 413.4 | 274.1 | 31.1 | 27.2 | 20.6 23.8 | 22.6 | 20.2 | 14.1 | 18.2 | 7.3 6.8 | 5.9 | 6.1 | 1.0 | 1.1 | 21% | 15.5 | 1.1 | 21% | 24% | 25% | ||||||
| EmersonElectric | EMR.N | 1 | USD | 174.0 | 141.6 | 160,531.0 79,287.8 | 118.7 | 21.8 | 19.8 | 17.9 | 16.6 | 14.9 | 13.6 | 21.6 14.0 | 11.9 | 1.6 | 1.6 | 1.6 | 15.8 | 23% | 66% | 56% |
Source: Thomson Reuters, Citi Research, Citi Research Estimates
Figure <. Increasing Aaoption or bbu in Albe
1
Utility
Grid
Prepared for Kevin Lu
Generator
Power distribution
IT Racks
Utility
Grid
Transition Architecture
Mixed architecture:
UPS + rack-level / sidecar BBU
Power distribution
Centralized
3
Utility
Grid
Next Generation Al Datacenter
Utility grid remains the primary power source;
Power distribution
Lightweight upstream
Executive Summary
Generator
C 2026 Citigroun Inc. No redistribution without Citigroun's written permission.
Al Racks
Generator
AI Power Architecture Is Evolving, Making BBU An Increasingly Important Part of Next Gen AIDC
We believe AI infrastructure is entering a new power architecture cycle as rack power density continues to increase. Historically, datacenters relied on centralized UPS systems to provide backup power at the facility level. However, the transition toward rack-scale AI systems such as GB200/300 NVL72, together with the adoption of OCP ORv3 architectures, is moving backup power closer to the load through rack-level or sidecar BBUs.
Compared with centralized UPS, localized battery backup offers faster ridethrough capability, less power conversion losses and greater deployment flexibility. Looking ahead, we believe the commercialization of HVDC power architecture would further strengthen BBU's strategic importance, as battery backup power becomes increasingly integrated into rack-level power delivery. As AI rack power moves from today's 100-150kW toward several hundred kW in future platforms, we believe BBU is evolving from an optional component into a core element of AI power infrastructure.
© 2026 Citigroup Inc. No redistribution without Citigroup's written permission.
Source: Citi Research
Centralized
UPS
BBU
BBU
BBU
Figure s. MvDe rower Architecture
Facility
Generator
Transformer
Utility MV Grid
10 kVac ~ 33 kVac
Source• Delta
Prepared for Kevin Lu
ATS
400 / 480 Vac
UPS
PDU
Rack
Grid-to-Chip HVDC Power Solution
HVDC
(800 Vdc)
Site Power Rack
(Optional: BBU, PCS)
HVDC (800 Vdc)
BBU & PCS Rack
Optional Path
Figure 3. HVDC Power Architecture
We Expect BBU Content Value and Penetration to Rise Meaningfully
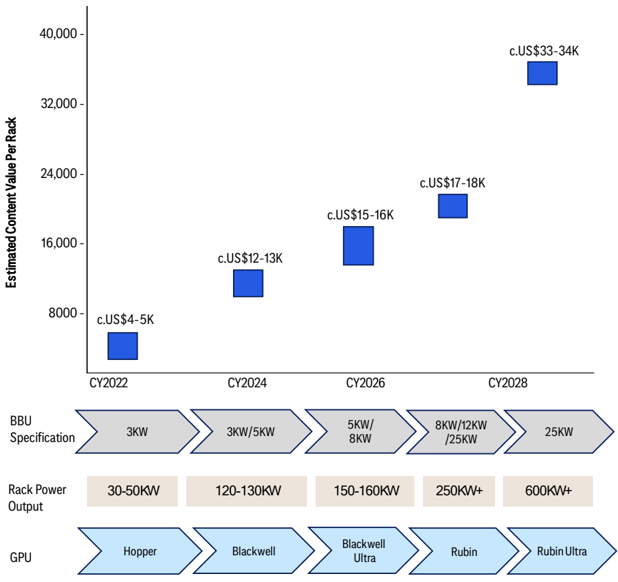
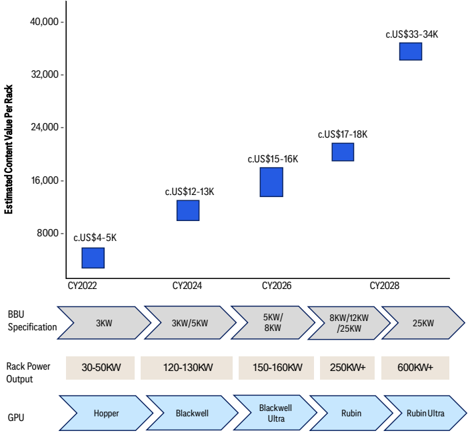
We believe the BBU market benefits from two growth drivers - higher content value per rack and broader industry adoption. Based on our bottom-up framework, we estimate BBU content value increases from c.US$15-16K per GB300 rack today to US$17-18K for Rubin, and could exceed US$33K under Rubin Ultra as higherpower battery systems become necessary.
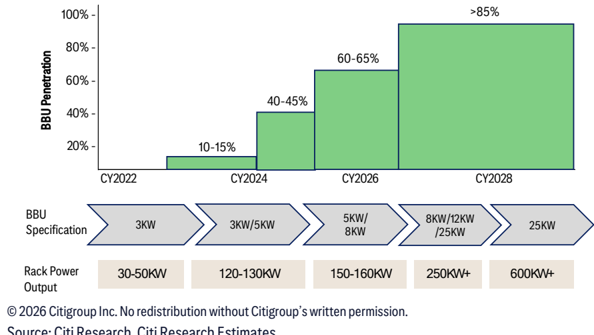
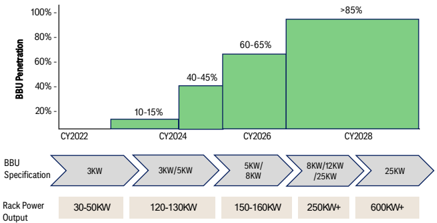
We also estimate BBU penetration in AI racks to rise from 40-45% in 2025 to >85% in 2027E, supported by increasing rack power density, broader adoption of rack-scale architectures, and the migration toward HVDC power distribution. We believe this combination of rising content value and penetration creates a multiyear structural growth opportunity for the BBU ecosystem.
SST
Solid State
Transformer
Chip: 0.65 Vdc
Sever
Prepared for Kevin Lu
Figure 4. Estimated Content Value Per Rack by Generation
© 2026 Citigroup Inc. No redistribution without Citigroup's written permission.
Source: Citi Research, Citi Research Estimates
Figure 5. BBU Penetration Based on Our Estimates
© 2026 Citigroup Inc. No redistribution without Citigroup's written permission.
Source: Citi Research, Citi Research Estimates
Initiate Dynapack (3211.TWO) at Buy with TP of NT$800
We initiate coverage of Dynapack with a Buy rating and a TP of NT$800, as we view it as one of the most direct beneficiaries of the structural expansion in the BBU market. We expect the company to benefit from accelerating BBU adoption, rising content value and improving product mix, supported by its expertise in battery
Prepared for Kevin Lu pack manufacturing, and close partnerships with leading PSU suppliers. We forecast 34% sales CAGR and 60% earnings CAGR over 2025-2028E, driven by rapid growth in non-IT BBU products and continued margin expansion.
Our target price is based on 32x 2027E P/E, which we assign a 0.5x PEG to our 66% earnings CAGR in 2025-2027E, benchmarked to the 2027E PEG of Delta, its major PSU partner. We value Dynapack based on 2027E target P/E as we think 2027E would better reflect Dynapack's earnings power following capacity expansion and increasing exposure to higher-value BBU products.
Figure 6. Earnings Estimate vs. BBG
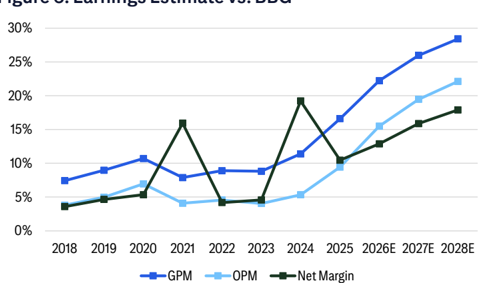
© 2026 Citigroup Inc. No redistribution without Citigroup's written permission.
Source: Company Reports, Citi Research, Citi Research Estimates
Figure 8. Dynapack: Forward P/E vs. Earnings Growth
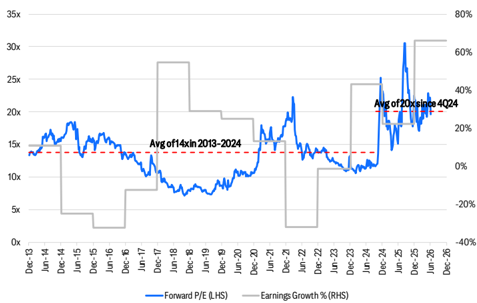
© 2026 Citigroup Inc. No redistribution without Citigroup's written permission. Source: Thomson Reuters, Citi Research, Citi Research Estimates
Figure 7. Dynapack: Earnings and YoY
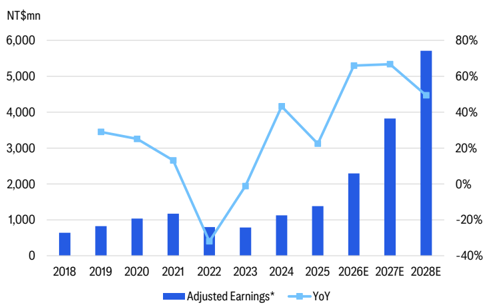
© 2026 Citigroup Inc. No redistribution without Citigroup's written permission.
*Adjusted earnings exclude non-operating gains from real estate disposal in 2021 and 2024.
Source: Company Reports, Citi Research, Citi Research Estimates
Figure 9. Peer Comp: Forward P/E vs. Earnings CAGR
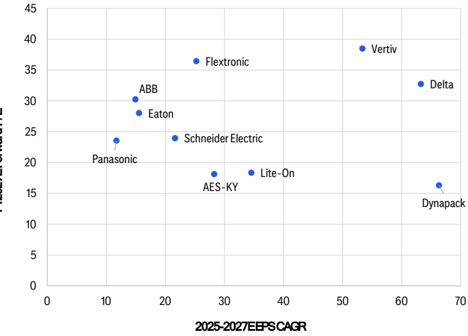
© 2026 Citigroup Inc. No redistribution without Citigroup's written permission. Source: Thomson Reuters, Citi Research, Citi Research Estimates
Prepared for Kevin Lu
Why We Prefer Dynapack over AES
While AES remains the dominant BBU supplier given its scale, customer relationships, and technology leadership, we believe Dynapack offers a more attractive risk-reward profile at the current stage of the AI infrastructure investment cycle, as its earnings remain in the early phase of a multi-year growth and margin expansion story.
We forecast 34% sales CAGR over 2025-2028E for Dynapack vs. AES's 24% sales CAGR, driven by accelerating BBU shipments and higher power BBU product ramp-ups; we estimate 60% earnings CAGR over 2025-2028E for Dynapack vs. AES's 27% driven by product mix improvement and stronger op leverage.
| Figure 10.Dynapackvs.AES | Dynapack 3211.TWO | |
|---|---|---|
| 6781.TW | ||
| Earnings(NT$mn)in2025 | 3,263 | 1,382 |
| GroupSales(NT$mn)in2025 | 16,001 | 13,218 |
| BBUSales(NT$mn) | 10,798 | 4,626 |
| BBUSales% | 67% | 35% |
| GPM(2025/2026E/2027E) | 35.9%/ 36.3%/36.9% | 16.6%/ 22.2%/26.0% |
| OPM(2025/2026E/2027E) | 24.2%/ 24.5%/25.8% | 9.4%/ 15.5%/ 19.5% |
| NM(2025/2026E/2027E) | 20.4%/ 20.9%/ 21.6% | 10.5%/ 12.9%/ 15.9% |
| SalesCAGRin2025-2028E | 24% | 34% |
| EarningsCAGRin2025-2028E | 27% | 60% |
| ForwardP/Eonour2027EEPS | 20.0x | 16.0x |
| BusinessModel | Direct engagement withCSPs PartnershipwithPSUs | PartnershipwithPSUs |
| MajorCSPCustomers | AWS | AWS,Meta |
| BBUProductsin2026 | 3-5kWmostly | 3-5kWmostly,8&12kWin4Q26E |
| HVDCBBUSchedule | 1H27 | 1H27 |
| CapacityExpansion | China,Vietnam | Taiwan,Thailand |
© 2026 Citigroup Inc. No redistribution without Citigroup's written permission.
Source: Citi Research, Citi Research Estimates
Dynapack - Our 26E/27E EPS Estimates Are 17%/21% Higher Than BBG
Our earnings estimates for Dynapack are 17%/21% higher than BBG consensus for 2026E/2027E as we see stronger sales upside to 2H26E and 2027E reflecting the 8kW & 12kW BBU product ramp starting from 4Q26E together with the sustained strong demand for existing 3 kW & 5kW BBU products.
Prepared for Kevin Lu
Figure 11. Dynapack: Our Earnings Estimates vs. BBG
| 2026E | 2026E | 2026E | 2027E | 2027E | 2027E | |
|---|---|---|---|---|---|---|
| NT$ mn | Citi | BBG | Chg | Citi | BBG | Chg |
| Revenue | 17,803 | 16,405 | 9% | 24,072 | 21,543 | 12% |
| Gross profit | 3,956 | 3,477 | 14% | 6,250 | 5,232 | 19% |
| Operatingprofit | 2,759 | 2,390 | 15% | 4,685 | 3,822 | 23% |
| Pre-tax profit | 2,824 | 2,493 | 13% | 4,720 | 4,021 | 17% |
| Net profit | 2,293 | 1,985 | 15% | 3,822 | 3,209 | 19% |
| Basic EPS(NT$) | 15.00 | 12.84 | 17% | 25.00 | 20.74 | 21% |
| Ratio | ||||||
| Gross margin (%) | 22.2 | 21.2 | 1.0 | 26.0 | 24.3 | 1.7 |
| OPEXto Sales ratio (%) | (6.7) | (6.6) | -0.1 | (6.5) | (6.5) | 0.0 |
| Operatingmargin (%) | 15.5 | 14.6 | 0.9 | 19.5 | 17.7 | 1.7 |
| Net margin (%) | 12.9 | 12.1 | 0.8 | 15.9 | 14.9 | 1.0 |
© 2026 Citigroup Inc. No redistribution without Citigroup's written permission.
Source: Citi Research, Citi Research Estimates, Bloomberg
Figure 14. Increasing Adoption or bbu in Albe
1
Utility
Grid
Prepared for Kevin Lu
Generator
Power distribution
IT Racks
Utility
Grid
Transition Architecture
Mixed architecture:
UPS + rack-level / sidecar BBU
Power distribution
Centralized
3
Utility
Grid
Next Generation Al Datacenter
Utility grid remains the primary power source;
Power distribution
Lightweight upstream
BBU: Powering Next Gen AI Racks
Generator
@ 2026 Citioroun Inc. No redistribution without Citjoroun's written nermission.
Al Racks
Generator
High-density Al Racks
From Centralized UPS to Distributed Rack-Level Backup
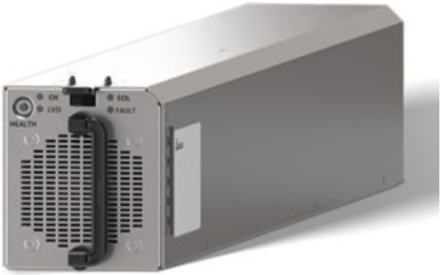
BBU, short for battery backup unit, is a rack-level or system-level energy storage module designed to provide short-duration backup power when grid/UPS (undisrupted power supply) is interrupted, unstable or experiencing voltage dips.
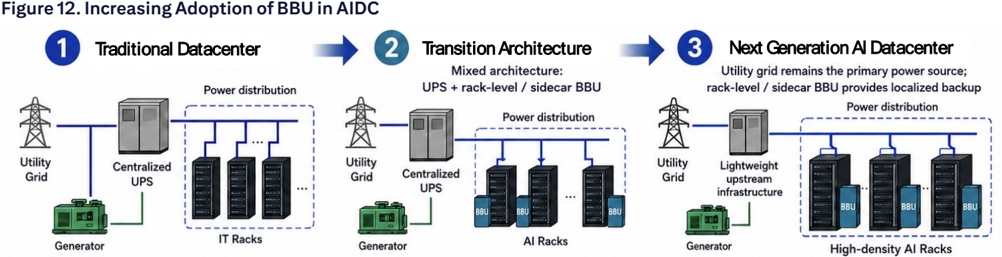
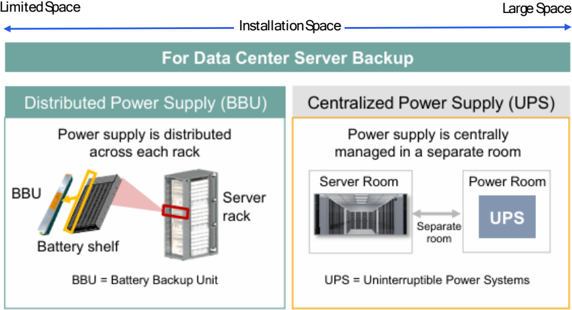
In traditional datacenters, backup power is mostly handled at the facility level through centralized UPS systems and generators; however, as datacenters move toward higher rack power density, the limitation of centralized UPS - including space requirements, power conversion losses, and low flexibility are driving a gradual shift toward a mixed architecture combining UPS and rack-level or sidecar BBU.
As AI racks become much more power-dense, power stability becomes increasingly critical. A short power interruption could disrupt high-value GPU workloads, so backup power needs to sit closer to the rack. This thus makes BBU an important component in next-generation AI datacenters, helping ensure stable and continuous power delivery.
Its value is not necessarily to run the rack for hours, but to bridge short outrages, ride through grid fluctuations, and to protect the rack while upstream UPS, generator, or power-management systems respond.
The BBU content value should scale with AI rack power density - the more powerhungry the rack becomes, the more important localized power backup, and energy management capability become, making BBU a structurally more important part of next generation AIDC infrastructure.
© 2026 Citigroup Inc. No redistribution without Citigroup's written permission.
Source: Citi Research
Centralized
UPS
Figure 14. 3KW BBU
Power supply is distributed across each rack
BBU
Battery shelf
BBU = Battery Backup Unit
Source: Delta
Figure 14. 3kW BBU
Source: Delta
Server rack
Prepared for Kevin Lu
Installation Space
Figure 15. BBU in A Power Rack
800 VDC
Centralized Power Supply (UPS)
Power supply is centrally managed in a separate room
Server Room
Power Room
Figure 13. BBU Is More Ideal for Close-to-Load Backup Power Support
room
UPS = Uninterruptible Power Systems
BBU
© 2026 Citigroup Inc. No redistribution without Citigroup's written permission.
Source: Panasonic, Citi Research
Figure 15. BBU in A Power Rack
Source: Citi Research
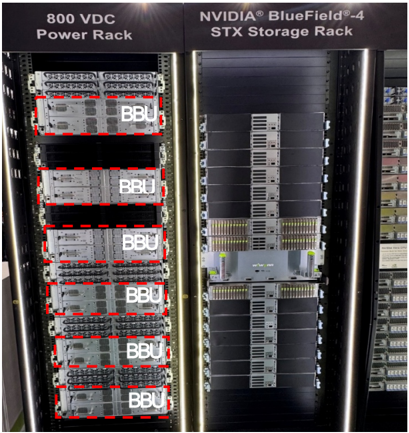
Historically, datacenters have relied heavily on centralized UPS as the main backup power system during outages. However, as AI datacenters move toward higher rack power density, the limitations of centralized UPS - including space requirements, power conversion losses, and lower flexibility are driving a gradual shift toward a mixed architecture combining UPS and rack-level or sidecar BBU. By placing backup power closer to the load - either in-rack or in a sidecar/power rack - BBU can provide short-duration ride-through power with lower distribution complexity and better efficiency.
Over time, BBU penetration could increase as backup power becomes more distributed. That said, we believe UPS is unlikely to disappear entirely, as it will still
Power Rack
BBI
NVIDIA® BlueField®-4
STX Storage Rack
Figure 16. BBU vs. UPs Comparison
Typical Architecture
Battery Type
Weight
Expected Life
Physical Footprint
Power Path
Conversion Efficiency
Response Time
Backup Duration
Role in Al Datacenters
@ 2026 Citioroun Ine No redistribution without Citioroun's written nermission.
UPS (Uninterruptible Power Supply)
facility level
Lead-acid batteries
Heavier be needed to protect upstream power infrastructure, cooling systems, networking and other non-rack critical loads.
Larger; require dedicated space for UPS cabinets level, in-rack, power rack, or sidecar
Lithium-ion batteries
Lighter
5-10 years
Smaller and more modular
| Figure16.BBUvs.UPSComparison | Figure16.BBUvs.UPSComparison | Figure16.BBUvs.UPSComparison |
|---|---|---|
Prepared for Kevin Lu
Rack-Scale Architectures Are Driving Broader BBU Adoption
BBU is not a formally mandatory component in every GB200/GB300 deployment based on public NVIDIA specifications. However, given the rack-scale power architecture of NVL72 systems and the growing adoption of OCP ORv3 (short for 'Open Compute Project Open Rack Standard v3') power shelves and BBU shelves, we believe BBU is increasingly becoming a standard component for high-density AI racks.
In NVIDIA'S NVL architecture, GB200/GB300 NVL72 is designed as a rack-scale system rather than a server-level architecture. This means power delivery, cooling and backup power need to be considered at the rack level, not merely at the individual server level.
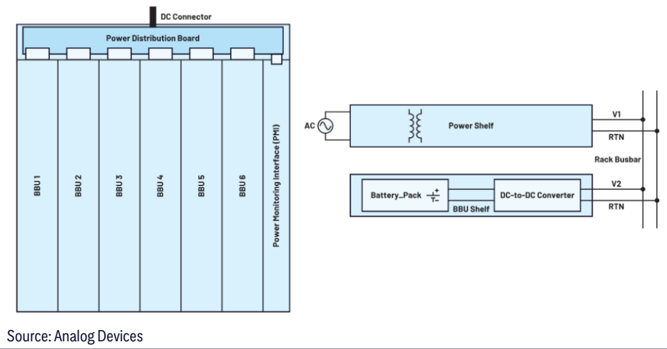
This is also consistent with the direction of OCP ORv3, an open-source datacenter rack architecture. Under the OCP ORv3 BBU specification, the BBU is designed to fit into a BBU shelf that forms part of the rack, supplying DC power to system loads during power outages. See the original article for the OCP ORV3 BBU Reference Design.
Figure 1%. BBU Shelf Contiguration in An OCP ORVS Architecture
DC Connector
BBU 4
BBU 5
BBU 1
BBU 2
BBU 3
Courco. Analno Mouicac
Prepared for Kevin Lu
BBU 6
Power Monitoring Interface (PMI)
Battery_Pack #
Power Shelf
VI
RTN
Rack Busbar
Figure 17. BBU Shelf Configuration in An OCP ORV3 Architecture
DC-to-DC Converter
How Would HVDC Architecture Change The Landscape of BBU?
HVDC is emerging as the next-generation AIDC power architecture because lowvoltage DC systems are reaching practical limits as AI rack power density rises. At 48V/54V, higher rack power requires much higher current, leading to thinker copper busbars, heavier cables, greater heat, higher power loss and less room for compute hardware. According to Ohm's Law (Power (P) = Voltage (V) x Current (I)), by distributing power at higher voltage, such as 800VDC, HVDC lowers current for the same power load, improving efficiency, reducing copper usage and cables, and lowering thermal pressure. It enables more centralized modular power designs, making it better suited for increasing power-hungry AI racks. Instead of being installed directly inside the IT rack, backup power could move into a dedicated power rack or sidecar (i.e. a centralized HVDC power cabinet) so as to free up more space for GPUs and other IT hardware.
Under 800VDC architecture, BBU becomes part of a more complex high-voltage power delivery system. It needs to support higher voltage, higher discharge power, stricter safety protection, better thermal design, and energy management controllers etc. As a result, BMS (battery management system), high-voltage safety design and system level integration are becoming more important.
We believe HVDC would raise the value of BBU systems. As AI rack power rises from 100KW+ toward several hundred kW in future platforms, backup power requirements should also increase. Higher-power racks require greater battery capacity, higher discharge-rate capacity and centralized system that can support multiple racks.
This means BBU may evolve from a simple battery module into a higher-value subsystem that include battery modules, DC/DC conversion, protection circuits and thermal management etc.
To conclude, we believe the shift toward HVDC architecture would increase BBU content value as it makes backup power more technically demanding (higher voltage, higher discharge power, stricter safety protection, and tighter integration with the overall power system) and potentially more valuable as AI racks become increasingly power-dense.
Figure 1o. MvDe rower Architecture
Grid: 33k Vac
Facility
Figure 18. HVDC Power Architecture
Transformer
888
Utility MV Grid
10 kVac ~ 33 kVac
Sourco- Detla
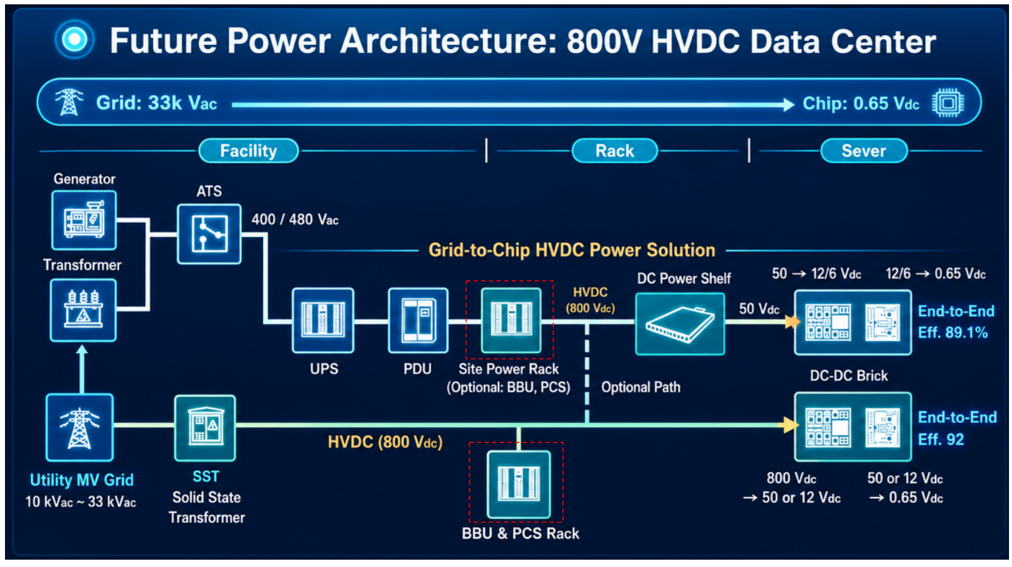
Source: Detla
Prepared for Kevin Lu
Rack
Chip: 0.65 Vdc
Sever
Prepared for Kevin Lu
A Closer Look at BBU Supply Chain
BBU Supply Chain
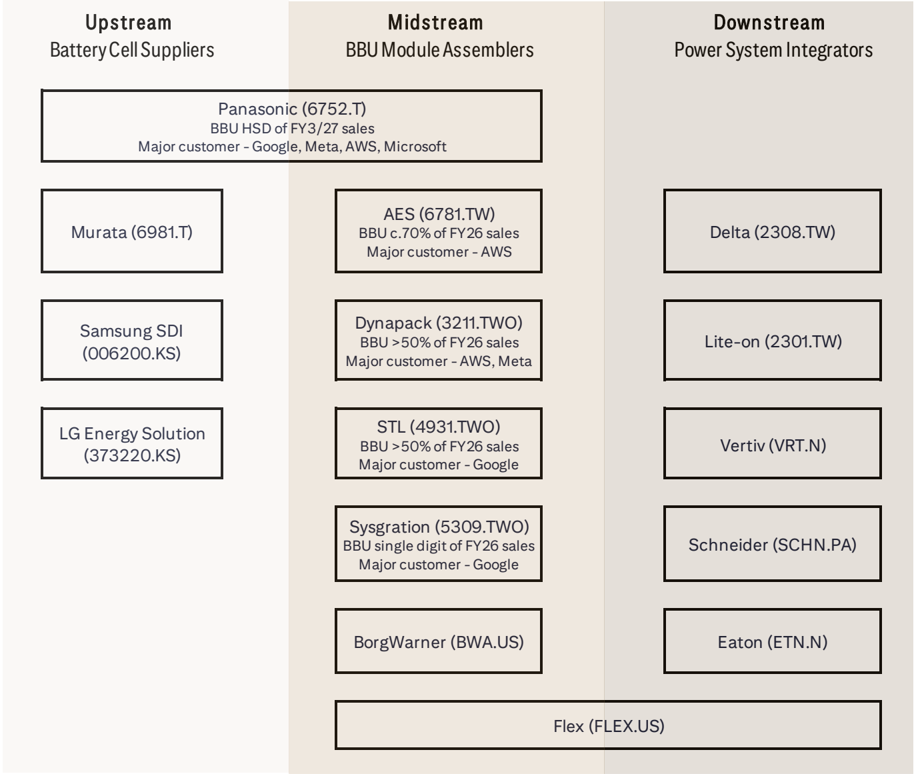
The BBU supply chain can be divided into three layers - upstream battery cell suppliers, midstream BBU module makers, and downstream power system integrators.
Upstream layer is the cell suppliers who provide the core battery cells, the building blocks of the BBU systems. In AI datacenters, where power interruption tolerance is extremely low, CSPs and system integrators tend to prioritize proven cell suppliers with strong safety track records, stable supply and consistent product quality.
- n Key players include Panasonic (6752.T; Buy-rated, covered by Masahiro Shibano), Murata (6981.T; Buy-rated, covered by Takayuki Naito), Samsung SDI (006400.KS; Buy-rated, covered by Peter Lee), LG Energy Solution (373220.KS; Buy-rated; covered by Oscar Yee), and other battery cell suppliers. Panasonic also engages in making BBU packs and selling directly to CSPs.
Midstream layer consists of the BBU module makers. These companies purchase battery cells from battery cell suppliers and assemble them into battery backup modules that can be used at rack, sidecar or system level. Their value add is not limited to mechanical assembly but they are responsible for battery pack design, battery management system integration, thermal design, safety protection and communications with the rack-level power system. The key technical requirements include fast discharge response, high power density, cell balancing, fault detection and compliance with safety certification standards (such as UL9540A).
We believe as AI rack power density continues to rise, the role of BBU module makers have become more important because the BBU is increasingly tied to the overall power architecture rather than being a simple backup component.
- n Key players include AES (6781.TW; Buy-rated), Dynapack (3211.TWO; Buy-rated), STL (4931.TWO; not covered), Sysgration (5309.TWO; not covered), BorgWarner (BWA.US; not covered), and Flex (FLEX.US; not covered). Player such as Flex also engage in downstream power system level integrations.
Downstream layer is mainly composed of PSU suppliers. These companies integrate BBU modules with broader rack-level power solutions, including power shelves, rectifiers, power distribution units etc. PSU integrators influence platform adoption and design-in opportunities. For BBU module makers, partnering with PSU suppliers can provide easier access to major AI server platforms and cloud customers.
- n Key players include Delta (2308.TW; Buy-rated, covered by Laura Chen), Lite-on (2301.TW; not covered), Vertiv (VRT.N; Buy-rated, covered by Andrew Kaplowitz), Flex, Schneider (SCHN.PA; Buy-rated, covered by Martin Wilkie) and Eaton (ETN.N; Buy-rated, covered by Andrew Kaplowitz).
Prepared for Kevin Lu
Figure 19. BBU Supply Chain at A Glance
Source: Citi Research
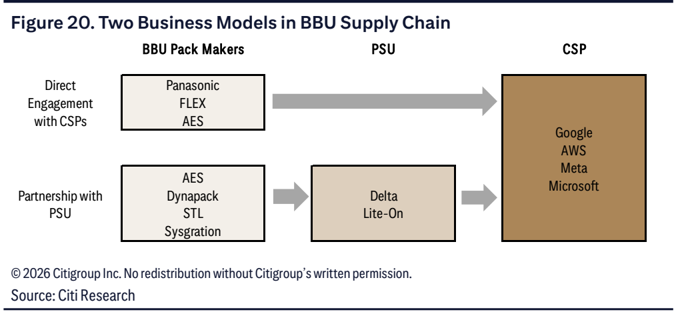
Two Business Models in the BBU Supply Chain
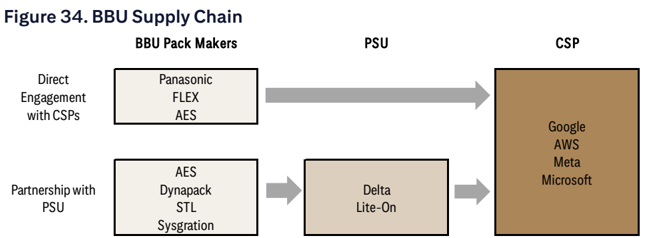
1 st model - Direct engagement with CSPs (Panasonic, Flex, and AES)
BBU suppliers work closely with CSPs on system-level battery design, performance requirement, safety standards and rack-level integration. In this business model, BBU suppliers get involved earlier in the design cycle, helping CSPs customize the BBU architecture based on power density, backup time and thermal constraints etc. This creates a tighter relationship with the CSPs and likely higher customer stickiness.
In this model, BBU suppliers can capture more strategic value because they work closer with the end customers and may have better visibility into next generation rack designs.
Prepared for Kevin Lu
2 nd model - Partnership with power supply unit ('PSU') providers (Dynapack, STL)
In this structure, the PSU suppliers (such as Delta and Liteon) play the role of system integrators, combining power shelves, control systems, power management software, and BBU modules into a more complete rack-level power solution. The BBU suppliers provide the battery module and battery management system, while the PSU providers handle broader integration with the rack or data center power architecture.
In this model, BBU suppliers can benefit from the PSU vendors' existing customer access, integration capability and scale.
Prepared for Kevin Lu
BBU: Rising Content Value and Penetration As Power Density Further Accelerates
Rising Content Value As Power Density Further Rises
We estimate BBU content value in an AI rack by using a module-based approach. The calculation is based on three key assumptions: rack-level power requirement, BBU specification, and redundancy configuration (we assume 5+1 redundancy structure).
As an example of calculating BBU content value - assuming a 120KW AI rack and a 3KW BBU module, the rack would require at least 40 BBU modules (120KW/3KW) to support the rack's power load during a backup event and assuming the system requires 5+1 redundancy for the buffer i.e.. 5 BBU units to support the target load with 1 additional redundant unit included for fault tolerance. Thus, we estimate a 120KW AI rack would need ~48 BBU modules (40x6/5). Based on an estimated 3KW BBU pack ASP of c.US$270, this implies BBU content value of c.US$13K for a 120KW AI rack.
Based on this framework, we expect BBU content value to increase meaningfully as AI rack power density rises. We estimate BBU content value to be c.US$15-16K for current GB300 NVL72 rack which requires ~38 5KW BBU packs (assuming 5KW BBU ASP US$400), and US$17-18K for Rubin generation where rack power consumption is up to >250KW. See Figure 21. Estimated Content Value Per Rack by Generation.
For Rubin Ultra, rack power could reach 600KW, representing a step-change in AI rack power density. At this power level, lower-power BBU modules would become impractical due to the large number of modules required. We hence assume the adoption of 25KW BBU module for Rubin Ultra rack. Using a 25KW BBU ASP of c.US$1200 per pack, a 600KW rack would require c.29 BBU modules, implying BBU content value to be US$33-34K per rack.
Overall, we expect BBU content value per AI rack to increase from current US$1516K in BlackWell generation to US$33-35K in Rubin Ultra, driven primarily by rising rack power density.
Prepared for Kevin Lu
Figure 21. Estimated Content Value Per Rack by Generation
© 2026 Citigroup Inc. No redistribution without Citigroup's written permission.
Source: Citi Research, Citi Research Estimates
Prepared for Kevin Lu
Rising Penetration in BBU Adoption Driven by Higher Power Density
We estimate BBU penetration in AI racks would rise from 10-15% in 2023-2024 to 40-45% in 2025, 60-65% in 2026, >85% in 2027. This estimate is based on the evolution of AI rack architecture along with our industry checks, the transition from traditional server racks to rack-scale systems such as GB200/300 NVL72, and the growing adoption of OCP ORv3 power architecture.
- n 2023-2024 (10-15% of penetration) early adoption stage
Most AI infrastructure deployed during this period was still based on H100/200class system and more traditional data center power architecture. Backup power was generally handled at the facility level through centralized UPS systems rather than distributed at the rack level.
- n 2025 (40-45% of penetration) rising with GB200 NVL72
The key change is GB200 NVL72 is a rack-scale system that integrates multiple compute trays, switch trays, liquid cooling, power shelves and high speed NVLink connectivity into a single rack-level platform, which changes the way power backup needs to be designed. As rack power moves toward 100KW+ range, BBU, which is more space saving, has less distribution losses and higher flexibility, becomes more ideal to support short-duration backup power closer to the IT load. We thus believe BBU adoption rate should start rising meaningfully in particular among hyperscalers who adopt OCP ORv3-style racks, pursuing higher power efficiency or want to reduce reliance on large centralized UPS systems.
- n 2026 (60-65% of penetration) broader adoption with GB200/300 and ORv3 architecture
Few drivers in this stage include 1) AI rack power density continues to rise. Higher rack power makes short-duration ride through protection more important. 2) OCP ORv3 defines a BBU shelf architecture, with BBU shelf connected to the rack-level DC bus. We believe large CSPs with strong in-house infrastructure teams would adopt BBU more aggressively.
- n 2027 (>85%) BBU becomes a must for HVDC AI racks
We believe the transition toward HVDC power architecture could further accelerate BBU adoption. Under HVDC architecture, the datacenter increasingly distributes high-voltage DC power directly to the rack. Once the rack is operating on a DC backbone, it becomes more natural to connect battery-based backup power directly to the DC bus. Thie reduces the need for multiple ACDC and DCAC conversion stage and improves the efficiency of short-duration backup power delivery. We thus expect a growing share of high-density AI racks will adopt either in-rack BBU shelves or sidecar/power rack BBU.
Prepared for Kevin Lu
Figure 22. BBU Penetration Based on Our Estimates
Source: Citi Research, Citi Research Estimates
Prepared for Kevin Lu
Company Section
Prepared for Kevin Lu
Dynapack International (3211.TWO)
Buy | TP NT$800.00 | Price NT$422.50 (06 Jul 26 15:00)
Beneficiary of strong AIDC BBU demand -We believe Dynapack is well positioned to capture rising BBU demand as AI server racks move to higher power density. As rack-level power consumption moves toward >100kW and future platforms require even higher power density, datacenters need faster and more localized backup power solutions. We expect BBU adoption to rise with OCP/HVDC power architecture evolution, while higher rack power should also drive higher BBU content value per rack. We forecast sales to rise 34% CAGR in 2025-2028E, boosted by strong non-IT sales +74% CAGR.
Margin expansion from rising non-IT mix -Dynapack's legacy IT battery
business is mature and faces pricing pressure. We estimate IT battery pack GPM at only 5-10%. By contrast, BBU products require customized design, higher reliability standards, stricter safety validations and closer collaboration with PSU operators and CSPs. We estimate BBU GPM at 30-35%, materially above legacy IT products. As Dynapack shifts toward higher margin BBU products, we forecast GPM to expand from 16.6% in 2025 to 22.2% in 2026E, 26.0% in 2027E and 28.4% in 2028E. With robust GPM expansion and strong op leverage, we forecast Dynapack's earnings to rise 60% CAGR in 2025-2028E.
PSU partnerships broaden CSP exposure -We think Dynapack's partnership model with PSU operators is a key strategic advantage. PSU operators typically control power shelves, rack level power architecture and system level customer interface; whereas Dynapack focuses on the battery pack layer where it has strong knowhow in battery design, BMS management and customized manufacturing. By working with multiple PSU operators, Dynapack can indirectly access a broader CSP and AIDC customer base, reducing reliance on any single CSP or platform.
Initiate at Buy with TP NT$800 -We assign a 32x target P/E to our 2027E EPS of NT$25 to derive a target price of NT$800. We value Dynapack based on 2027E target P/E as we believe 2027E better reflects its earnings power after BBU capacity expansion. Our target P/E of 32x is based on our forecast EPS CAGR of 66% in 2025-2027E and a PEG of 0.5x, which we benchmark against Delta, its major PSU partner, as we expect Dynapack to grow alongside Delta.
Earnings Summary
| Year to 31Dec | Net Profit (NT$M) | DilutedEPS (NT$) | EPSgrowth (%) | P/E (x) | P/B (x) | ROE (%) | Yield (%) |
|---|---|---|---|---|---|---|---|
| 2024A | 2,673 | 17.59 | 236.1 | 23.1 | 5.8 | 28 | 3.1 |
| 2025A | 1,382 | 9.05 | -48.5 | 44.9 | 6.2 | 13.4 | 2.8 |
| 2026E | 2,293 | 15 | 65.7 | 27.1 | 7 | 24.4 | 3 |
| 2027E | 3,822 | 25 | 66.7 | 16.3 | 6.5 | 41.4 | 4.9 |
| 2028E | 5,710 | 37.35 | 49.4 | 10.9 | 5.8 | 56.1 | 7.4 |
Source: Powered by dataCentral
Prepared for Kevin Lu
Dynapack (3211.TWO): Our Investment Thesis
Investment positive #1 - riding on the strong demand of BBU from AIDC buildout, driving structural growth
Dynapack has historically been a notebook and consumer electronic battery-pack supplier, but its product portfolio is increasingly expanding into non-IT applications such as BBU, UPS, ESS, and LEV battery packs. Among these, BBU is the most important structural growth opportunity for Dynapack, making up the majority of its non-IT sales. We estimate BBU sales to contribute 35% of Dynapack's group sales in 2025 and accelerate to 55% of group sales in 2026E.
We believe Dynapack is well positioned to benefit from rising BBU demand driven by AIDC infrastructure buildout. As AI server racks move from traditional lowpower racks to high-density GPU racks, rack level consumption is increasing significantly.
This creates a greater need for localized backup power solutions that can provide immediate power support during grid instability, power transition, or shortduration outages. As indicated in the industry section, unlike traditional centralized UPS systems, BBU can be deployed closer to the server rack or power shelf, enabling faster responses, lower conversion loss, and better compatibility with high-density rack-scale power architectures.
We expect when the rack power is moving towards >150KW levels, BBU is likely to become an increasingly important component in AI rack power architecture, as higher rack power density raises both the absolute amount of backup power required per rack and the fast load transients.
Figure 23. Estimated Content Value Per Rack by Generation Figure 24. BBU Penetration Based on Our Estimates
© 2026 Citigroup Inc. No redistribution without Citigroup's written permission.
Source: Citi Research, Citi Research Estimates
© 2026 Citigroup Inc. No redistribution without Citigroup's written permission. Source: Citi Research, Citi Research Estimates
Prepared for Kevin Lu
For Dynapack, BBU provides a meaningful growth opportunity beyond its mature consumer electronic battery-pack business. Dynapack has long-standing experience in lithium-ion battery pack design, battery management systems, safety certifications, and customized manufacturing.
We think Dynapack's BBU opportunity is not only a volume growth story but also a content value expansion story - as AI rack power rises, the required backup power per rack should increase, suggesting higher BBU content value per rack over time.
Furthermore, we've seen a clear trend that future AI power architecture would shift from centralized UPS toward more distributed BBU deployment at the shelf, rack, or DC busway level, which could structurally lift BBU penetration in AI datacenters.
We believe that as AI rack shipment continues to scale and BBU adoption rises with OCP/HVDC power architecture evolution, Dynapack is poised to benefit from both higher non-IT sales contribution and better product mix.
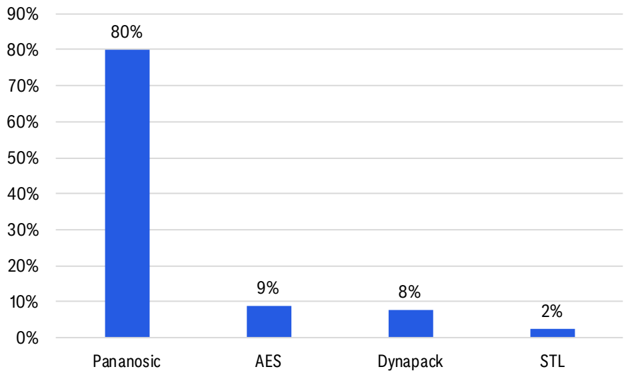
Figure 25. Market Share of BBU Supplier (FY2026E)
© 2026 Citigroup Inc. No redistribution without Citigroup's written permission.
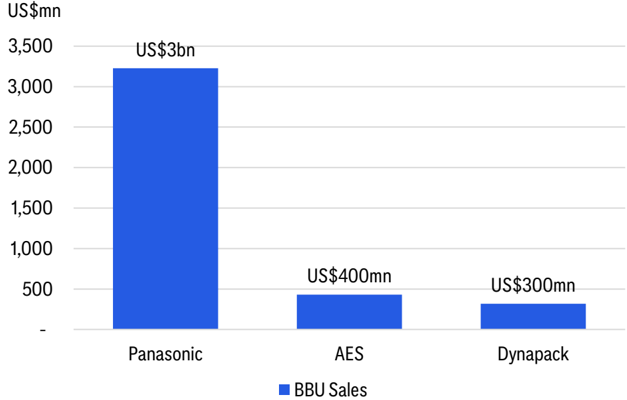
Note: Market share of Panasonic is based on Panasonic's investor presentation. AES, Dynapack and STL market share is based on our estimates.
Source: Panasonic, Citi Research, Citi Research Estimates
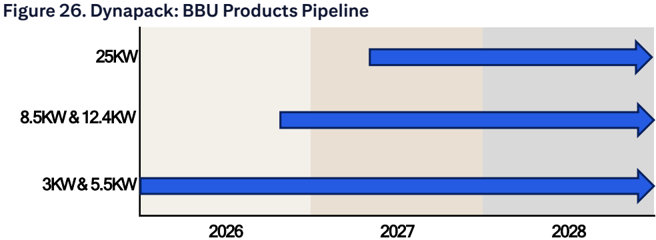
Per Dynapack, the majority of products selling to PSU operators are 3KW and 5.5KW BBU modules in 2026E and they expect to start selling small volume of higher KW products (8.5KW, 12.4KW) in 4Q26E. We expect the products for HVDC (25KW BBU) to begin mass production in 2027E, further fueling the topline growth, in our view.
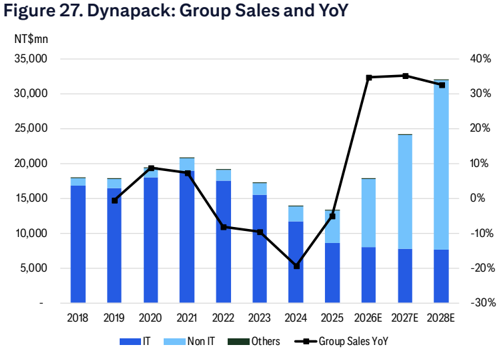
We estimate Dynapack's sales to rise by 34% CAGR in 2025-2028E, boosted by the ongoing ramp-up of higher power BBU products, rising rack power density leading to higher content value and penetration of BBU, and its share gains
Prepared for Kevin Lu
© 2026 Citigroup Inc. No redistribution without Citigroup's written permission. Source: Company Reports, Citi Research
© 2026 Citigroup Inc. No redistribution without Citigroup's written permission. Source: Company Reports, Citi Research, Citi Research Estimates
© 2026 Citigroup Inc. No redistribution without Citigroup's written permission. Source: Company Reports, Citi Research, Citi Research Estimates
What Are Dynapack's Competitive Advantages vs. Other BBU suppliers?
- Strong battery-pack know-how it has a long operating history as a lithium-ion battery-pack maker, specializing in pack design, cell integration, battery management, safety validation, and customized manufacturing.
- Strong partnership with PSU operators unlike Panasonic or AES who rely mostly on direct engagement with a single CSP or a narrow set of end customers, working with PSU companies allows Dynapack to gain access to a broader set of CSPs.
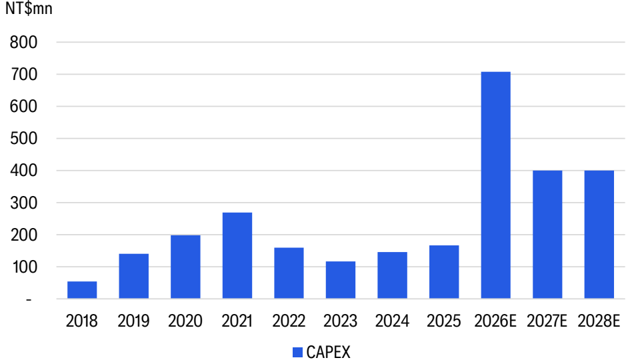
- Faster capacity ramp-up to capture near-term strong BBU demand compared with other BBU suppliers that may need to squeeze new production lines into existing facilities or secure new land and construct new facilities, Dynapack appears to have more flexibility to expand capacity as they have self-owned facility space in Taiwan, which allows them to accelerate capacity addition. The mgmt. expects non-IT capacity to be 2x more by end-2026 vs. end-2025.
Prepared for Kevin Lu
Figure 29. Dynapack: CAPEX Trend. Dynapack Expects CAPEX to be NT$600800mn for 2026E
© 2026 Citigroup Inc. No redistribution without Citigroup's written permission.
Source: Citi Research, Company Reports, Citi Research Estimates
Prepared for Kevin Lu
Investment positive #2 - Intact margin expansion from rising non-IT sales
We expect Dynapack to enjoy intact margin expansion trajectory in the coming years, supported by rising contribution from non-IT products, in particular, BBU. The company's legacy IT battery pack business is mature with more intense pricing pressure from notebook and consumer electronics customers. As a result, we estimate GPM of IT battery pack to be only 5-10%, benchmarked with Dynapack's group GPM in 2016-2023 before BBU started becoming the key sales driver.
In contrast, BBU products are still in an early growth stage and require highly customized designs, higher reliability standards, stricter safety validation, and closer collaboration with PSU operators and CSPs. We estimate BBU GPM to be 30-35%, benchmarked with AES's GPM, materially higher than the legacy IT business. Unlike notebook battery packs, where the market is mature and customers have stronger bargaining power, we believe AIDC BBU is a higher spec product category with a higher entry barrier, supporting better pricing power.
Figure 30. Dynapack: Group GPM 5-10% Before BBU Sales Ramp-up
© 2026 Citigroup Inc. No redistribution without Citigroup's written permission. Source: Company Reports, Citi Research
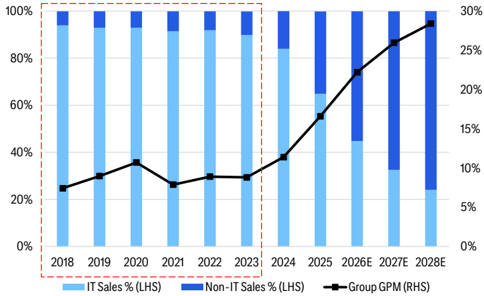
Figure 31. AES: Group GPM 30-40%
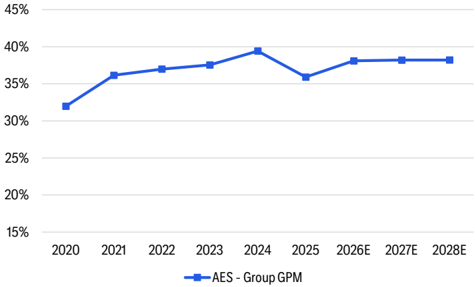
© 2026 Citigroup Inc. No redistribution without Citigroup's written permission. Source: Company Reports, Citi Research
As the company shifts from a revenue mix dominated by low-margin IT business towards a higher share of BBU products carrying higher GPM, blended margin should expand meaningfully even before considering operating leverage.
We also believe higher-kW BBU products would carry higher GPM than lower power BBU modules as it increases product complexity and engineering content, allowing Dynapack to capture higher ASP and better margin.
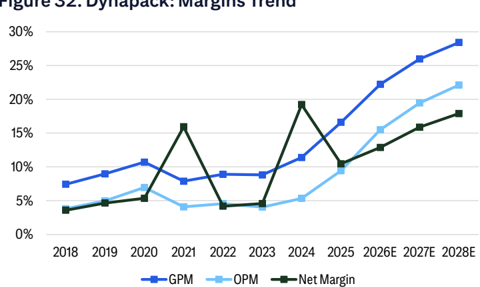
We estimate Dynapack's GPM to reach 22.2% in 2026E, up from 2025's 16.6% and further accelerate to 26.0%/28.4% in 2027E/2028E.
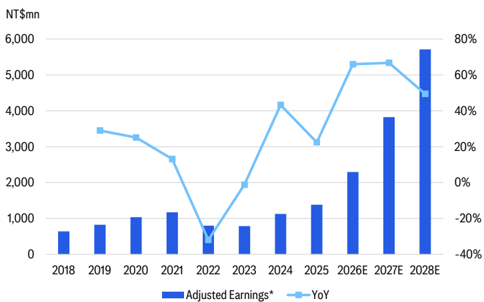
As BBU sales contribution rises, we believe Dynapack's earnings quality should improve through both faster top-line growth and higher profitability. We forecast its group earnings to grow 66% y/y in 2026E, 67% y/y in 2027E and 49% y/y in 2028E respectively.
Prepared for Kevin Lu
Figure 32. Dynapack: Margins Trend
© 2026 Citigroup Inc. No redistribution without Citigroup's written permission.
Source: Company Reports, Citi Research, Citi Research Estimates
Figure 33. Dynapack: Earnings and YoY
© 2026 Citigroup Inc. No redistribution without Citigroup's written permission.
*Adjusted earnings exclude non-operating gains from real estate disposal in 2021 and 2024.
Source: Company Reports, Citi Research, Citi Research Estimates
Prepared for Kevin Lu
Investment positive #3 - Strong Partnership with PSU operators provides access to a broader CSP base
We believe Dynapack's partnership with PSU operators is a key strategic advantage in the AIDC BBU supply chain. Dynapack appears to be positioning itself as a specialized BBU battery pack partner to power supply companies. The model is strategically attractive because PSU operators typically control the power shelf, rack-level power architecture and system level customer interface, while Dynapack can focus on the battery pack where it has stronger know-how in Lithium-ion pack design, BMS, thermal management, safety validations and customized manufacturing.
This partnership model allows Dynapack to gain access to a broader downstream customer base. Major PSU operators usually serve multiple CSPs, ODMs, and AI server programs. By working with more than one PSU customer, Dynapack can participate in multiple end-customer projects, creating a more balanced customer mix over time.
We believe this is especially important in the early stage of the AI BBU market, where rack power architecture is still evolving and customer specifications differ across different generations of architecture. A supplier engaged in a couple of PSU platforms should be better positioned to capture industry-wide BBU adoption than a vendor tied to only one CSP.
We also think PSU operators would have strong incentives to work with specialized BBU pack suppliers instead of fully internalizing the battery-packs as PSU vendors' core strength is power conversion, rectifiers, power shelves, rack-level distribution and system integration. In contrast, BBU pack manufacturing requires a different capability set, including cell matching, battery management, thermal protection, and safety certifications etc. Given the safety sensitivity of lithium-ion batteries inside datacenters, PSUs are likely to prefer qualified BBU partners that can reduce engineering burden and lower certification risks. Whereas for Dynapack, this creates a share gain opportunity as the company can benefit from the scale and customer access of PSU operators, growing with PSUs as BBU adoption rises across AI racks. This complementarity should make the relationship structurally more sustainable, in our view.
As BBU demand accelerates with higher AI rack power density, PSU operators will need suppliers that can provide both engineering customization and volume production. We believe Dynapack's long history in battery-pack manufacturing, customized BBU product development, and aggressive capacity expansion should strengthen its leading position as a preferred partner.
Prepared for Kevin Lu
© 2026 Citigroup Inc. No redistribution without Citigroup's written permission.
Source: Citi Research
Figure 35. BBU FY26 Sales Comparison - Panasonic Is 10x Larger Than Dynapack
© 2026 Citigroup Inc. No redistribution without Citigroup's written permission.
Source: Company Reports, Citi Research, Citi Research Estimates
Prepared for Kevin Lu
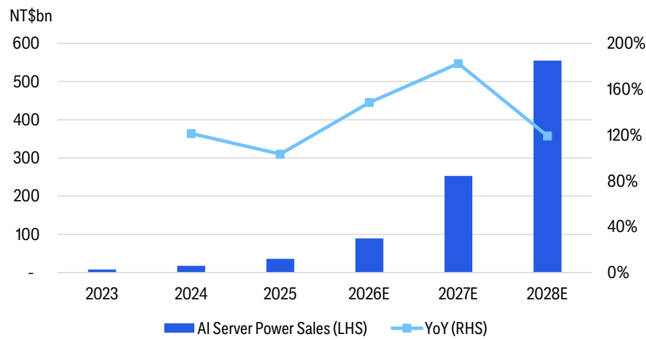
Figure 36. Delta (2308.TW) AI Server Power Sales Estimates
© 2026 Citigroup Inc. No redistribution without Citigroup's written permission. Source: Citi Research, Citi Research Estimates
Would PSU Operators Fully Vertically Integrate into BBU Manufacturing and Compete with Specialized BBU Vendors?
We think the risk is relatively low as BBU requires a very different technical capability set from traditional power conversion. The core advantage of PSU vendors such as Delta and Lite-on lies in rectifiers, power conversion, rack/shelflevel power distribution, and most importantly, system integration. Whereas, BBU pack manufacturing requires deep know-how in lithium-ion cell selection/matching, pack design, BMS, thermal management, safety protection, and reliability validation.
We believe safety is one of the most important barriers - Li-on BBU products must meet strict safety and reliability requirements involving multiple dedicated testing and certification across battery safety standards. For example, UL 9540A, a firetesting method evaluating thermal runaway behavior and fire propagation risk.
Therefore, PSU operators are more likely to retain control of the system architecture and customer interface, while collaborating with qualified BBU vendors such as Dynapack. This allows PSU operators to shorten development cycles, avoid heavy capex and learning curve costs and maintain focus on their higher-value power system integration role.
Prepared for Kevin Lu
Dynapack (3211.TWO): Financial Analysis
Income Statement Analysis
Dynapack's revenue fell over 2022-2025 as weakness in its mature IT batterypack business more than offset the still-early contribution from non-IT products. Net sales fell from NT$19.1bn in 2022 to NT$13.2bn in 2025, implying a 20222025 sales CAGR of -11.5%. This reflects soft notebook demand, pricing pressure in legacy IT battery packs and the fact that BBU/UPS/ESS revenue had not yet reached sufficient scale to offset the IT downturn.
Thanks to the strong BBU demand for AIDC applications, the group quarterly sales had turned to positive growth starting from 3Q25. We forecast revenue growth to accelerate meaningfully from 2026E, driven by the ongoing ramp-up of BBU products for AIDC, rising rack power density leading to higher penetration of BBU, and its share gains. We expect the legacy IT battery pack business to remain mature.
We estimate sales to grow 35% y/y in 2026E, followed by 35% y/y in 2027E and 33% y/y in 2028E, implying a 2025-2028E sales CAGR of 34%.
Figure 37. Dynapack: Our Sales Assumptions
| Revenue Assumptions | 2020 | 2021 | 2022 | 2023 | 2024 | 2025 | 2026E | 2027E | 2028E |
|---|---|---|---|---|---|---|---|---|---|
| Sales | |||||||||
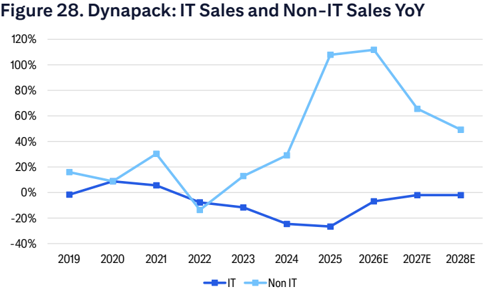
| IT | 17,967 | 18,979 | 17,521 | 15,478 | 11,675 | 8,570 | 7,981 | 7,822 | 7,665 |
| NonIT | 1,354 | 1,765 | 1,526 | 1,723 | 2,226 | 4,626 | 9,797 | 16,223 | 24,207 |
| Others | 27 | 25 | 25 | 29 | 10 | 22 | 25 | 28 | 30 |
| Total | 19,348 | 20,770 | 19,072 | 17,230 | 13,912 | 13,218 | 17,803 | 24,072 | 31,902 |
| YoY% | |||||||||
| IT | 9% | 6% | -8% | -12% | -25% | -27% | -7% | -2% | -2% |
| NonIT | 9% | 30% | -14% | 13% | 29% | 108% | 112% | 66% | 49% |
| Total | 9% | 7% | -8% | -10% | -19% | -5% | 35% | 35% | 33% |
| As % of Sales | |||||||||
| IT | 93% | 91% | 92% | 90% | 84% | 65% | 45% | 32% | 24% |
| NonIT | 7% | 9% | 8% | 10% | 16% | 35% | 55% | 67% | 76% |
| Others | 0% | 0% | 0% | 0% | 0% | 0% | 0% | 0% | 0% |
| Total | 100% | 100% | 100% | 100% | 100% | 100% | 100% | 100% | 100% |
© 2026 Citigroup Inc. No redistribution without Citigroup's written permission.
Source: Company Reports, Citi Research, Citi Research Estimates
Margin expansion is the key financial upside in our forecasts. Dynapack's GPM improved to 16.6% in 2025, up from 2022's 8.9%. This was mainly driven by mix upgrade. We estimate IT battery pack GPM to be only 5-10% given the mature market structure, limited customization and pricing pressure. Whereas, we estimate BBU GPM at 30-35%, supported by higher technical complexity, safety requirements, BMS integration and highly customized design. We expect higher KW BBU products to carry higher margin, as they require more advanced engineering and stricter safety design. We forecast GPM to reach 22.2%/26.0%/28.4% in 2026E/2027E/2028E.
Prepared for Kevin Lu
Figure 38. Dynapack: Our GPM Assumptions
| Gross Profit | 2020 | 2021 | 2022 | 2023 | 2024 | 2025 | 2026E | 2027E | 2028E |
|---|---|---|---|---|---|---|---|---|---|
| IT | 1,671 | 1,148 | 1,151 | 774 | 722 | 694 | 527 | 517 | 506 |
| NonIT | 314 | 353 | 336 | 414 | 601 | 1,497 | 3,427 | 5,731 | 8,552 |
| Others | 85 | 134 | 211 | 330 | 262 | 3 | 2 | 2 | 3 |
| Total Gross Profit | 2,070 | 1,636 | 1,698 | 1,518 | 1,584 | 2,193 | 3,954 | 6,248 | 9,059 |
| IT | 9.3% | 6.1% | 6.6% | 5.0% | 6.2% | 8.1% | 8.1% | 8.1% | 8.1% |
| NonIT | 23.2% | 20.0% | 22.0% | 24.0% | 27.0% | 32.4% | 32.4% | 32.4% | 32.4% |
| Others | 314.6% | 526.5% | 838.7% | 1137.1% | 2501.1% | 11.6% | 11.6% | 11.6% | 11.6% |
| Total GM% | 10.7% | 7.9% | 8.9% | 8.8% | 11.4% | 16.6% | 22.2% | 26.0% | 28.4% |
© 2026 Citigroup Inc. No redistribution without Citigroup's written permission. Source: Company Reports, Citi Research, Citi Research Estimates
While Dynapack will continue to invest in BBU R&D, certification, automation and capacity expansion, we expect higher margin BBU sales growth to more than offset the incremental opex burden. As BBU capacity ramps, scale benefits should become more visible. We forecast OPM to reach 15.5%/19.5%/22.1% in 2026E/2027E/2028E.
All in, we forecast earnings to rise 66%/67%/49% y/y in 2026E/2027E/2028E, implying a 2025-2028E earnings CAGR of 60%, growing much faster than sales CAGR, reflecting the combined effect of BBU volume growth, rising non-IT sales mix, gross margin expansion and strong op leverage.
Prepared for Kevin Lu
Figure 39. Dynapack: Income Statement
| Income Statement (NT$m) | 2022 | 2023 | 2024 | 2025 | 2026E | 2027E | 2028E |
|---|---|---|---|---|---|---|---|
| Net Sales | 19,072 | 17,230 | 13,912 | 13,218 | 17,803 | 24,072 | 31,902 |
| COGS | -17,375 | -15,713 | -12,327 | -11,025 | -13,847 | -17,822 | -22,841 |
| Gross Profit | 1,698 | 1,518 | 1,584 | 2,193 | 3,956 | 6,250 | 9,061 |
| Operating Exp. | -827 | -819 | -841 | -946 | -1,198 | -1,566 | -2,005 |
| Operating Exp.-Promotion | -111 | -123 | -94 | -95 | -123 | -165 | -219 |
| OperatingExp.-ADM | -315 | -322 | -364 | -373 | -460 | -572 | -692 |
| Operating Exp.-R&D | -400 | -374 | -383 | -478 | -615 | -828 | -1,095 |
| Operating income | 871 | 699 | 743 | 1,247 | 2,759 | 4,685 | 7,056 |
| Total non-operating Inc. | 270 | 378 | 2,180 | 553 | 65 | 35 | 15 |
| Net Interest Inc. | 30 | 201 | 221 | 110 | 84 | 84 | 84 |
| Net Investment Inc. | 5 | 5 | 10 | 9 | 0 | 0 | 0 |
| Disposal of FixedAsset | 1 | -3 | 1,930 | -19 | 1 | 0 | 0 |
| Exchange Gain(Loss) | 56 | 145 | -31 | 369 | -388 | 0 | 0 |
| OthersIncome (Loss) | 178 | 30 | 50 | 85 | 368 | -49 | -69 |
| Pre-tax Income | 1,140 | 1,077 | 2,924 | 1,800 | 2,824 | 4,720 | 7,071 |
| Income Tax | -343 | -289 | -251 | -418 | -531 | -897 | -1,361 |
| Net Income | 797 | 788 | 2,673 | 1,382 | 2,293 | 3,822 | 5,710 |
| Extraordinary gain (losses), minority interest | 0 | 0 | 0 | 0 | 0 | 0 | 0 |
| Net profit after extraordinary items | 797 | 788 | 2,673 | 1,382 | 2,293 | 3,822 | 5,710 |
| Adj.wtd.avg.shrs (m) | 150 | 151 | 152 | 153 | 153 | 153 | 153 |
| EPS (NT$) | 5.33 | 5.23 | 17.59 | 9.05 | 15.00 | 25.00 | 37.35 |
| Check | |||||||
| Effective tax rate | -30% | -27% | -9% | -23% | -19% | -19% | -19% |
| Depreciation&Amortization | 326 | 312 | 294 | 290 | 412 | 545 | 721 |
| EBITDA | 1,437 | 1,187 | 2,997 | 1,981 | 3,152 | 5,181 | 7,708 |
| Margins | |||||||
| GrossMargin | 8.9% | 8.8% | 11.4% | 16.6% | 22.2% | 26.0% | 28.4% |
| Operating Margin | 4.6% | 4.1% | 5.3% | 9.4% | 15.5% | 19.5% | 22.1% |
| Pretax Margin | 6.0% | 6.2% | 21.0% | 13.6% | 15.9% | 19.6% | 22.2% |
| Net Margin | 4.2% | 4.6% | 19.2% | 10.5% | 12.9% | 15.9% | 17.9% |
| EBITDA margin | 7.5% | 6.9% | 21.5% | 15.0% | 17.7% | 21.5% | 24.2% |
| OPEX | 4.3% | 4.8% | 6.0% | 7.2% | 6.7% | 6.5% | 6.3% |
| YoY % | |||||||
| Turnover | -8.2% | -9.7% | -19.3% | -5.0% | 34.7% | 35.2% | 32.5% |
| Operating Profits | 2.6% | -19.7% | 6.3% | 67.8% | 121.3% | 69.8% | 50.6% |
| Pretax Profits | -69.7% | -5.6% | 171.5% | -38.4% | 56.8% | 67.1% | 49.8% |
| Net Profits | -75.9% | -1.2% | 239.2% | -48.3% | 65.9% | 66.7% | 49.4% |
| EPS | -76.2% | -1.8% | 236.1% | -48.5% | 65.7% | 66.7% | 49.4% |
| OPEX | 5.0% | -1.0% | 2.7% | 12.5% | 26.5% | 30.8% | 28.1% |
© 2026 Citigroup Inc. No redistribution without Citigroup's written permission.
Source: Company Reports, Citi Research, Citi Research Estimates
Balance Sheet and Cash Flow Analysis
We expect Dynapack's balance sheet to remain healthy through the BBU ramp-up cycle, with the company staying in a net cash position despite higher working capital needs and capacity expansion. Based on our estimate, cash and cash equivalent stay at 20-31% in 2026-2028E vs. 2025's 27%. This provides sufficient liquidity to support BBU capacity expansion, inventory preparation and product development for higher-power BBU products.
Net gearing remains negative throughout our forecast period, indicating that the company maintains a net cash balance. We believe that their capacity expansion is not overly dependent on external financing and the company still has room to fund capacity ramp-up while maintaining balance sheet flexibility.
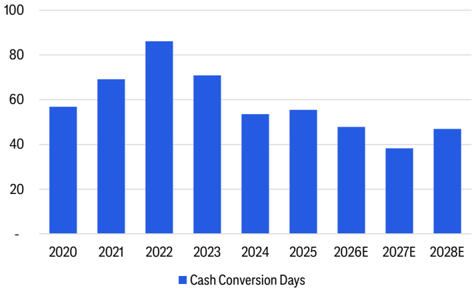
Dynapack's cash conversion lowered to 55 days in 2025, down from 2022's 86 days. We forecast it to further improve to 48 days in 2026E and 38 days in 2027E. This improvement is mainly supported by stronger payable days and better inventory discipline.
Prepared for Kevin Lu
Figure 40. Dynapack: Cash and Cash Equivalent As % of Total Asset, and Payout Ratio
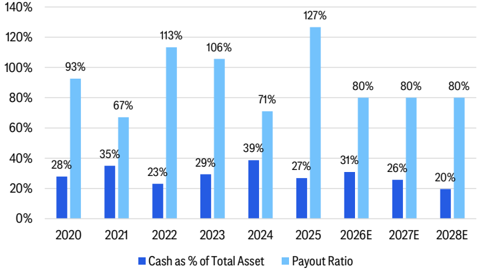
Figure 41. Dynapack: Cash Conversion Cycle
© 2026 Citigroup Inc. No redistribution without Citigroup's written permission. Source: Company Reports, Citi Research, Citi Research Estimates
© 2026 Citigroup Inc. No redistribution without Citigroup's written permission. Source: Company Reports, Citi Research, Citi Research Estimates
Figure 42. Dynapack: Balance Sheet
| Balance Sheet (NT$mn) | 2022 | 2023 | 2024 | 2025 | 2026E | 2027E | 2028E |
|---|---|---|---|---|---|---|---|
| Cash | 3,058 | 1,990 | 2,539 | 3,438 | 2,643 | 1,966 | 1,159 |
| Bank Deposit (over 3mths) | 942 | 2,788 | 3,791 | 747 | 3,092 | 3,092 | 3,092 |
| AR/NR(reported) | 5,020 | 4,058 | 3,100 | 3,545 | 3,802 | 5,477 | 8,994 |
| Inventories | 2,410 | 1,529 | 1,046 | 1,842 | 2,552 | 2,813 | 3,333 |
| Others | 635 | 505 | 811 | 396 | 427 | 427 | 427 |
| Current Assets | 12,065 | 10,869 | 11,286 | 9,967 | 12,515 | 13,775 | 17,005 |
| Long-term Investments | - | - | - | - | - | - | - |
| FixedAssets | 1,478 | 1,298 | 1,373 | 1,876 | 2,232 | 2,086 | 1,765 |
| Right of Use Assets | 267 | 338 | 306 | 260 | 353 | 353 | 353 |
| Other Assets | 3,544 | 3,783 | 3,413 | 3,485 | 3,487 | 3,487 | 2,511 |
| Total Assets | 17,354 | 16,288 | 16,378 | 15,589 | 18,587 | 19,701 | 21,634 |
| S-t Borrowings | 750 | 400 | 984 | - | 1,581 | 581 | 581 |
| AP/NP | 2,986 | 3,132 | 2,172 | 2,910 | 3,572 | 4,923 | 5,713 |
| Other ST liabilities | 1,813 | 1,419 | 1,362 | 2,003 | 3,788 | 3,788 | 3,788 |
| Total Current Liabilities | 5,549 | 4,951 | 4,518 | 4,913 | 8,942 | 9,292 | 10,083 |
| L-t Debt | 1,076 | 969 | - | - | - | - | - |
| Other Liabilities | 2,165 | 1,971 | 1,137 | 703 | 801 | 801 | 801 |
| Total Liabilities | 8,790 | 7,891 | 5,655 | 5,616 | 9,743 | 10,093 | 10,884 |
| CommonShares | 1,502 | 1,512 | 1,526 | 1,543 | 1,543 | 1,543 | 1,543 |
| Other Shareholders' Equity | 7,063 | 6,886 | 9,198 | 8,429 | 7,300 | 8,065 | 9,207 |
| Total Equity | 8,564 | 8,397 | 10,723 | 9,972 | 8,843 | 9,608 | 10,750 |
| Total Liab./Shrhldr's Equity | 17,354 | 16,288 | 16,378 | 15,589 | 18,587 | 19,701 | 21,634 |
© 2026 Citigroup Inc. No redistribution without Citigroup's written permission.
Source: Company Reports, Citi Research, Citi Research Estimates
Prepared for Kevin Lu
Figure 43. Dynapack: Cash Flow Statement
| Cash Flow (NT$ mn) | 2022 | 2023 | 2024 | 2025 | 2026E | 2027E | 2028E |
|---|---|---|---|---|---|---|---|
| Cashflow from Operations | 970 | 3,234 | 1,206 | 1,655 | 2,413 | 3,781 | 3,185 |
| Net profits | 797 | 788 | 2,673 | 1,382 | 2,293 | 3,822 | 5,710 |
| Depreciation&Amortization | 326 | 312 | 294 | 290 | 412 | 545 | 721 |
| Inv. Gain/Loss(Equity ) | 12 | 8 | 2 | 50 | 21 | 0 | 0 |
| Disposal of Investment | 0 | 0 | 0 | 0 | 0 | 0 | 0 |
| Working Capital Change | 137 | 2,154 | 525 | -500 | -312 | -586 | -3,246 |
| Dec(Inc)-A/R | 130 | 972 | 957 | -436 | -257 | -1,675 | -3,517 |
| Dec(Inc)-Inventory | 459 | 1,037 | 528 | -802 | -718 | -261 | -520 |
| Inc(Dec)-A/P | -452 | 146 | -960 | 738 | 662 | 1,350 | 791 |
| Other adjustments | -303 | -28 | -2,288 | 433 | (1) | - | - |
| Cashflow from Investing | 1,626 | -2,370 | 1,214 | 2,439 | -3,066 | -400 | 576 |
| (Purchases)Sale of fixed asset / (capex) | -160 | -117 | -146 | -167 | (708) | (400) | (400) |
| (Purchases)Sale of LT investment | 0 | 0 | 0 | 0 | - | - | - |
| (Purchases)Sale of ST investment | 2,083 | -1,893 | -784 | 2,992 | (2,325) | - | - |
| Other adjustments | -297 | -361 | 2,144 | -385 | (32) | - | 976 |
| Cashflow from financing | -4,467 | -1,877 | -2,103 | -2,885 | -268 | -4,058 | -4,568 |
| Increase inL-T debt | 303 | -589 | -1,057 | -19 | 0 | 0 | 0 |
| Increase inS-T debt | -2,757 | -350 | 584 | -943 | 1,581 | -1,000 | 0 |
| CashDividendPaid | -2,248 | -909 | -840 | -1,907 | -1,834 | -3,058 | -4,568 |
| Issuance of stock | 0 | 0 | 0 | 0 | 0 | 0 | 0 |
| Other adjustments | 235 | -29 | -790 | -16 | -15 | 0 | 0 |
| Exchange rate adjustment | 454 | -54 | 231 | -310 | 125 | 0 | 0 |
| Net change in cash | -1,416 | -1,068 | 549 | 899 | -795 | -677 | -807 |
© 2026 Citigroup Inc. No redistribution without Citigroup's written permission.
Source: Company Reports, Citi Research, Citi Research Estimates
Prepared for Kevin Lu
Dynapack (3211.TWO): Valuation Methodology and Risks
We value Dynapack based on target P/E as we believe earnings growth, margin expansion and the company's positioning in AI datacenter BBU supply chain will be the key focus areas for the market.
We use 2027E as our valuation base, as we believe 2027E would better reflect the company's earnings power after BBU capacity expansion. We apply a target P/E of 32x to our 2027E EPS of NT$25.0, and derive our target price of NT$800. Our target P/E of 32x is based on our forecast EPS CAGR of 66% over 2025-2027E and a PEG of 0.5x, benchmarked against Delta, its major PSU partner, as we expect Dynapack to grow alongside Delta.
Our target P/E of 32x is also close to the high end of historical forward P/E range of 14-31x since the stock re-rated in 2025, which we view as justified in view of Dynapack's exposure to secular AI datacenter power demand, potential BBU content value increase, margin expansion from higher non-IT sales, and improving ROE.
Before BBU started to become a key growth driver in 2024, Dynapack was trading at an average of 14x forward P/E, which reflected the soft outlook and rising competition of its legacy business. In 4Q24-1H26, the company was trading at 20x on average, thanks to the strong BBU demand, driving strong sales and earnings.
We believe Dynapack is likely to re-rate from its historical valuation range, supported by its transition from a mature IT battery pack supplier to an AIDC BBU beneficiary and aggressive capacity expansion, driving strong margin expansion and robust earnings momentum.
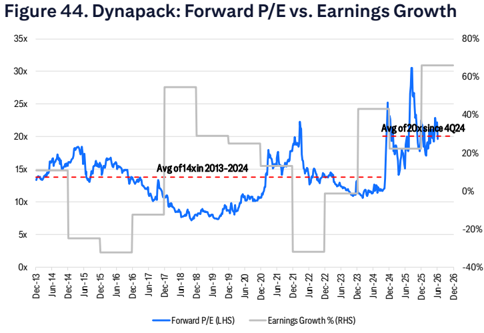
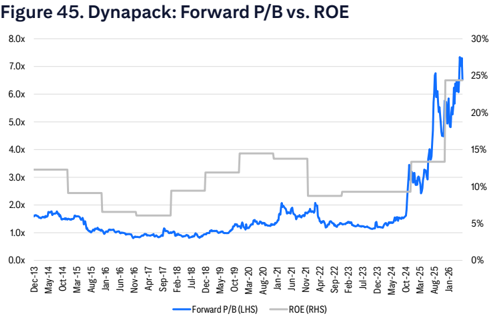
© 2026 Citigroup Inc. No redistribution without Citigroup's written permission. Source: Thomson Reuters, Citi Research, Citi Research Estimates
© 2026 Citigroup Inc. No redistribution without Citigroup's written permission. Source: Thomson Reuters, Citi Research, Citi Research Estimates
Prepared for Kevin Lu
Figure 46. Peer Comp: Forward P/E vs. Earnings CAGR
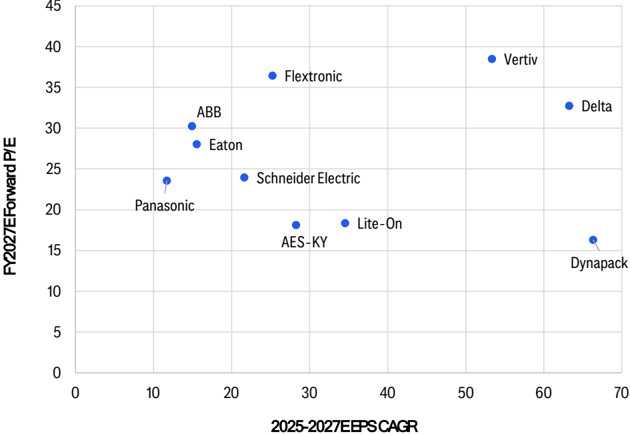
Key Downside Risks to Our Price Target/Rating Are:
- Slower-than-expected BBU adoption in AIDC: If CSPs continue to rely mainly on centralized UPS, adopt only partial BBU deployment, or delay rack-level BBU implementation due to cost, safety or system design considerations.
- Delay in PSU customer qualifications: The company's BBU growth depends heavily on qualification with PSU operators and downstream CSP programs. Any delay in PSU platform qualification or CSP validation could push revenue recognition into later periods.
- Competition from larger battery or power solution vendors: Larger players may have stronger balance sheets, better cell sourcing, or broader customer relationships. If these competitors price aggressively, Dynapack's margins are likely to be under pressure.
- Safety, certification and reliability risks: Any certification delay, field failure, recall or reliability issue could damage Dynapack's reputation, resulting in share losses.
Our quantitative model assigns a High Risk rating to Dynapack. However, we believe such a rating is not warranted for Dynapack due to: 1) the company is generating solid revenue and earnings growth over next 3 years; the underlying industry, BBU for AIDC, also enjoys secular growth; 2) the business model that involves with product customization and strict safety/reliability requirements would imply relatively benign competition and therefore stable pricing and margins; and 3) the company has a strong balance sheet and has been in net cash position since 2019.
Figure 41. Dynapack: Battery Packs for I| Products
Source• Comnanv Renorts)
Prepared for Kevin Lu
Figure 48. Dynapack: BBU Product (3.2KW)
Dynapack (3211.TWO): Company Overview
Established in 1998 and listed on the Taipei Exchange in 2004, Dynapack is a Taiwan-based lithium-ion battery pack manufacturer, focusing on customized battery pack design, engineering, manufacturing and system integration. Dynapack's headquarters is located in Taoyuan, Taiwan with manufacturing presence in Taiwan (A7 technology park), China, and Thailand.
Historically, Dynapack built its foundation in notebook and mobile-device battery pack with certifications from major international brands including HP, ASUS, Apple, Dell, and Microsoft. In recent years, the co has expanded beyond traditional IT applications into higher-growth non-IT segments.
Dynapack assembles battery cells with protection circuits, mechanical parts, software interfaces and related testing processes to meet customer's system requirement. Its key product categories include IT battery packs (for notebook, tablet, mobile-devices), mobility and light EV battery packs (for e-bikes, emotors), BBU (for datacenter), energy storage and industrial applications (UPS, ESS, AGV). In 2025, non-IT sales made up 35% of group sales, up from 5-10% in 2020. We estimate BBU to make up the majority of non-IT sales.
Figure 47. Dynapack: Battery Packs for IT Products
Figure 48. Dynapack: BBU Product (3.2KW)

Source: Company Reports
Source: Company Reports
Figure su. Lynapack: Production Presence
Figure 51. Dynapack: Key Milestones
Year
1998
2000
2004
2006
2009
2012
2015
2019
2023
Prepared for Kevin Lu
Key Event
Obtained ISO 9001 certification
Mostly produce battery packs
Received Apple approval; listed on Taipei Exchange in Nov
Received Dell approval for battery pack for IT products
Mostly produce
Introduced Delta Electronics ectronics TW) as a strategic partner battery packs for
Figure 49. Dynapack: Sales of IT vs. Non IT
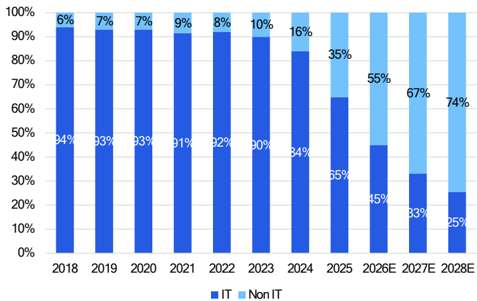
© 2026 Citigroup Inc. No redistribution without Citigroup's written permission. Source: Company Reports, Citi Research, Citi Research Estimates
Figure 50. Dynapack: Production Presence
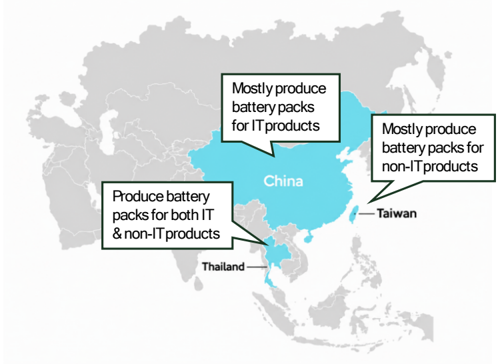
© 2026 Citigroup Inc. No redistribution without Citigroup's written permission. Source: Company Reports, Citi Research
| Figure 51. Dynapack: Key Milestones | Figure 51. Dynapack: Key Milestones |
|---|---|
| ©2026CitigroupInc. Noredistribution without Citigroup's written permission. | ©2026CitigroupInc. Noredistribution without Citigroup's written permission. |
| Source: CompanyReports, Citi Research | Source: CompanyReports, Citi Research |
We think the competitive edge of Dynapack comes from its long operating history, battery-pack design capability, international customer qualification, and manufacturing flexibility. It holds international certifications including ISO 9001, ISO 14001, IECQ QC080000, ISO 13485, ISO 17025, UL and TUV-related certifications. Their capabilities allow the company to provide customized battery pack solutions, while maintaining quality and reliability.
Real Estate Assets Provide Non-operating Earnings Support
Dynapack's real estate assets have provided meaningful non-operating earnings support in 2021 and 2024. The company owns land assets around Taoyuan's A7 area and has monetized part of these asset through disposal and development projects. In 2021, Dynapack sold its Guishan factory/office building and related land, contributing c.NT$16/share to EPS. In 2024, the company recognized gains from A7 land development and property disposal, contributing c.NT$12/share to EPS. Going forward, the remaining A7 land could still provide additional asset value or disposal gains.
Prepared for Kevin Lu
Shareholder Structure
As of June 2026, Chairman Chung Tsung Ming is the largest shareholder, holding c.7% of total shares. The overall founder and his family owns c.10% of total shares. Local funds represented c.16% of shares while foreign investors made up 27% of shares as of July 6 th 2026.
Key Management Team
- n Chung Tsung Ming (Chairman) Chairman Chung has a finance and accounting background with an MBA from National Chengchi University and a bachelor's degree in accounting from the National Taiwan University. Prior to Dynapack, he was a partner at Deloitte. He has served on Dynapack's board since 2002.
- n Chang Chung Hsing (CEO) President Chang was appointed in 2023. He holds a master's degree in electrical engineering from Chung Yuan University. Before joining Dynapack, he worked as a senior manager of the power R&D center at Dell.
- n Lin Yu Hui (CFO) Ms. Lin serves as senior finance executive and the company's spokesperson. She holds a master's degree in Accounting from National Taiwan University. She was the manager of the audit department at Deloitte before joining the firm.
Figure 52. Dynapack: Shareholder Structure
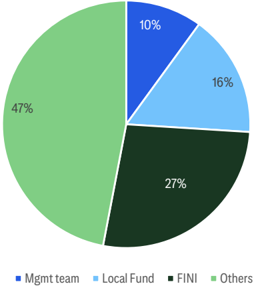
© 2026 Citigroup Inc. No redistribution without Citigroup's written permission. Source: Company Reports, Bloomberg, Citi Research
Figure 53. Dynapack: FINI Holding %
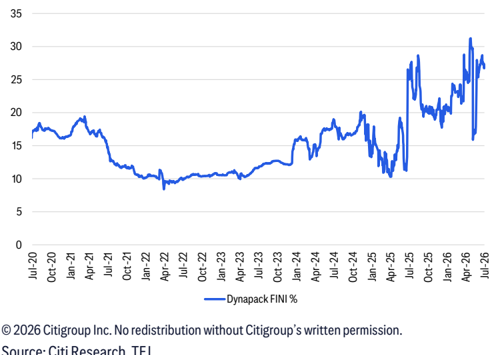
Prepared for Kevin Lu
Advanced Energy Solution (6781.TW)
Buy | TP NT$1,680.00 from NT$1,660.00 | Price NT$1,250.00 (06 Jul 26 13:30)
Reiterate Buy on strong AIDC BBU demand and HVDC migration -We remain
constructive on AES as one of the beneficiaries of AIDC BBU adoption. BBU now contributes >70% of sales and should remain the key earnings driver as AI rack power continues to rise. We expect AES to benefit from higher BBU content per rack and deep CSP engagement as the industry transitions from conventional 48V systems to HVDC architecture.
HVDC BBU mass production targeted from 2H26E through 1Q27E -We expect
high-voltage (+/-400V and 800V) BBU solutions to enter volume production in early 2027, supported by next-generation AI racks with higher power density. The transition raises technical barriers which should favor established suppliers with proven system integration capability. While the market remains conservative on HVDC architecture progress, we see upside if commercialization progresses on schedule and BBU penetration continues to expand alongside AI rack deployment.
Product diversifications outside of BBU; expanding capacity in China and
Vietnam -In addition to BBU, we also see continued product diversifications into telecom, AGV/AMR and forklifting applications, although AIDC BBU should remain the dominant growth engine in the next 2- 3 years in our view. AES is accelerating capacity expansion in Vietnam and China to support the upcoming HVDC ramp. The company expects capex to increase 20-30% y/y in 2026E. As production scales, we expect stronger operating leverage and have more confidence in sustaining earnings growth in 2027E onwards.
Earnings estimates and TP revision -We lower our earnings est 11%/7% in 2026E/2027E to factor in higher opex assumptions, primarily driven by the ongoing investment in RD to support the upcoming HVDC ramp. Despite the earnings revisions, we raise our target price to NT$1,680 (from NT$1,660) as we roll forward our valuation base to 2027E EPS. We assign a 27x target P/E, on par with its historical average since listing. We use 2027E as the year of valuation base as we think 2027E can better reflect its earnings power following the commercialization of HVDC products.
Earnings Summary
| Year to 31Dec | Net Profit (NT$M) | DilutedEPS (NT$) | EPSgrowth (%) | P/E (x) | P/B (x) | ROE (%) | Yield (%) |
|---|---|---|---|---|---|---|---|
| 2024A | 2,169 | 25.39 | 10.2 | 49.2 | 7.3 | 15.7 | 1 |
| 2025A | 3,263 | 38.2 | 50.4 | 32.7 | 6.4 | 20.7 | 1.5 |
| 2026E | 3,959 | 46.35 | 21.3 | 27 | 5.2 | 21.2 | 1.8 |
| 2027E | 5,240 | 61.35 | 32.4 | 20.4 | 4.5 | 23.6 | 2.4 |
| 2028E | 6,671 | 78.09 | 27.3 | 16 | 3.8 | 25.7 | 3.1 |
Source: Powered by dataCentral
Prepared for Kevin Lu
Figure 54. AES: Sales Growth and Y/Y
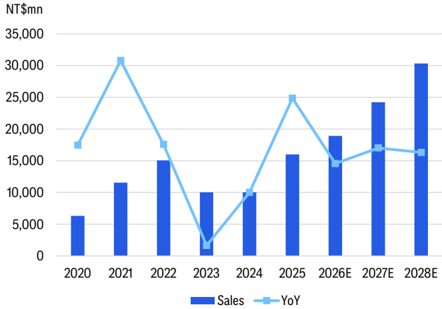
© 2026 Citigroup Inc. No redistribution without Citigroup's written permission. Source: Citi Research, Citi Research Estimates
Figure 56. AES: Earnings Growth and Y/Y
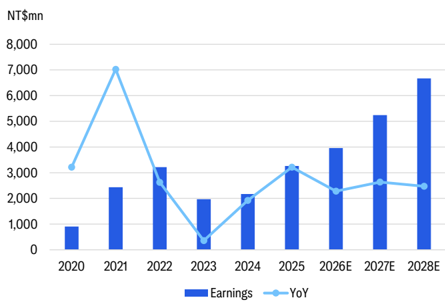
© 2026 Citigroup Inc. No redistribution without Citigroup's written permission. Source: Citi Research, Citi Research Estimates
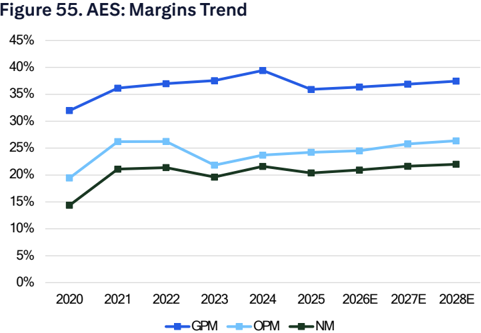
100%
80%
60%
40%
20%
0%
-20%
-40%
© 2026 Citigroup Inc. No redistribution without Citigroup's written permission. Source: Citi Research, Citi Research Estimates
© 2026 Citigroup Inc. No redistribution without Citigroup's written permission. Source: Citi Research, Citi Research Estimates
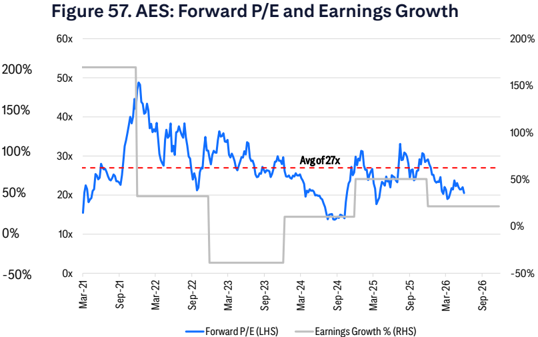
Figure 58. AES: Earnings Estimates Revisions
| FY26E | FY26E | FY26E | FY27E | FY27E | FY28E | FY28E | |
|---|---|---|---|---|---|---|---|
| NT$mn | New | Old | Chg | New | Old | Chg | New |
| NetSales | 18,913 | 19,646 | -3.7% | 24,221 | 24,557 | -1.4% | 30,325 |
| Gross profit | 6,874 | 7,485 | -8.2% | 8,934 | 9,379 | -4.7% | 11,355 |
| OPEX | 2,238 | 2,233 | 0.2% | 2,692 | 2,615 | 2.9% | 3,362 |
| Operatingprofit | 4,635 | 5,252 | -11.7% | 6,242 | 6,764 | -7.7% | 7,993 |
| Pre-tax profit | 5,017 | 5,611 | -10.6% | 6,633 | 7,126 | -6.9% | 8,444 |
| Netprofit | 3,959 | 4,432 | -10.7% | 5,240 | 5,630 | -6.9% | 6,671 |
| EPS | 46.35 | 51.89 | -10.7% | 61.35 | 65.91 | -6.9% | 78.09 |
| Ratio | New | Old | diff | New | Old | diff | New |
| Gross margin (%) | 36.34 | 36.89 | (0.54) | 36.89 | 37.44 | (0.56) | 37.44 |
| OPEXtoSales ratio(%) | 11.84 | 11.11 | 0.72 | 11.11 | 11.09 | 0.03 | 11.09 |
| Operatingmargin (%) | 24.51 | 25.77 | (1.26) | 25.77 | 26.36 | (0.59) | 26.36 |
| Netmargin (%) | 20.93 | 21.64 | (0.70) | 21.64 | 22.00 | (0.36) | 22.00 |
© 2026 Citigroup Inc. No redistribution without Citigroup's written permission.
Source: Citi Research, Citi Research Estimates
Prepared for Kevin Lu
| 6781.TW: Fiscalyearend31-Dec | Price: NT$1,250.00; TP: NT$1,680.00; | Market Cap: NT$106,773m; Recomm:Buy | Market Cap: NT$106,773m; Recomm:Buy | Market Cap: NT$106,773m; Recomm:Buy | Market Cap: NT$106,773m; Recomm:Buy | Market Cap: NT$106,773m; Recomm:Buy | |||||
|---|---|---|---|---|---|---|---|---|---|---|---|
| Profit&Loss(NT$m) | 2024 | 2025 | 2026E | 2027E | 2028E | Valuation ratios | 2024 | 2025 | 2026E | 2027E | 2028E |
| Sales revenue | 10,037 | 16,001 | 18,913 | 24,221 | 30,325 | PE(x) | 49.2 | 32.7 | 27.0 | 20.4 | 16.0 |
| Cost of sales | -6,081 | -10,255 | -12,039 | -15,287 | -18,970 | PB(x) | 7.3 | 6.4 | 5.2 | 4.5 | 3.8 |
| Gross profit | 3,956 | 5,746 | 6,874 | 8,934 | 11,355 | EV/EBITDA(x) | 36.6 | 22.8 | 18.4 | 13.6 | 10.6 |
| Gross Margin (%) | 39.4 | 35.9 | 36.3 | 36.9 | 37.4 | FCFyield (%) | 1.9 | 1.9 | 4.6 | 2.0 | 4.7 |
| EBITDA(Adj) | 2,712 | 4,276 | 5,130 | 6,737 | 8,488 | Dividend yield (%) | 1.0 | 1.5 | 1.8 | 2.4 | 3.1 |
| EBITDAMargin(Adj) (%) | 27.0 | 26.7 | 27.1 | 27.8 | 28.0 | Payout ratio (%) | 49 | 49 | 49 | 49 | 49 |
| Depreciation | -333 | -399 | -495 | -495 | -495 | ROE(%) | 15.7 | 20.7 | 21.2 | 23.6 | 25.7 |
| Amortisation | 0 | 0 | 0 | 0 | 0 | Cashflow(NT$m) | 2024 | 2025 | 2026E | 2027E | 2028E |
| EBIT (Adj) | 2,379 | 3,877 | 4,635 | 6,242 | 7,993 | EBITDA | 2,712 | 4,276 | 5,130 | 6,737 | 8,488 |
| EBIT Margin (Adj) (%) | 23.7 | 24.2 | 24.5 | 25.8 | 26.4 | Working capital | -35 | -1,016 | 885 | -3,102 | -1,636 |
| Net interest | 246 | 254 | 322 | 294 | 329 | Other | -189 | -581 | -676 | -1,002 | -1,323 |
| Associates | 0 | 0 | 0 | 0 | 0 | Operating cashflow | 2,488 | 2,678 | 5,340 | 2,633 | 5,530 |
| Non-Op/Except/Other Adj | 128 | 8 | 59 | 97 | 121 | Capex | -414 | -632 | -383 | -550 | -550 |
| Pre-tax profit | 2,754 | 4,139 | 5,017 | 6,633 | 8,444 | Net acq/disposals | 2,528 | 196 | 782 | 0 | 0 |
| Tax | -585 | -876 | -1,058 | -1,393 | -1,773 | Other | 0 | 0 | 0 | 0 | 0 |
| Extraord./Min.Int./Pref.div. | 0 | 0 | 0 | 0 | 0 | Investing cashflow | 2,114 | -437 | 399 | -550 | -550 |
| Reported net profit | 2,169 | 3,263 | 3,959 | 5,240 | 6,671 | Dividends paid | -991 | -1,068 | -1,606 | -1,949 | -2,580 |
| Net Margin (%) | 21.6 | 20.4 | 20.9 | 21.6 | 22.0 | Financing cashflow | -2,504 | -739 | 47 | -1,880 | -2,505 |
| CoreNPAT | 2,169 | 3,263 | 3,959 | 5,240 | 6,671 | Net change in cash | 2,697 | 1,416 | 5,785 | 203 | 2,475 |
| Per share data | 2024 | 2025 | 2026E | 2027E | 2028E | Free cashflow to s/holders | 2,074 | 2,046 | 4,957 | 2,083 | 4,980 |
| Reported EPS($) | 25.39 | 38.20 | 46.35 | 61.35 | 78.09 | ||||||
| Core EPS($) | 25.39 | 38.20 | 46.35 | 61.35 | 78.09 | ||||||
| DPS($) | 12.50 | 18.81 | 22.82 | 30.21 | 38.45 | ||||||
| CFPS($) | 29.13 | 31.35 | 62.51 | 30.83 | 64.74 | ||||||
| 24.28 | 23.95 | 58.03 | 24.39 | 58.30 | |||||||
| FCFPS($) BVPS($) | 172.28 | 196.68 | 241.21 | 279.73 | 327.62 | ||||||
| Wtdavgordshares(m) | 85.4 | 85.4 | 85.4 | 85.4 | 85.4 | ||||||
| Wtdavgdiluted shares (m) | 85.4 | 85.4 | 85.4 | 85.4 | 85.4 | ||||||
| Growthrates | 2024 | 2025 | 2026E | 2027E | 2028E | ||||||
| Sales revenue (%) | 0.1 | 59.4 | 18.2 | 28.1 | 25.2 | ||||||
| EBIT (Adj) (%) | 8.6 | 62.9 | 19.6 | 34.7 | 28.0 | ||||||
| CoreNPAT(%) | 10.2 | 50.4 | 21.3 | 32.4 | 27.3 | ||||||
| CoreEPS(%) | 10.2 | 50.4 | 21.3 | 32.4 | 27.3 | ||||||
| BalanceSheet(NT$m) | 2024 | 2025 | 2026E | 2027E | 2028E | ||||||
| Cash&cashequiv. | 7,410 | 8,833 | 14,618 | 14,822 | 17,296 | ||||||
| Accounts receivables | 1,800 | 1,971 | 2,871 | 4,422 | 5,444 | ||||||
| Inventory | 7,504 | 8,975 | 8,095 | 12,578 | 15,419 | ||||||
| Net fixed &other tangibles | 1,782 | 2,085 | 1,973 | 2,028 | 2,083 | ||||||
| Goodwill &intangibles | 0 | 0 | 0 | 0 | 0 | ||||||
| Financial &other assets | 2,083 | 2,907 | 1,531 | 1,614 | 1,684 | ||||||
| Total assets | 20,579 | 24,772 | 29,089 | 35,464 | 41,925 | ||||||
| Accounts payable | 2,174 | 2,663 | 1,878 | 2,920 | 3,579 | ||||||
| Short-term debt | 449 | 790 | 865 | 934 | 1,009 | ||||||
| Long-term debt | 0 | 0 | 0 | 0 | 0 | ||||||
| Provisions &other liab | 3,238 | 4,518 | 5,742 | 7,715 | 9,351 | ||||||
| 5,862 | 7,971 | 8,485 | 13,939 | ||||||||
| Total liabilities | 11,568 | ||||||||||
| Shareholders' equity | 14,716 | 16,800 | 20,604 | 23,895 | 27,985 | ||||||
| Minority interests Total equity | 1 14,717 | 1 16,801 | 1 20,604 | 1 23,895 | 1 27,986 | ||||||
| Net debt (Adj) | -6,960 | -8,043 | -13,754 | -13,888 | -16,287 | ||||||
| Net debt to equity (Adj) (%) | |||||||||||
| For definitions of the items in this table, | -47.3 please click here. | -47.9 | -66.8 | -58.1 | -58.2 |
Prepared for Kevin Lu
| 3211.TWO: Fiscalyearend31-Dec | Price: NT$422.50; TP:NT$800.00; MarketCap:NT$65,194m; Recomm:Buy | Price: NT$422.50; TP:NT$800.00; MarketCap:NT$65,194m; Recomm:Buy | Price: NT$422.50; TP:NT$800.00; MarketCap:NT$65,194m; Recomm:Buy | Price: NT$422.50; TP:NT$800.00; MarketCap:NT$65,194m; Recomm:Buy | Price: NT$422.50; TP:NT$800.00; MarketCap:NT$65,194m; Recomm:Buy | ||||||
|---|---|---|---|---|---|---|---|---|---|---|---|
| Profit&Loss(NT$m) | 2024 | 2025 | 2026E | 2027E | 2028E | Valuation ratios | 2024 | 2025 | 2026E | 2027E | 2028E |
| Sales revenue | 13,912 | 13,218 | 17,803 | 24,072 | 31,902 | PE(x) | 24.0 | 46.7 | 28.2 | 16.9 | 11.3 |
| Cost of sales | -12,327 | -11,025 | -13,847 | -17,822 | -22,841 | PB(x) | 6.0 | 6.5 | 7.3 | 6.7 | 6.0 |
| Gross profit | 1,584 | 2,193 | 3,956 | 6,250 | 9,061 | EV/EBITDA(x) | 20.3 | 30.5 | 19.4 | 11.8 | 8.0 |
| Gross Margin (%) | 11.4 | 16.6 | 22.2 | 26.0 | 28.4 | FCFyield (%) | 1.7 | 2.3 | 2.7 | 4.9 | 4.0 |
| EBITDA(Adj) | 2,997 | 1,981 | 3,152 | 5,181 | 7,708 | Dividend yield (%) | 3.0 | 2.7 | 2.8 | 4.7 | 7.1 |
| EBITDAMargin(Adj) (%) | 21.5 | 15.0 | 17.7 | 21.5 | 24.2 | Payout ratio (%) | 71 | 127 | 80 | 80 | 80 |
| Depreciation | -294 | -290 | -412 | -545 | -721 | ROE(%) | 28.0 | 13.4 | 24.4 | 41.4 | 56.1 |
| Amortisation | 0 | 0 | 0 | 0 | 0 | Cashflow(NT$m) | 2024 | 2025 | 2026E | 2027E | 2028E |
| EBIT (Adj) | 743 | 1,247 | 2,759 | 4,685 | 7,056 | EBITDA | 1,038 | 1,537 | 3,171 | 5,230 | 7,777 |
| EBIT Margin (Adj) (%) | 5.3 | 9.4 | 15.5 | 19.5 | 22.1 | Working capital | 525 | -500 | -312 | -586 | -3,246 |
| Net interest | 0 | 0 | 0 | 0 | 0 | Other | -356 | 618 | -445 | -862 | -1,346 |
| Associates | 0 | 0 | 0 | 0 | 0 | Operating cashflow | 1,206 | 1,655 | 2,413 | 3,781 | 3,185 |
| Non-Op/Except/Other Adj | 2,180 | 553 | 65 | 35 | 15 | Capex | -146 | -167 | -688 | -600 | -600 |
| Pre-tax profit | 2,924 | 1,800 | 2,824 | 4,720 | 7,071 | Net acq/disposals | -784 | 2,992 | -2,325 | 0 | 0 |
| Tax | -251 | -418 | -531 | -897 | -1,361 | Other | 2,144 | -385 | -32 | 0 | 976 |
| Extraord./Min.Int./Pref.div. | 0 | 0 | 0 | 0 | 0 | Investing cashflow | 1,214 | 2,439 | -3,046 | -600 | 376 |
| Reported net profit | 2,673 | 1,382 | 2,293 | 3,822 | 5,710 | Dividends paid | -840 | -1,907 | -1,834 | -3,058 | -4,568 |
| Net Margin (%) | 19.2 | 10.5 | 12.9 | 15.9 | 17.9 | Financing cashflow | -2,103 | -2,885 | -268 | -4,058 | -4,568 |
| CoreNPAT | 2,673 | 1,382 | 2,293 | 3,822 | 5,710 | Net change in cash | 549 | 899 | -775 | -877 | -1,007 |
| Per share data | 2024 | 2025 | 2026E | 2027E | 2028E | Free cashflow to s/holders | 1,060 | 1,488 | 1,725 | 3,181 | 2,585 |
| Reported EPS($) | 17.59 | 9.05 | 15.00 | 25.00 | 37.35 | ||||||
| Core EPS($) | 17.59 | 9.05 | 15.00 | 25.00 | 37.35 | ||||||
| DPS($) | 12.50 | 11.47 | 12.00 | 20.00 | 29.88 | ||||||
| CFPS($) | 7.94 | 10.84 | 15.79 | 24.74 | 20.84 | ||||||
| 6.98 | 9.75 | 11.29 | 20.81 | 16.91 | |||||||
| FCFPS($) | |||||||||||
| Wtdavgordshares(m) | 152 | 153 | 153 | 153 | 153 | ||||||
| Wtdavgdiluted shares (m) | 152 | 153 | 153 | 153 | 153 | ||||||
| Growthrates | 2024 | 2025 | 2026E | 2027E | 2028E | ||||||
| Sales revenue (%) | -19.3 | -5.0 | 34.7 | 35.2 | 32.5 | ||||||
| EBIT (Adj) (%) | 6.3 | 67.8 | 121.3 | 69.8 | 50.6 | ||||||
| CoreNPAT(%) | 239.2 | -48.3 | 65.9 | 66.7 | 49.4 | ||||||
| CoreEPS(%) | 236.1 | -48.5 | 65.7 | 66.7 | 49.4 | ||||||
| BalanceSheet(NT$m) | 2024 | 2025 | 2026E | 2027E | 2028E | ||||||
| Cash&cashequiv. | 6,330 | 4,185 | 5,754 | 4,878 | 3,871 | ||||||
| Accounts receivables | 3,100 | 3,545 | 3,802 | 5,477 | 8,994 | ||||||
| Inventory | 1,046 | 1,842 | 2,552 | 2,813 | 3,333 | ||||||
| Net fixed &other tangibles | 4,786 | 5,361 | 5,699 | 5,754 | 4,656 | ||||||
| Goodwill &intangibles | 306 | 260 | 353 | 353 | 353 | ||||||
| Financial &other assets | 811 | 396 | 427 | 427 | 427 | ||||||
| Total assets | 16,378 | 15,589 | 18,587 | 19,701 | 21,634 | ||||||
| Accounts payable | 2,172 | 2,910 | 3,572 | 4,923 | 5,713 | ||||||
| Short-term debt | 984 | 0 | 1,581 | 581 | 581 | ||||||
| Long-term debt | 0 | 0 | 0 | 0 | 0 | ||||||
| Provisions &other liab | 2,499 | 2,706 | 4,590 | 4,590 | 4,590 | ||||||
| 5,655 | 10,884 | ||||||||||
| Total liabilities | 5,616 | 9,743 | 10,093 | ||||||||
| Shareholders' equity Minority interests | 10,723 0 | 9,972 0 | 8,843 0 | 9,608 0 | 10,750 0 | ||||||
| Total equity | 10,723 | 9,972 | 8,843 | 9,608 | 10,750 | ||||||
| Net debt (Adj) | -5,346 | -4,185 | -4,173 | -4,297 | -3,290 | ||||||
| Net debt to equity (Adj) (%) | -49.9 | ||||||||||
| For definitions of the items in this table, | please click here. | -42.0 | -47.2 | -44.7 | -30.6 |
NT$
2,400
2,000
1,600
1,200
800
400
Jul 25
• Target PE at 27x
• Target PE at 18x
Prepared for Kevin Lu
NT$ 1,680.00
NT$ 650.00
· 48% Downside
Bull/Bear: Advanced Energy Solution (6781.TW)
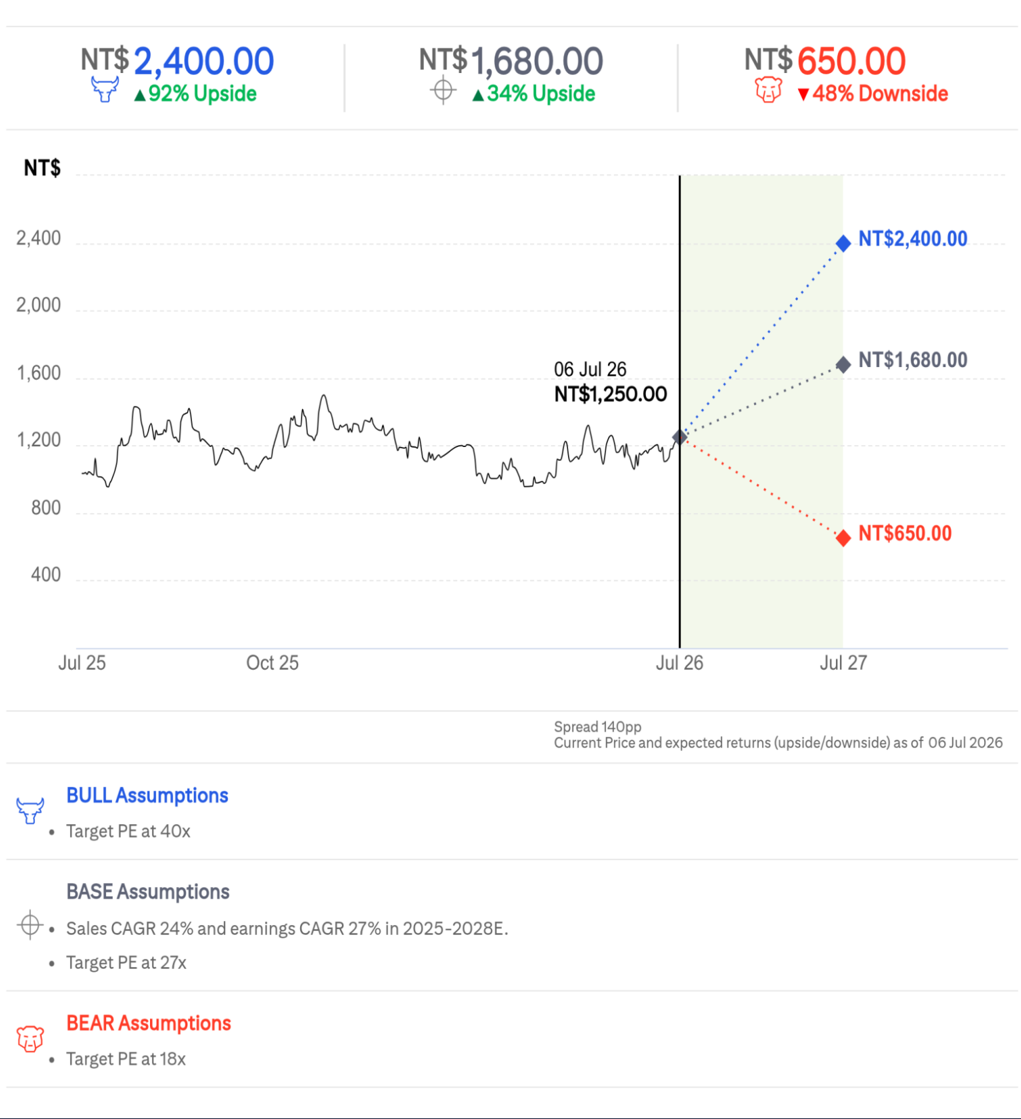
NT$
1,002
835
668
501
334
167
Jul 25
" Sales CAGR of 40% in 2025-2027E
• 2027E target P/E of 35x
BASE Assumptions
Sales CAGR of 35% in 2025-2027E
- Earnings CAGR of 66% in 2025-2027E
• 2027E target P/E of 32x
BEAR Assumptions
- I • Sales CAGR of 25% in 2025-2027E
• Earnings CAGR of 40% in 2025-2027E
• 2027E target P/E of 18x
Prepared for Kevin Lu
A 137% Upside
NT$ 800.00
× 89% Upside
NT$ 390.00
· 7.7% Downside
Bull/Bear: Dynapack International (3211.TWO)
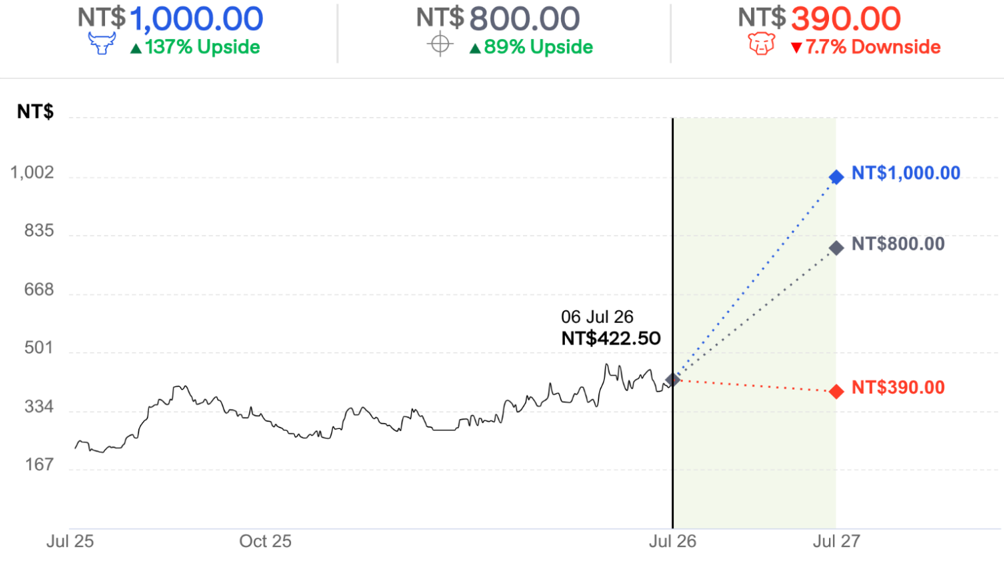
Prepared for Kevin Lu
Advanced Energy Solution
Company description
Established in January 2020 and listed in March 2021, Advanced Energy Solution Holdings (AES) is a holding company registered in Cayman Island, supplying battery packs for LEV (light electrical vehicle such as e-Bikes) and BBU (battery back-up unit for datacenters) applications. Prior to the establishment and IPO, AES was a BU focusing on non-IT applications within its parent company, Simplo Technology (6121.TW).
Investment strategy
We rate AES shares as Buy. Being an industry leader in battery pack design and manufacturing with a proven track record, we expect AES to benefit from higher BBU content per rack and deep CSP engagement as the industry transitions from conventional 48V systems to HVDC architecture. BBU now contributes >70% of sales and should remain the key earnings driver as AI rack power continues to rise. We forecast earnings CAGR of 27% in 20252028E, supported by strong BBU demand, mix upgrade toward high-power BBU products and op leverage.
Valuation
Our target price of NT$1,680 is based on 27x 2026E EPS on par with its historical average since listing and supported by a 2025-28E earnings CAGR of 27%. We use 2027E as the year of valuation base as we think 2027E can better reflect its earnings power after the commercializarion of HVDC products.
Risks
Key downside risks to our earnings forecasts that could prevent the shares from reaching our target price include: 1) slower-than-expected end demand from e-Bikes post the pandemic and volaitlity in cloud capex deployment that could impact datacenter BBU sales; 2) component supply constraints/logistics challenges, which could lead to slower-than-expected shipment and top-line momentum; and 3) peer competition, which could impact sales growth and margins negatively, in our view.
Dynapack International
Company description
Established in 1998 and listed on the Taipei Exchange in 2004, Dynapack is a Taiwan-based lithium-ion battery pack manufacturer, focusing on customized battery pack design, engineering, manufacturing and system integration. Dynapack built its foundation in notebook and mobile-device battery packs with certifications from major international brands. In recent years, it has expanded beyond traditional IT applications into higher-growth non-IT segments. In 2025, non-IT sales made up 35% of group sales, up from 5-10% in 2020. We estimate BBU to make up the majority of non-IT sales.
Prepared for Kevin Lu
Investment strategy
We have a Buy rating on Dynapack shares. Our positive view is driven by Dynapack's transition from a mature IT battery pack supplier to a key beneficiary of AIDC BBU demand. As AI rack power density rises, we expect BBU adoption and content value per rack to increase, supporting robust revenue growth. We also expect meaningful margin expansion as product mix shifts toward higher-margin BBU products. In addition, Dynapack's partnership with multiple PSU operators should broaden its access to CSP and AIDC customers. We forecast earnings CAGR of 60% in 2025-2028E.
Valuation
We assign a 32x target P/E to our 2027E EPS of NT$25 to derive a target price of NT$800. We value Dynapack based on 2027E target P/E as we believe 2027E better reflects its earnings power after BBU capacity expansion. Our target P/E of 32x is based on our forecast EPS CAGR of 66% in 2025-2027E and a PEG of 0.5x, which we benchmark against its major PSU partner, as we expect Dynapack to grow alongside its partner.
Risks
Our quantitative model assigns a High Risk rating to Dynapack. However, we believe such a rating is not warranted for Dynapack due to: 1) the company is generating solid revenue and earnings growth over next 3 years; the underlying industry, BBU for AIDC, also enjoys secular growth; 2) the business model that involves with product customization and strict safety/reliability requirements would imply relatively benign competition and therefore stable pricing and margins; and 3) the company has a strong balance sheet and has been in net cash position since 2019.
Key downside risks to our price target/rating are: 1) Slower-than-expected BBU adoption in AIDC, 2) Delay in PSU customer qualifications, 3) Competition from larger battery or power solution vendors, 4) Safety, certification and reliability issues.
Date
TWD
400
200
If you are visually impaired and would like to speak to a Citi representative regarding the details of the graphics in this document, please call USA 1-888-500-5008 (TTY: 711), from outside the US +1-210-677-3788
*Indicates Change
Appendix A-1
Rating/target price changes above reflect Eastern Time
Covered
Ratings and Target Price History
Not covered