PDF 原檔:報告_Citi_聯電2303_20260729_original.pdf
圖片清單(已驗證 2026-07-31)
| 檔名 | size | 分類 | 親眼所見內容 |
|---|---|---|---|
260729_citi_UMC_008.png |
190.0KB | 真資料圖 | Citi 評等與目標價歷史表+股價走勢圖:2023-10~2026-04 共 11 次評等/目標價變動記錄(TP 由 NT$61→…→2026-04-30 的 NT$88),另附 Short-Term View/Catalyst Watch 紀錄 |
260729_citi_UMC_002.png |
180.3KB | 真資料圖 | Figure 2:UMC 各季營收依製程節點堆疊長條圖(1Q23–2Q26,NT$mn)+ Figure 3:同期製程別營收占比堆疊圖 |
260729_citi_UMC_007.png |
95.7KB | 真資料圖 | UMC 目標價情境圖:現價 NT$102.50(2026-07-29),Bull NT$150(+46%)/Base NT$125(+22%)/Bear NT$75(-27%)三情境股價走勢預測扇形圖 |
260729_citi_UMC_006.png |
62.1KB | 真資料圖 | Figure 7:UMC forward P/E band 圖,2010–2026,標示 4.3x/7.4x/10.5x/13.6x/16.7x 倍數區間,近期股價已觸及高倍數區 |
260729_citi_UMC_004.png |
65.7KB | 真資料圖 | Figure 5:UMC 各季營收依應用別(Communication/Computer/Consumer/Others)占比堆疊圖,1Q23–2Q26 |
260729_citi_UMC_005.png |
47.3KB | 真資料圖 | UMC forward P/E band 走勢圖,2010–2026,標示 4.3x/7.4x/10.5x/13.6x/16.7x 倍數線,股價於 2026 上半年大幅突破過去區間上緣後回落 |
260729_citi_UMC_001.png |
14.6KB | 真資料圖 | UMC 股價走勢小圖(Sep–Jun),由約 NT$40 一路上漲至 2026 年中高點約 NT$160,近期回落至約 NT$100 附近 |
260729_citi_UMC_003.png |
34.1KB | 真資料圖 | Figure 4:UMC 各季營收依應用別金額堆疊長條圖(NT$mn,1Q23–2Q26) |
原始內容
(RIC: 2303.1W, BB: 2303 11)
TWD
175
150
125
100
75
50
25
Prepared for Kevin Lu
29 Jul 2026 12:01:03 ET │ 18 pages
Sep
Dec
Mar
Jun
UMC (2303.TW)
Stronger near-term fundamentals with AI upside in the longer term
CITI'S TAKE
UMC delivered a solid 2Q26, with revenue rising 12.6% QoQ to NT$68.7bn, GM to 32.5%, and UTR up to 85% from 79% in 1Q26. Management guided 3Q26 wafer shipments to grow by high-single-digit %, UTR to reach low90%, and GM improving to mid-30% range, supported by PMIC, sensors and MCUs. More importantly, UMC is repositioning its portfolio toward AIrelated specialty technologies, including silicon photonics, advanced packaging, connectivity and power management. AI revenue is projected to approach US$300mn in 2026 and exceed US$1bn within three years. While consumer demand remains mixed, improving UTR and more constructive pricing trend should support earnings growth, partly offset by higher depreciation from new capacity investments.
Capex shifts toward silicon photonics and advanced packaging -UMC raised its 2026 capex budget from US$1.5bn to US$2bn and approved roughly US$5bn of investment over the next 2-3 years. The new investment targets AI-related specialty opportunities. Singapore expansion will support silicon photonics, powermanagement processes and related specialty technologies, while the new Tainan facility will provide infrastructure for advanced packaging. Unlike a standardized platform such as CoWoS, UMC's strategy is to offer flexible packaging capabilities. This may include interposers, hybrid bonding, chiplet integration and different stacking configurations, including wafer stacking and customized memory integration. While the depreciation cost is expected to rise by a low-teens percentage annually over at least the next two years, the management sees EBITDA on an upward trend due to better mix and robust demand outlook.
AI growth led by silicon photonics and advanced packaging -UMC expects AIrelated revenue to reach US$300mn in 2026 and exceed US$1bn within 3 years, driven by connectivity, silicon photonics, power management and advanced packaging. Silicon photonics should be one of the fastest-growing areas. UMC completed its first production run of a 12-inch silicon photonics IC in 2Q26 and plans to open the platform for broader customer adoption in 2027. UMC is also developing TFLN modulators for next-generation high-speed optical links. In advanced packaging, >10 customer projects are currently active, with several products to tape out in 2026-27 and more contribution from 2028 onward.
Maintain Buy; raise TP to NT$125 -We lift our 2026/27/28 earnings by 59%/44%/52% on better UTR and margin trend. Our TP is at NT$125 (15x 2027 EPS).
Earnings Summary
| Year to 31Dec | Net Profit (NT$M) | DilutedEPS (NT$) | EPSgrowth (%) | P/E (x) | P/B (x) | ROE (%) | Yield (%) |
|---|---|---|---|---|---|---|---|
| 2024A | 47,211 | 3.8 | -23 | 27 | 3.4 | 12.8 | 2.8 |
| 2025A | 41,716 | 3.34 | -12.1 | 30.7 | 3.4 | 11 | 2.4 |
| 2026E | 96,008 | 7.69 | 130 | 13.3 | 2.8 | 23 | 5.6 |
| 2027E | 103,153 | 8.26 | 7.4 | 12.4 | 2.7 | 21.9 | 6 |
| 2028E | 115,092 | 9.21 | 11.6 | 11.1 | 2.5 | 22.8 | 6.7 |
Source: Powered by dataCentral
See Appendix A-1 for Analyst Certification, Important Disclosures and Research Analyst Affiliations.
| n Buy | NT$102.50 |
|---|---|
| Short-Term View: Upside Price (29 Jul 2613:30) Target price | NT$125.00↑ |
| Expected share price return | |
| 22.0% | |
| Expected dividend yield | 3.5% |
| Expected total return | 25.5% |
| MarketCap | NT$1,289,141M |
| US$39,820M |
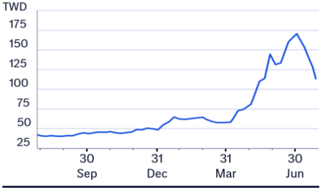
Price Performance (RIC: 2303.TW, BB: 2303 TT)
Laura (Chia Yi) Chen AC
+886-2-8726-9090 laura.cy.chen@citi.com
Jack Chen +886-2-8726-9091 jack1.chen@citi.com
Nicholas Lai +886-2-8726-9093 nicholas.lai@citi.com
Prepared for Kevin Lu
| 2303.TW: Fiscalyearend31-Dec | Price: NT$102.50; TP: NT$125.00; Market Cap: NT$1,289,141m; Recomm:Buy | Price: NT$102.50; TP: NT$125.00; Market Cap: NT$1,289,141m; Recomm:Buy | Price: NT$102.50; TP: NT$125.00; Market Cap: NT$1,289,141m; Recomm:Buy | Price: NT$102.50; TP: NT$125.00; Market Cap: NT$1,289,141m; Recomm:Buy | Price: NT$102.50; TP: NT$125.00; Market Cap: NT$1,289,141m; Recomm:Buy | ||||||
|---|---|---|---|---|---|---|---|---|---|---|---|
| Profit&Loss(NT$m) | 2024 | 2025 | 2026E | 2027E | 2028E | Valuation ratios | 2024 | 2025 | 2026E | 2027E | 2028E |
| Sales revenue | 232,303 | 237,553 | 284,677 | 345,658 | 367,980 | PE(x) | 27.0 | 30.7 | 13.3 | 12.4 | 11.1 |
| Cost of sales | -156,649 | -168,647 | -189,476 | -209,798 | -221,202 | PB(x) | 3.4 | 3.4 | 2.8 | 2.7 | 2.5 |
| Gross profit | 75,654 | 68,906 | 95,201 | 135,860 | 146,778 | EV/EBITDA(x) | 12.1 | 11.8 | 8.7 | 6.2 | 5.4 |
| Gross Margin (%) | 32.6 | 29.0 | 33.4 | 39.3 | 39.9 | FCFyield (%) | -0.5 | 3.5 | 5.4 | 6.6 | 8.6 |
| EBITDA(Adj) | 97,085 | 100,376 | 132,150 | 182,026 | 202,042 | Dividend yield (%) | 2.8 | 2.4 | 5.6 | 6.0 | 6.7 |
| EBITDAMargin(Adj) (%) | 41.8 | 42.3 | 46.4 | 52.7 | 54.9 | Payout ratio (%) | 75 | 74 | 74 | 74 | 74 |
| Depreciation | -45,472 | -56,427 | -65,965 | -78,825 | -90,069 | ROE(%) | 12.8 | 11.0 | 23.0 | 21.9 | 22.8 |
| Amortisation | 0 | 0 | 0 | 0 | 0 | Cashflow(NT$m) | 2024 | 2025 | 2026E | 2027E | 2028E |
| EBIT (Adj) | 51,613 | 43,949 | 66,185 | 103,201 | 111,973 | EBITDA | 97,085 | 100,376 | 132,150 | 182,026 | 202,042 |
| EBIT Margin (Adj) (%) | 22.2 | 18.5 | 23.2 | 29.9 | 30.4 | Working capital | -3,721 | 2,160 | -22,380 | -12,427 | -7,241 |
| Net interest | 2,174 | 937 | 1,105 | 1,775 | 2,146 | Other | -14,843 | -9,586 | 23,106 | 2,437 | 4,531 |
| Associates | 501 | 4,953 | 24,731 | 14,091 | 18,994 | Operating cashflow | 78,521 | 92,949 | 132,877 | 172,036 | 199,332 |
| Non-Op/Except/Other Adj | 1,932 | -191 | 13,546 | 1,349 | 1,349 | Capex | -85,408 | -48,764 | -63,453 | -87,883 | -89,007 |
| Pre-tax profit | 56,220 | 49,648 | 105,567 | 120,416 | 134,462 | Net acq/disposals | 0 | 0 | 0 | 0 | 0 |
| Tax | -9,113 | -8,113 | -10,049 | -18,062 | -20,169 | Other | 1,803 | -1,354 | -17,276 | -6,000 | -6,000 |
| Extraord./Min.Int./Pref.div. | 105 | 182 | 490 | 800 | 800 | Investing cashflow | -83,605 | -50,117 | -80,729 | -93,883 | -95,007 |
| Reported net profit | 47,211 | 41,716 | 96,008 | 103,153 | 115,092 | Dividends paid | -37,586 | -35,784 | -31,287 | -72,006 | -77,365 |
| Net Margin (%) | 20.3 | 17.6 | 33.7 | 29.8 | 31.3 | Financing cashflow | -22,365 | -36,991 | 8,816 | -63,268 | -69,674 |
| CoreNPAT | 47,211 | 41,716 | 96,008 | 103,153 | 115,092 | Net change in cash | -27,449 | 5,841 | 60,963 | 14,886 | 34,652 |
| Per share data | 2024 | 2025 | 2026E | 2027E | 2028E | Free cashflow to s/holders | -6,886 | 44,186 | 69,423 | 84,154 | 110,325 |
| Reported EPS($) | 3.80 | 3.34 | 7.69 | 8.26 | 9.21 | ||||||
| Core EPS($) | 3.80 | 3.34 | 7.69 | 8.26 | 9.21 | Revbreakdownbynode | 2024 | 2025 | 2026E | 2027E | 2028E |
| DPS($) | 2.85 | 2.49 | 5.72 | 6.15 | 6.86 | 14nm(%) | 0 | 0 | 0 | 1 | 1 |
| CFPS($) | 6.32 | 7.44 | 10.64 | 13.77 | 15.96 | 28nm(%) | 34 | 37 | 40 | 46 | 48 |
| FCFPS($) | -0.55 | 3.54 | 5.56 | 6.74 | 8.83 | 45nm(%) | 14 | 16 | 15 | 14 | 14 |
| BVPS($) | 30.11 | 30.18 | 36.20 | 38.67 | 41.67 | 65nm(%) | 16 | 17 | 17 | 14 | 13 |
| Wtdavgordshares(m) | 12,425 | 12,485 | 12,491 | 12,491 | 12,491 | 90nm(%) | 11 | 8 | 7 | 6 | 6 |
| Wtdavgdiluted shares (m) | 12,425 | 12,485 | 12,491 | 12,491 | 12,491 | 0.11/0.13um (%) | 10 | 7 | 7 | 7 | 7 |
| Growthrates | 2024 | 2025 | 2026E | 2027E | 2028E | 0.15/0.18um (%) | 10 | 9 | 10 | 9 | 9 |
| Sales revenue (%) | 4.4 | 2.3 | 19.8 | 21.4 | 6.5 | 0.25/0.35um (%) | 5 | 4 | 3 | 2 | 2 |
| EBIT (Adj) (%) | -10.8 | -14.8 | 50.6 | 55.9 | 8.5 | 0.5um(%) | 0 | 1 | 1 | 1 | 1 |
| CoreNPAT(%) | -22.6 | -11.6 | 130.1 | 7.4 | 11.6 | ||||||
| CoreEPS(%) | -23.0 | -12.1 | 130.0 | 7.4 | 11.6 | Revbrkdnbycustomer | 2024 | 2025 | 2026E | 2027E | 2028E |
| BalanceSheet(NT$m) | 2024 | 2025 | 2026E | 2027E | 2028E | Fabless (%) | na | na | na | na | na |
| Cash&cashequiv. | 105,000 | 110,660 | 171,132 | 185,218 | 219,070 | IDM(%) | na | na | na | na | na |
| Accounts receivables | 33,343 | 31,274 | 45,483 | 51,594 | 55,066 | System(%) | na | na | na | na | na |
| Inventory | 35,782 | 37,228 | 49,370 | 56,003 | 59,772 | ||||||
| Net fixed &other tangibles | 308,035 | 298,840 | 297,666 | 306,723 | 305,661 | Revbrkdnbygeography | 2024 | 2025 | 2026E | 2027E | 2028E |
| Goodwill &intangibles | 0 | 0 | 0 | 0 | 0 | N. America (%) | na | na | na | na | na |
| Financial &other assets | 88,039 | 100,993 | 133,690 | 145,385 | 154,620 | Asia-Pacific (%) | na | na | na | na | na |
| Total assets | 570,201 | 578,996 | 697,341 | 744,923 | 794,189 | Europe (%) | na | na | na | na | na |
| Accounts payable | 7,633 | 9,170 | 13,140 | 13,458 | 13,458 | Japan (%) | na | na | na | na | na |
| Short-term debt | 19,510 | 27,597 | 49,742 | 52,491 | 53,676 | ||||||
| Long-term debt | 55,533 | 45,372 | 51,882 | 57,070 | 62,777 | Analyst items | 2024 | 2025 | 2026E | 2027E | 2028E |
| Provisions &other liab | 109,339 | 117,002 | 127,293 | 135,472 | 140,119 | Capacity - 8" equi. (K) | 11,305 | 11,617 | 11,783 | 11,923 | 11,923 |
| Total liabilities | 192,016 | 199,141 | 242,056 | 258,490 | 270,029 | Shipment - 8" equi. (K) | 7,617 | 8,618 | 10,262 | 10,641 | 10,671 |
| Shareholders' equity | 378,185 | 379,855 | 455,286 | 486,433 | 524,160 | Utilization rate (%) | 67 | 74 | 87 | 89 | 90 |
| Minority interests | 0 | 0 | 0 | 0 | 0 Depreciation to Sales (%) | 19 | 22 | 22 | 21 | 22 | |
| Total equity | 378,185 | 379,855 | 455,286 | 486,433 | 524,160 | ASP(US$) | 908 | 850 | 843 | 996 | 1,059 |
| Net debt to equity (Adj) (%) | -7.9 | -15.3 | -15.6 | -19.6 | |||||||
| For definitions of the items in this table, | please click here. | -9.9 |
Figure 1. UMe - 2220 Results Comparison
1Q26
Actual
61,038
17,818
29.2%
11,276
18.5%
16,171
1.29
(NT$mn)
Revenue
Gross profit
Gross margin
Op. profit
OP margin
Net income
EPS (NTS)
68,733
22,323
32.5%
14,950
21.8%
42,260
3.38
Q/Q
13%
25%
*3.3 ppt
33%
*3.3 ppt
161%
161%
C 2026 Citigroun Inc. No redistribution without Citigroun's written nermission..
Prepared for Kevin Lu
2026
Citi
67,299
20,551
30.5%
Diff.
2%
9%
+1.9 ppt
2026
Cons
67,524
20,708
30.7%
Diff.
3Q26
Guidance
Volume •HSD QoQ;
ASP remains firm
2%
8%
+1.8 ppt
10%
Demand, Pricing and Margin Outlook Turn More Constructive -UMC remains constructive on demand, although the recovery is not yet broad based. AI infrastructure remains the key growth engine, supporting demand for compute, memory, connectivity, optical components and power management. Automotive and industrial demand is relatively stable, while smartphones, PCs and other consumer electronics remain mixed. Nevertheless, UMC expects full-year wafer shipments to increase through stronger 22/28nm demand, recovering eight-inch utilization across both AI and non-AI applications. Management also sees pricing conditions becoming more constructive as utilization improves and specialty technologies account for a larger revenue mix. In our view, higher utilization and better mix should support near-term margin expansion, although rising depreciation will constrain the longer-term gross-margin upside.
Positive 2Q26 Results and outlook
UMC delivered a strong 2Q26, supported by improving utilization and broad-based shipment growth. Revenue increased 12.6% quarter on quarter to NT$68.7 billion, while gross margin expanded to 32.5% (vs 29.2% in 1Q26 and consensus of 30.7%). Wafer shipments rose 7.6% sequentially, and utilization improved to 85% in 2Q26 from 79% in 1Q26.
For 3Q26, management expects wafer shipments to rise by a high-single-digit percentage, driven by strong demand for power-management ICs, sensors and microcontrollers. ASP in US-dollar terms should remain broadly stable, utilization is expected to move into the low-90% range, and gross margin is guided to the mid-30% range. Twelve-inch utilization is expected to remain above the corporate average, while eight-inch loading should recover toward approximately 85%.
Figure 1. UMC - 2Q26 Results Comparison
© 2026 Citigroup Inc. No redistribution without Citigroup's written permission.
Source: Citi Research, Bloomberg
GM at mid-30%
Citi
Prior Est.
71,264
22,833
32.0%
Cons
73,222
24,295
33.2%
Figure 4. UMe — sales by application
Figure 2. UMe — sales by node
NTSmn
NT Smn
80,000
80,000
70,000
70,000
60,000
60,000
50,000
50,000
40,000
40,000
30,000
30,000
20,000
20,000
10,000
10,000
• ≤14nm
© 2026 Citigroup Inc. No redistribution without Citigroup's written permission.
23% 21%
, 18% 17% 16%
9%
9%
10% 12% 9%
49
69
10%
9%
8%
• 15% 14% 19%
39
9%
18% 23%
2%
13%
19%
3%0
46%
9%
39
16%
10
15%
12%
13%
18%
13%
1496
47%
15%
15%
13%
4%
48
2%2
39
36% 33%
33%
15%
15% 17% 18% 17% 16%
17
29
89
9
16%
16%
13%
3%
39
11%
40
37%
35% 34%
7%
18%
11%
12%
40%
17%
12%
35%
18%
12%
3
36%
18%
13%
% 39.
34%
59
37%
Figure s. Ume — sales mix breakdown by application
Figure 3. UMe — sales mix breakdown by node
100%
100%
80%
80%
60%
60%
40%
40%
20%
20%
44% 44%
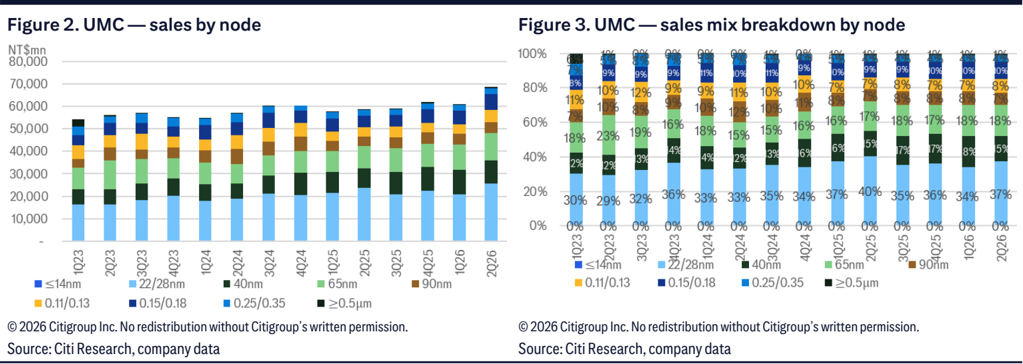
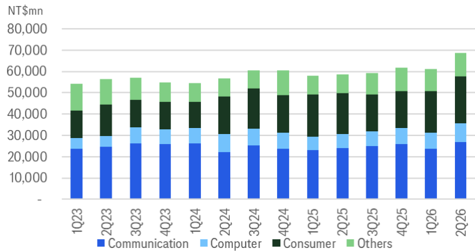
Figure 4. UMC - sales by application
© 2026 Citigroup Inc. No redistribution without Citigroup's written permission. Source: Citi Research, company data
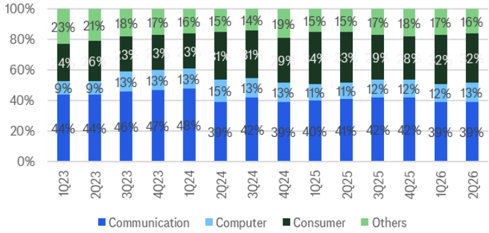
Figure 5. UMC - sales mix breakdown by application
© 2026 Citigroup Inc. No redistribution without Citigroup's written permission. Source: Citi Research, company data
Capex Expansion Focused on AI-Related Specialty Technologies
UMC raised its 2026 capex budget from US$1.5 billion to US$2.0 billion and approved approximately US$5 billion of investment to be deployed over the next two to three years. UMC's Singapore facilities are aiming for silicon photonics and specialty products, including power-management technologies. It will also construct a new facility in Tainan to support advanced packaging, including logic and memory stacking. Additional investment will cover customized memory stacking, direct copper-to-copper bonding and selected eight-inch specialty capacity. Management views connectivity, power management, automotive electrification, robotics, satellites and advanced packaging as structural growth opportunities that can meaningfully expand UMC's addressable market over the next five years.
• 0.11/0.13
Prepared for Kevin Lu
Prepared for Kevin Lu
AI Exposure and Revenue Growth Potential
UMC defines AI-related revenue broadly, including products used in AI compute infrastructure, connectivity, power management, silicon photonics and advanced packaging. Management expects AI-related revenue to approach US$300 million in 2026 and exceed US$1 billion within three years, implying that AI could rise from a low-single-digit percentage of sales currently to a much more meaningful contribution over time.
The fastest-growing areas are expected to be silicon photonics and advanced packaging, given their relatively early stage of commercialization. However, existing specialty technologies should also benefit, particularly power-management ICs, connectivity products, embedded high-voltage solutions, interposers and other devices supporting AI data-centre infrastructure. Management stressed that AI growth is no longer limited to processors and memory. Increasing power density, higher bandwidth requirements and more complex system architectures are generating incremental demand for sensing, connectivity, power conversion and packaging. UMC believes this broader AI infrastructure opportunity plays directly to its specialty-process portfolio and could support both revenue growth and customer share gains.
In the longer term, UMC is also developing TFLN, a platform for high-speed optical modulation. The company has already introduced an initial TFLN modulator and is working on higher-speed solutions targeting 400G lanes and 3.2-terabit optical applications. Longer term, UMC intends to combine its 12-inch silicon photonics platform, TFLN technology, photonic integrated circuits and advanced packaging into an integrated optical offering. The eventual ramp of these silicon photonics technologies, with more meaningful capacity contribution likely from 2028 onward.
Advanced Packaging Strategy and Addressable Market
UMC is broadening its advanced packaging capabilities beyond traditional interposer manufacturing. Its offerings now include direct copper-to-copper bonding, wafer-to-wafer stacking, logic-to-memory integration, memory-tomemory stacking and customized memory stacking. The company has already entered production for selected three-dimensional wafer-level hybrid-bonding applications and has more than ten active customer engagements, with several products expected to tape out during 2026 and 2027. Management expects UMC's addressable advanced-packaging market to approximately double by 2030. The new Tainan facility will provide the physical foundation for this expansion, although larger-scale revenue contribution is likely to become more visible during the 2028-2029 period.
Maintaining Buy and raise TP to NT$125
UMC's share price has corrected substantially by over 60% in recent months due to market turbulence on global de-leverage and macro concern. Yet we see the fundamental improvement outlook remains intact. Management remains constructive on demand but does not yet characterize the recovery as fully broad based. AI infrastructure demand remains strong, particularly for compute, memory, connectivity and power-management products. Automotive and industrial demand appears relatively stable, while consumer electronics remain mixed. Handsets, PCs and notebooks could still decline year on year, although UMC
Figure 1. UMe - Forward F/t band
200
150
100
50
0
2010
2012
- UMC
2014
-4.3x
2016
2018
2020
2022
2024
-7.4x
-
10.5x
-
13.6x
2025 Citioroun Inc No redistribution without Citioroun's written nermission
Prepared for Kevin Lu
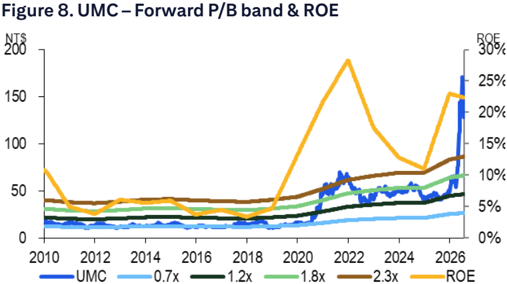
Figure o. UMe - Forward F/b band & RUt
200
150
100
38%
20%
15%
10%
expects to gain wafer share through its 22/28nm and eight-inch specialty offerings. We lift our earnings projection by 59%/44%/52% thanks to better UTR and margin improvement trend. We think its current valuation at 13x/12x/11x 2026/2027/2028 EPS looks attractive. Maintaining Buy with higher TP at NT$125, still based on unchanged 15x 2027 EPS estimate.
@ 2025 Citiơroun Ine No redistribution without Citioroun's written nermission
Figure 6. UMC - Estimates Revisions
| 2026E | 2026E | 2026E | 2027E | 2027E | 2027E | 2028E | 2028E | 2028E | |
|---|---|---|---|---|---|---|---|---|---|
| (NT$mn) | New | Old | Chg. | New | Old | Chg. | New | Old | Chg. |
| Sales | 284,677 | 269,998 | 5% | 345,658 | 301,616 | 15% | 367,980 | 317,348 | 16% |
| YoYgrowth | 20% | 14% | 21% | 12% | 6% | 5% | |||
| Gross profit | 95,201 | 83,474 | 14% | 135,860 | 102,373 | 33% | 146,778 | 107,978 | 36% |
| Opex | 29,016 | 25,829 | 12% | 32,659 | 28,014 | 17% | 34,805 | 29,511 | 18% |
| Operating profit | 66,185 | 57,646 | 15% | 103,201 | 74,359 | 39% | 111,973 | 78,467 | 43% |
| Pre-tax profit | 105,567 | 68,047 | 55% | 120,416 | 83,460 | 44% | 134,462 | 88,017 | 53% |
| Net income | 96,008 | 60,463 | 59% | 103,153 | 71,741 | 44% | 115,092 | 75,615 | 52% |
| EPS(NT$) | 7.69 | 4.84 | 59% | 8.26 | 5.75 | 44% | 9.21 | 6.06 | 52% |
| Gross margin | 33.4% | 30.9% | +2.5 ppt | 39.3% | 33.9% | +5.4 ppt | 39.9% | 34.0% | +5.9 ppt |
| Opexratio | 10.2% | 9.6% | +0.6 ppt | 9.4% | 9.3% | +0.2 ppt | 9.5% | 9.3% | +0.2 ppt |
| Operating margin | 23.2% | 21.4% | +1.9 ppt | 29.9% | 24.7% | +5.2 ppt | 30.4% | 24.7% | +5.7 ppt |
| Net margin | 33.7% | 22.4% | +11.3 ppt | 29.8% | 23.8% | +6.1 ppt | 31.3% | 23.8% | +7.4 ppt |
© 2026 Citigroup Inc. No redistribution without Citigroup's written permission. Source: Citi Research
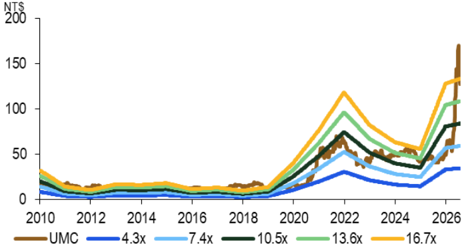
Figure 7. UMC - Forward P/E band
© 2025 Citigroup Inc. No redistribution without Citigroup's written permission.
Source: Citi Research, company data
© 2025 Citigroup Inc. No redistribution without Citigroup's written permission. Source: Citi Research, company data
Figure 9. UMe - Forecast Summary
2025
2Q
58.8
-41.9
16.9
-6.1
-2.3
-4.2
10.8
4Q
61.8
-42.9
19.0
-6.7
-2.4
-4.9
12.2
NT$bn
Revenue
COGS
Gross Profit
Operating Expense
SG&A expenses
R&D expenses
EBIT
Net Interest Income
0.2
1Q
-42.4
15.4
-5.7
-2.2
-4.0
9.8
3Q
59.1
-41.5
17.6
-6.5
-2.3
-4.6
11.1
0.3
0.4
0.1
Figure 9. UMC - Forecast Summary
Pre Tax Profit
Tax Expense/(Credit)
Net Profit
EPS (NT$)
Margins (%)
Gross Margin
Operating Margin
Net Margin
Sequential Growth (%)
Volume (000s)
Revenue
Gross Profit
EBIT
Net Profit
Empl. Bonus-adj. EPS
1QE
80.6
-49.1
31.4
8
-7.
.3
-3.
-5.1
23.6
0.4
1.9
30E
90.6
-54.8
35.8
-8.4
-3.3
-5.8
27.4
0.6
5.2
4QE
88.5
-53.9
34.5
-8.3
-5.5
26.3
0.3
4.1
2025
237.6
-168.6
68.9
-25.0
-9.2
-17.7
43.9
-3.6
9.3
1Q
61.0
-43.2
17.8
-6.5
-2.5
-4.6
11.3
0.1
5.2
2026
2Q
68.7
-46.4
22.3
-7.4
-3.2
-4.7
15.0
0.2
30.1
30E
76.9
-50.0
26.9
-7.5
-2.6
-4.9
19.4
0.5
1.4
4QE
78.0
-49.8
28.2
-7.6
-3.2
-5.0
20.6
0.3
1.6
2026E
284.7
-189.5
95.2
-29.0
-11.5
-19.2
66.2
-4.4
43.8
2027E
345.7
-209.8
135.9
-32.7
-13.5
-21.9
103.2
-5.7
22.9
2028E
146.8
-34.8
-14.3
-23.3
112.0
-6.3
28.8
| 1.6 | 15. 5 | 15. 5 | 15. 5 | 5.5 16.6 0.5 45.2 | 5.5 16.6 0.5 45.2 | 5.5 16.6 0.5 45.2 | 30.7 4.6 49.6 -8.1 | 30.7 4.6 49.6 -8.1 | 30.7 4.6 49.6 -8.1 | 30.7 4.6 49.6 -8.1 | 30.7 4.6 49.6 -8.1 | 105.6 -10.0 | 120.4 | 134.5 -20.2 |
|---|---|---|---|---|---|---|---|---|---|---|---|---|---|---|
| 1.3 -0.3 | 3.0 | 3.2 3.4 | 3.9 | 5.0 | -18.1 | |||||||||
| 7.8 | 8.9 | 15.0 | 10.1 | 16.2 42.3 | 18.2 19.4 | 22.3 | 28.4 | 26.3 | 41.7 | 96.0 | 103.2 | 115.1 | ||
| 0.62 | 0.71 | 1.20 | 0.81 | 1.29 3.38 | 1.46 1.55 | 1.78 | 2.27 | 2.10 | 3.34 | 7.69 | 8.26 | 9.21 | ||
| 26.7 | 28.7 | 30.7 | 39.0 | 39.9 | ||||||||||
| 29.8 18.8 | 29.2 18.5 32.5 | 35.0 | 36.1 | 29.3 39.6 | 39.5 | 39.0 | 29.0 18.5 | 33.4 23.2 | 39.3 29.9 | |||||
| 16.9 | 18.4 | 19.8 | 21.8 | 25.2 | 26.4 | 30.1 | 30.3 | 29.7 | 30.4 | |||||
| 13.4 | 15.2 | 25.3 | 16.3 | 26.5 61.5 | 23.7 | 24.8 | 27.6 30.4 | 31.4 | 29.7 | 17.6 | 33.7 | 29.8 | 31.3 | |
| 2 | 3 | -1 | 3 | 13 | 19 | 0 | ||||||||
| 11 | 8 | |||||||||||||
| 5 | 1 | 5 | -2 | 2 | 20 | 21 | 6 | |||||||
| -16 -18 | 9 11 | 3 | 8 | -8 25 33 | 21 30 5 | 5 6 | -4 -4 | -9 -15 | 38 51 | 43 56 | 8 9 | |||
| -8 | 14 | 68 | -33 | 61 161 | 8 | 130 | 12 | |||||||
| -57 | -8 | -12 | ||||||||||||
| -9 | 14 | 68 | 161 | -57 | 8 | 130 | 12 | |||||||
| @ 2025 Citioroun Inc. No redistribution without Citicroun's written nermission. |
© 2025 Citigroup Inc. No redistribution without Citigroup's written permission.
Source: Citi Research, company data
Prepared for Kevin Lu
Prepared for Kevin Lu
Adding Upside 90-Day Short-Term View on UMC (2303.TW)
Direction:
Upside
Duration:
Within 90 Days
Category:
Thematic driven
We see UMC's improving sales supported by higher UTR and pricing trend to support its share price performance in the coming months.
NT$
180
150
120
90
60
30
Jul 25
A 46% Upside
NT$ 125.00
A 22% Upside
Bull/Bear: UMC (2303.TW)
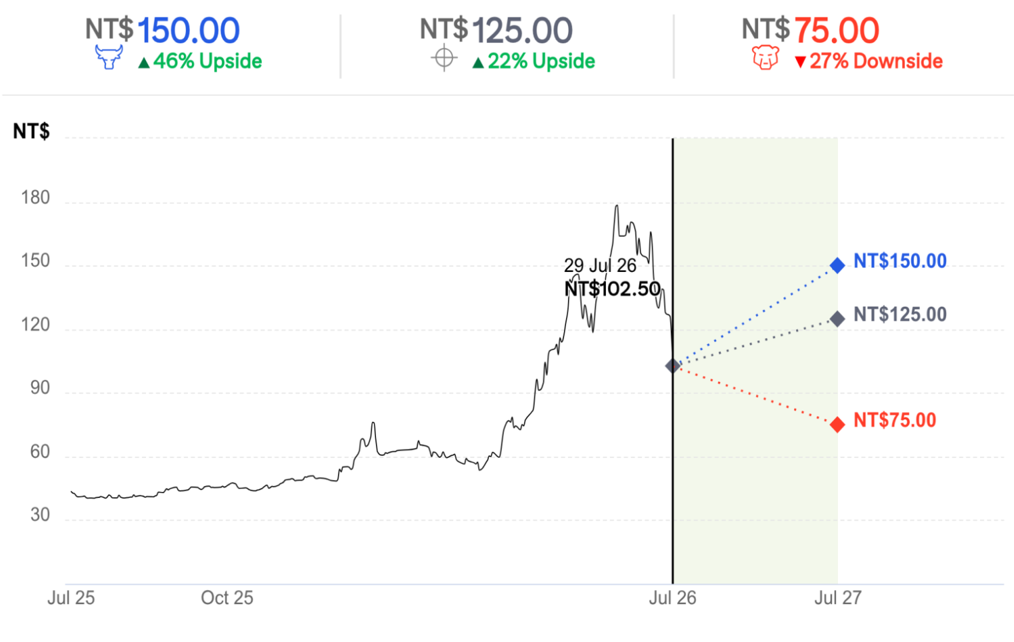
BASE Assumptions
• Gradual UTR recovery
- Solid 28/22nm demand outlook
BEAR Assumptions
• Lower-than-expected margin outlook
- Weaker-than-expected consumer electronic demand
Prepared for Kevin Lu
NT$ 75.00
• 27% Downside
Prepared for Kevin Lu
UMC
Company description
United Microelectronics Corporation (UMC) is a leading global semiconductor foundry company. It provides high-quality IC fabrication services, focusing on logic and various specialty technologies to serve all major sectors of the electronics industry. UMC's comprehensive IC processing technologies and manufacturing solutions include Logic/Mixed-Signal, embedded HighVoltage, embedded Non-Volatile-Memory, RFSOI, and BCD. Most of UMC's 12-inch and 8-inch fabs with core R&D are located in Taiwan.
Investment strategy
We rate UMC shares a Buy. Overall inventory levels in PC, smartphone, and consumer electronics are currently healthy, and we see limited inventory correction downside. While macro uncertainties may linger, we believe UMC's niche technology offerings will help it outperform its trailing-edge foundry peers. We also expect transfer orders from TSMC and the AI-on-device trend to drive stronger demand, and see better UTR recovery for UMC going forward.
Valuation
Our target price for UMC of NT$125 is based on 15x 2027E EPS, which is higher than the midpoint of its 3-year forward PE. We believe our target multiple is justified by our belief that UMC should benefit from the robust demand in 22/28nm, TSMC's increasing order outflow opportunity, long-term opportunity in advanced packaging and photonics and that its niche technology offerings should help it outperform its trailing-edge foundry peers. Our target price equates to 2026E/27E PB of 3.5x/3.2x.
Risks
Key downside risks to our target price include: 1) a longer-than-expected demand recovery; 2) more competition from peers in 28nm; 3) worse-thanexpected developments from the company's China investment; 4) a significant decline in smartphone end-demand; 5) poor contribution from Novatek's iPhone OLED business; and 6) fiercer ASP competition from Chinese peers.
If you are visually impaired and would like to speak to a Citi representative regarding the details of the graphics in this document, please call USA 1-888-500-5008 (TTY: 711), from outside the US +1-210-677-3788