PDF 原檔:報告_Citi_台積電2330_20260716_original.pdf
圖片清單(已驗證 2026-07-17)
| 檔名 | size | 分類 | 親眼所見內容 |
|---|---|---|---|
報告_Citi_台積電2330_20260716_002.png |
43KB | 真資料圖 | Capex intensity trend 柱狀圖+折線:2023-2028E capex(US$mn)與 capex intensity(%)雙軸圖 |
報告_Citi_台積電2330_20260716_003.png |
147KB | 真資料圖 | Figure 3/4:Sales Mix by Platform(百分比堆疊柱狀)與 Sales by Platform(US$mn 堆疊柱狀),2Q23-2Q26 逐季 |
報告_Citi_台積電2330_20260716_004.png |
118KB | 真資料圖 | Figure 5/6:Sales Mix by Node(百分比堆疊柱狀)與 Sales by Node(US$mn 堆疊柱狀),2Q23-2Q26 逐季 |
報告_Citi_台積電2330_20260716_005.png |
158KB | 真資料圖 | Figure 8/9:Forward P/E band(11.3x-18.3x)與 Forward P/B band & ROE(2.7x-6.5x + ROE 折線),2010-2026 |
報告_Citi_台積電2330_20260716_006.png |
100KB | 真資料圖 | Bull/Base/Bear 股價目標圖:Bull NT$4,000(+62%)、Base/TP NT$3,800(+54%)、Bear NT$2,200(-11%),現價 16 Jul 26 NT$2,470 |
報告_Citi_台積電2330_20260716_007.png |
146KB | 真資料圖 | Ratings and Target Price History 表+股價走勢圖,2023-11 至 2026-07 歷次評等/目標價/收盤價紀錄(最新 #19 2026-07-03 TP NT$3,800,收盤 NT$2,445) |
報告_Citi_台積電2330_20260716_008.png |
129KB | 真資料圖 | Short-Term View/Catalyst Watch Research 表+股價走勢圖,2023-10 至 2026-07 歷次 Catalyst Watch 加開/移除紀錄 |
報告_Citi_台積電2330_20260716_001.png(17KB)未達 40KB 門檻,預設 logo/裝飾未逐張 Read。
原始內容
(RIC: 2330.1W, BB: 2330 11)
TWD
2,500
2,250
2,000
1,750
1,500
1,250
1,000
Prepared for Kevin Lu
16 Jul 2026 09:16:42 ET │ 20 pages
Sep
Dec
Mar
Jun
TSMC (2330.TW)
AI demand keeps accelerating; Upside surprise on further capex increase
CITI'S TAKE
TSMC delivered another strong quarter with 2Q26 revenue of US$40.2bn (+12% QoQ, +34% YoY) and guiding 3Q26 revenue to US$44.6-45.8bn, implying another ~12% sequential increase. More importantly, management repeatedly emphasized that AI demand has become even stronger than previously expected. 2026 Capex is lifted to US$60-64bn as AI demand is broadening beyond GPUs to include CPUs, custom ASICs and networking silicon, reinforcing confidence in 2026 revenue growth of above 40% YoY. Importantly, management stressed that it evaluates CSP deployment schedules, power availability and data-center construction before expanding capacity, supporting confidence that current AI demand represents real deployment rather than inventory build. Reiterate Buy.
The lifted guidance and capex driven by higher demand and inflationary pricing environment -Despite aggressively raising 2026 capex, management acknowledged that supply will likely remain tight for years. TSMC highlighted that AI-related demand spans CPUs, GPUs/XPUs, requiring continuous balancing of wafer allocation across customers. TSMC reinforced that leading-edge capacity expansion remains entirely demand driven rather than competitively motivated. At the same time, TSMC announced additional US$100bn investment in Arizona, with total investment to reach US$265bn in the coming years. Management reiterates that customer engagement begins several years before production, making foundry partnerships fundamentally different from commodity manufacturing. Capacity planning relies on extensive collaboration with customers, balanced with TSMC's own judgment rather than simply aggregating optimistic customer forecasts.
Tight AI semiconductor to continues; welcome alternative packaging technology -TSMC reaffirmed that N2-family capacity could grow more than 70% CAGR from 2026-2028, while N3 capacity also continues expanding rapidly to support advanced AI products. Advanced packaging remains the key bottleneck, particularly CoWoS, remains severely supply constrained and is currently limiting customer shipments. TSMC is accelerating backend capacity while welcoming alternatives such as Intel's EMIB, which could be beneficial for TSMC's wafer foundry business and without threatening TSMC's front-end foundry leadership.
Reiterate Buy -We keep our TP NT$3,800 unchanged (25x of 2027 EPS) with Buy.
Earnings Summary
| Year to 31Dec | Net Profit (NT$M) | DilutedEPS (NT$) | EPSgrowth (%) | P/E (x) | P/B (x) | ROE (%) | Yield (%) |
|---|---|---|---|---|---|---|---|
| 2024A | 1,173,268 | 45.24 | 39.9 | 54.6 | 14.9 | 30.3 | 0.6 |
| 2025A | 1,717,883 | 66.24 | 46.4 | 37.3 | 11.8 | 35.4 | 0.7 |
| 2026E | 2,871,487 | 110.73 | 67.2 | 22.3 | 8.5 | 44.2 | 1.1 |
| 2027E | 3,940,141 | 151.93 | 37.2 | 16.3 | 6.3 | 44.3 | 2 |
| 2028E | 5,374,291 | 207.24 | 36.4 | 11.9 | 4.6 | 44.6 | 2.7 |
Source: Powered by dataCentral
See Appendix A-1 for Analyst Certification, Important Disclosures and Research Analyst Affiliations.
n Buy
Catalyst Watch: Upside, expires 03-AUG-26
| Price (16 Jul 2613:30) | NT$2,470.00 |
|---|---|
| Target price | NT$3,800.00 |
| Expected share price return | 53.8% |
| Expected dividend yield | 2.0% |
| Expected total return | 55.9% |
| MarketCap | NT$64,052,954M |
| US$2,005,352M |
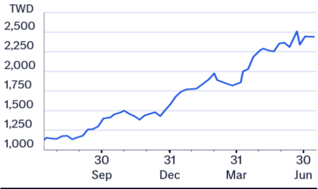
Price Performance (RIC: 2330.TW, BB: 2330 TT)
Laura (Chia Yi) Chen AC
+886-2-8726-9090 laura.cy.chen@citi.com
Jack Chen +886-2-8726-9091 jack1.chen@citi.com
Nicholas Lai +886-2-8726-9093 nicholas.lai@citi.com
Prepared for Kevin Lu
| 2330.TW: Fiscalyearend31-Dec | Price: NT$2,470.00; TP: NT$3,800.00; MarketCap:NT$64,052,954m; Recomm:Buy | Price: NT$2,470.00; TP: NT$3,800.00; MarketCap:NT$64,052,954m; Recomm:Buy | Price: NT$2,470.00; TP: NT$3,800.00; MarketCap:NT$64,052,954m; Recomm:Buy | Price: NT$2,470.00; TP: NT$3,800.00; MarketCap:NT$64,052,954m; Recomm:Buy | Price: NT$2,470.00; TP: NT$3,800.00; MarketCap:NT$64,052,954m; Recomm:Buy | Price: NT$2,470.00; TP: NT$3,800.00; MarketCap:NT$64,052,954m; Recomm:Buy | Price: NT$2,470.00; TP: NT$3,800.00; MarketCap:NT$64,052,954m; Recomm:Buy | Price: NT$2,470.00; TP: NT$3,800.00; MarketCap:NT$64,052,954m; Recomm:Buy | Price: NT$2,470.00; TP: NT$3,800.00; MarketCap:NT$64,052,954m; Recomm:Buy | Price: NT$2,470.00; TP: NT$3,800.00; MarketCap:NT$64,052,954m; Recomm:Buy | Price: NT$2,470.00; TP: NT$3,800.00; MarketCap:NT$64,052,954m; Recomm:Buy |
|---|---|---|---|---|---|---|---|---|---|---|---|
| Profit&Loss(NT$m) | 2024 | 2025 | 2026E | 2027E | 2028E | Valuation ratios | 2024 | 2025 | 2026E | 2027E | 2028E |
| Sales revenue | 2,894,308 | 3,809,054 | 5,557,456 | 7,612,493 | 10,334,364 | PE(x) | 54.6 | 37.3 | 22.3 | 16.3 | 11.9 |
| Cost of sales | -1,269,954 | -1,527,760 | -1,831,089 | -2,393,431 | -3,236,962 | PB(x) | 14.9 | 11.8 | 8.5 | 6.3 | 4.6 |
| Gross profit | 1,624,354 | 2,281,294 | 3,726,366 | 5,219,062 | 7,097,403 | EV/EBITDA(x) | 31.7 | 23.7 | 14.7 | 10.3 | 7.5 |
| Gross Margin (%) | 56.1 | 59.9 | 67.1 | 68.6 | 68.7 | FCFyield (%) | 1.5 | 1.8 | 2.1 | 4.3 | 6.6 |
| EBITDA(Adj) | 1,984,850 | 2,624,188 | 4,177,580 | 5,847,207 | 7,822,719 | Dividend yield (%) | 0.6 | 0.7 | 1.1 | 2.0 | 2.7 |
| EBITDAMargin(Adj) (%) | 68.6 | 68.9 | 75.2 | 76.8 | 75.7 | Payout ratio (%) | 31 | 27 | 25 | 33 | 32 |
| Depreciation | -662,797 | -688,096 | -907,283 | -1,275,986 | -1,602,135 | ROE(%) | 30.3 | 35.4 | 44.2 | 44.3 | 44.6 |
| Amortisation | 0 | 0 | 0 | 0 | 0 | Cashflow(NT$m) | 2024 | 2025 | 2026E | 2027E | 2028E |
| EBIT (Adj) | 1,322,053 | 1,936,092 | 3,270,296 | 4,571,221 | 6,220,583 | EBITDA | 1,984,850 | 2,624,188 | 4,177,580 | 5,847,207 | 7,822,719 |
| EBIT Margin (Adj) (%) | 45.7 | 50.8 | 58.8 | 60.0 | 60.2 | Working capital | 68,257 | 27,877 | -487,017 | -50,975 | -77,672 |
| Net interest | 67,781 | 86,206 | 102,573 | 176,451 | 257,308 | Other | -147,949 | -215,723 | -398,810 | -631,080 | -846,293 |
| Associates | 828 | 2,546 | 2,000 | 2,000 | 2,000 | Operating cashflow | 1,905,157 | 2,436,342 | 3,291,753 | 5,165,152 | 6,898,754 |
| Non-Op/Except/Other Adj | 15,176 | 16,819 | 92,722 | 38,062 | 51,672 | Capex | -956,007 | -1,272,411 | -1,946,765 | -2,410,000 | -2,700,000 |
| Pre-tax profit | 1,405,839 | 2,041,663 | 3,467,591 | 4,787,734 | 6,531,563 | Net acq/disposals | 74,369 | 122,881 | 351,914 | 255,374 | -99,832 |
| Tax | -233,407 | -326,266 | -596,599 | -850,153 | -1,160,765 | Other | 0 | 0 | 0 | 0 | 0 |
| Extraord./Min.Int./Pref.div. | 836 | 2,486 | 495 | 2,560 | 3,492 | Investing cashflow | -881,638 | -1,149,530 | -1,594,851 | -2,154,626 | -2,799,832 |
| Reported net profit | 1,173,268 | 1,717,883 | 2,871,487 | 3,940,141 | 5,374,291 | Dividends paid | -363,055 | -466,779 | -716,556 | -1,290,185 | -1,698,226 |
| Net Margin (%) | 40.5 | 45.1 | 51.7 | 51.8 | 52.0 | Financing cashflow | -313,242 | -590,737 | -668,428 | -1,242,861 | -1,634,399 |
| CoreNPAT | 1,173,268 | 1,717,883 | 2,871,487 | 3,940,141 | 5,374,291 | Net change in cash | 627,147 | 615,273 | 937,546 | 1,676,736 | 2,373,594 |
| Per share data | 2024 | 2025 | 2026E | 2027E | 2028E | Free cashflow to s/holders | 949,151 | 1,163,931 | 1,344,988 | 2,755,152 | 4,198,754 |
| Reported EPS($) | 45.24 | 66.24 | 110.73 | 151.93 | 207.24 | ||||||
| Core EPS($) | 45.24 | 66.24 | 110.73 | 151.93 | 207.24 | ||||||
| DPS($) | 14.00 | 18.00 | 27.63 | 49.75 | 65.48 | ||||||
| CFPS($) | 73.46 | 93.95 | 126.93 | 199.17 | 266.02 | ||||||
| FCFPS($) | 36.60 | 44.88 | 51.86 | 106.24 | 161.91 | ||||||
| BVPS($) | 165.37 | 208.98 | 292.08 | 394.26 | 536.01 | ||||||
| Wtdavgordshares(m) | 25,934 | 25,933 | 25,933 | 25,933 | 25,933 | ||||||
| Wtdavgdiluted shares (m) | 25,934 | 25,933 | 25,933 | 25,933 | 25,933 | ||||||
| Growthrates | 2024 | 2025 | 2026E | 2027E | 2028E | ||||||
| Sales revenue (%) | 33.9 | 31.6 | 45.9 | 37.0 | 35.8 | ||||||
| EBIT (Adj) (%) | 43.5 | 46.4 | 68.9 | 39.8 | 36.1 | ||||||
| CoreNPAT(%) | 39.9 | 46.4 | 67.2 | 37.2 | 36.4 | ||||||
| CoreEPS(%) | 39.9 | 46.4 | 67.2 | 37.2 | 36.4 | ||||||
| BalanceSheet(NT$m) | 2024 | 2025 | 2026E | 2027E | 2028E | ||||||
| Cash&cashequiv. | 2,127,627 | 2,767,856 | 3,647,049 | 5,156,956 | 7,297,559 | ||||||
| Accounts receivables | 272,088 | 281,791 | 649,716 | 756,322 | 1,023,840 | ||||||
| Inventory | 287,869 | 288,109 | 478,000 | 554,567 | 748,174 | ||||||
| Net fixed &other tangibles | 3,235,771 | 3,691,841 | 4,524,195 | 5,654,033 | 7,168,157 | ||||||
| Goodwill &intangibles | 0 | 0 | 0 | 0 | 0 | ||||||
| Financial &other assets | 769,374 | 903,426 | 1,206,858 | 1,338,645 | 1,663,315 | ||||||
| Total assets | 6,692,729 | 7,933,024 | 10,505,820 | 13,460,522 | 17,901,045 | ||||||
| Accounts payable | 74,227 | 84,330 | 115,601 | 117,040 | 172,365 | ||||||
| Short-term debt | 59,858 | 136,926 | 184,064 | 226,267 | 283,109 | ||||||
| Long-term debt | 958,429 | 896,062 | 896,062 | 896,062 | 896,062 | ||||||
| Provisions &other liab | 1,275,849 | 1,354,911 | 1,693,872 | 1,952,416 | 2,601,214 | ||||||
| Total liabilities | 2,368,362 | 2,472,229 | 2,889,599 | 3,191,785 | 3,952,750 | ||||||
| Shareholders' equity | 4,288,545 | 5,419,596 | 7,574,527 | 10,224,483 | 13,900,547 | ||||||
| Minority interests | 35,031 | 41,199 | 41,694 | 44,255 | 47,747 | ||||||
| Total equity | 4,323,576 | 5,460,795 -1,734,869 | 7,616,221 | 10,268,737 | 13,948,295 | ||||||
| Net debt (Adj) | -1,109,340 | -2,566,923 | -4,034,627 | -6,118,388 | |||||||
| Net debt to equity (Adj) (%) | -25.7 | -31.8 | -33.7 | -39.3 | -43.9 | ||||||
| For definitions of the items in this | please click here. |
Prepared for Kevin Lu
Pricing Discipline Preserves Long-Term Relationship -Despite that overseas fabs and N2 ramp will dilute GM, these headwinds are largely offset by stronger advanced-node utilization and manufacturing efficiencies. With 2Q26 gross margin reaching 67.7%, advanced technologies already accounting for 77% of wafer revenue, and 2nm contributing revenue for the first time, TSMC remains well positioned to sustain industry-leading profitability while supporting long-term AI growth. TSMC reiterated that it will not maximize short-term pricing at the expense of customer relationships. We believe TSMC's GM outlook remains resilient thanks to its better efficiency and looking for constructive pricing trend ahead.
Solid position with long term order visibility, reiterate Buy -Reflecting its robust growth trend, better profitability and solid competitive landscape, we lift our earnings projection by 4%/2%/4% for 2026/2027/2028. We keep our TP NT$3,800 unchanged (25x of 2027 EPS estimate), reiterate Buy.
AI Demand Remains the Core Growth Engine, Supporting a Multi-Year Expansion
Key TSMC earnings call recap
n 3Q26 guidance
- -Sales: US$44.6-45.8bn (+12% QoQ at the mid-point)
- -GPM: 65-67% (assuming USDTWD=32)
- -OPM: 56-58%
n 2026 full-year & long-term guidance
- -Full year sales : raise 2026 full-year USD-based sales guidance from more than 30% growth to >40% growth
- -Full year capex : Driven by scaling AI demand across AI accelerator, networking and CPU as well as inflationary cost, TSMC raise 2026 capex from US$52-56bn to US$60-64bn (70-80% advanced process, 10% specialty, 10-20% for advanced packaging, testing and masks)
- -US investment
- TSMC adds additional US$100bn investment for its US Arizona expansion (total investment amount to reach US$265bn)
-GM outlook
- 2H26 GM to be supported by continued productivity improvement, UTR enhancement and optimizing capacity allocation
- N2 ramping in 2H26 to have 3-4ppts GM impact in 2H26
- Oversea fabs expansion to impact GM by 2-3ppts in early stage and 34ppts in later stage
- -Long-term outlook
Prepared for Kevin Lu
- 5-year AI sales CAGR (2024-2029) remains at high-50%
n Mature node comment
- -TSMC will continue to focus on supporting customer's demand, especially for the specialty process in mature node. In JSMC and ESMC fabs, it will continue to increase its mature node capacity to support the local demand
n A14 family process node development
- -A14 is the second generation of nanosheet transistor. Compared to N2, A14 provides 10-15% speed improvement, or 25-30% power consumption improvement, or 20% chips density gains. Strong interest from HPC and smartphone customers. Volume production is scheduled in 2028
- -A13/A12 as the extension of A14 family. A13 achieves >6% die area saving. Both A13 and A12 are scheduled to volume production in 2029
n 2Q26 sales mix by node
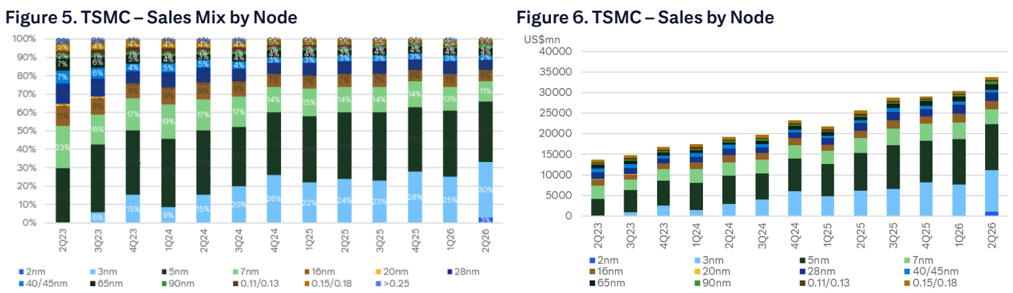
- -2nm: 3% (vs. 0% in 1Q26)
- -3nm: 30% (vs. 25% in 1Q26)
- -5nm: 33% (vs. 36% in 1Q26)
- -7nm: 11% (vs. 13% in 1Q26)
- -Advanced node (<7nm): 77% (vs. 74% in 1Q26)
n 2Q26 sales by applications
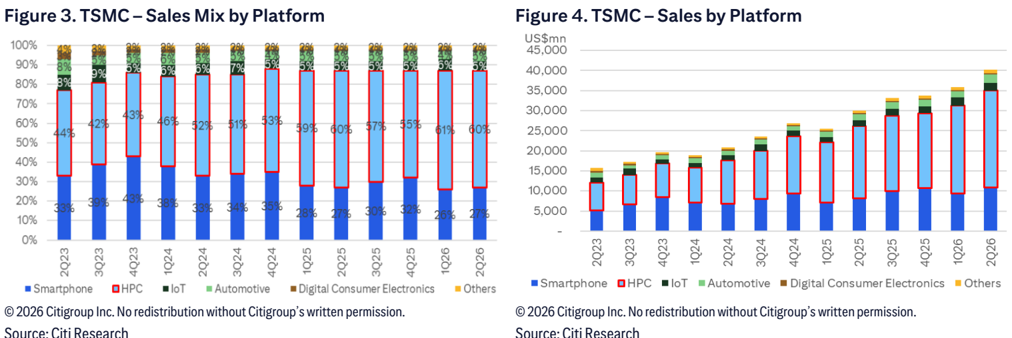
- -HPC (66% of sales), +20 QoQ
- -Mobile (22%), -4% QoQ
- -IoT (5%), +4% QoQ
- -Auto (4%), +15% QoQ
- -DCE (1%), +5% QoQ
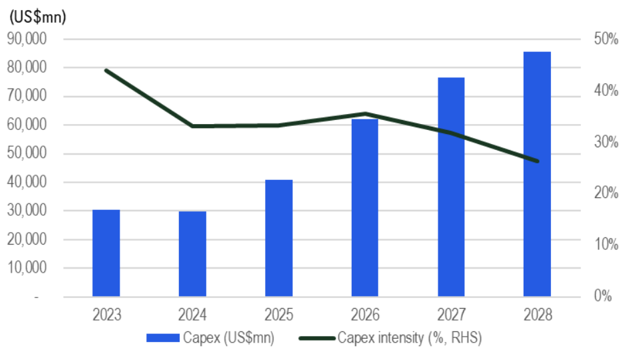
TSMC previously guided its 2026 capex at US$52-56bn in the beginning of the year, and lifted it to the high-end of the guidance in April. And now further upgrade 2026 capex to US$60-64bn with much bigger cycle into next few years
Once again it delivers solid visibility on AI development, emphasizing that customer demand continues to exceed expectations and has strengthened further since the beginning of the year. Management deliberately refrained from raising its previously announced five-year AI accelerator CAGR guidance (high-50% CAGR), not because demand has weakened, but because the current outlook is already materially above the original assumptions. Importantly, TSMC sees the AI semiconductors beyond GPUs to include CPUs, custom AI ASICs, networking chips, and other AI accelerators, indicating that the AI ecosystem is becoming much more diversified. While investors remain concerned about power availability
Figure 1. 15MC - Capex intensity trend
(US$mn)
90,000
80,000
70,000
60,000
50,000
40,000
30,000
20,000
10,000
2023
2024
2025
• Capex (US$mn) |
30%
and data-center construction potentially slowing deployment, TSMC stated that it closely tracks customers' AI infrastructure buildouts - including power, site construction and deployment schedules - before committing capacity. Management therefore remains confident that semiconductor demand will continue to translate into actual deployments rather than idle inventories.
Figure 1. TSMC - Capex intensity trend
— Capex intensity (%, RHS)
C 2026 Citigroun Inc. No redistribution without Citigroun's written permission..
Prepared for Kevin Lu
© 2026 Citigroup Inc. No redistribution without Citigroup's written permission.
Source: Citi Research
Advanced Node Capacity Expansion Accelerates as N3 and N2 Stay Fully Utilized
Despite aggressively raising 2026 capital spending, management acknowledged that supply will likely remain tight for years. TSMC reaffirmed that N2 family capacity is expected to expand at 70% CAGR between 2026 and 2028 or higher, while the N3 family continues growing at an exceptionally strong pace as more AI products migrate toward advanced nodes (see our report of TSMC (2330.TW) Scaling growth through technology, packaging and capacity). TSMC announced an additional US$100bn investment in Arizona, with total investment to reach US$265bn in the coming years.
Advanced Packaging Remains the Primary Bottleneck Despite Aggressive Investment
Investors were also concerned about potential competition from EMIB-T in advanced packaging (see our report of TSMC (2330.TW) - Competitive Landscape Holding Steady). While wafer fabrication continues expanding rapidly, TSMC acknowledged that advanced packaging remains the industry's biggest bottleneck. CoWoS capacity is still unable to fully satisfy customer demand, prompting the company to significantly increase backend investment while simultaneously welcoming alternative packaging technologies that can improve overall ecosystem flexibility. Looking ahead, TSMC confirmed that larger CoWoS formats continue progressing beyond current reticle limits to support increasingly complex AI systems. The company is also working on different variants of advanced packaging, yet CoWoS remains as today's mainstream solution, while
Figure <. ISMC - 2220 results comparison
1Q26
Actual
1,134,103
751,295
66.2%
658,966
58.1%
572,480
22.08
(NT$mn)
Revenue
Gross profit
Gross margin
Op. profit
OP margin
Net income
EPS (NT$)
1,270,381
860,311
67.796
766,603
60.3%
706,562
27.25
Q/Q
12%
15%
+1.5 ppt
16%
+2.2 ppt
23%
23%
© 2026 Citigroup Inc. No redistribution without Citigroup's written permission.
Prepared for Kevin Lu
2Q26
Guidance
US$39-40.2bn
65.5-67.5%
56.5-58.5%
2Q26
Citi
1,239,647
832,158
67.1%
720,590
Diff.
2%
3%
+0.6 ppt
676
2Q26
Cons
1,264,538
846,140
66.9%
740,699
3Q26
Diff.
Guidance
0% US$44.6-45.8bn
2%
+0.8 ppt
3%
Citi
Prior Est.
1,454,424
980,602
67.4%
847,680
Cons
1,375,834
902,134
65.6%
786,801
alternative approaches are under active development with substrate partners. Pilot production lines are currently being established, with management expecting roughly another year of maturation before customer production becomes feasible. Despite TSMC not disclosing packaging capex because frontend, packaging and testing investments continually shift depending on evolving manufacturing bottlenecks, advanced packaging investment will remain elevated for several years.
Pricing Discipline Supports Sustainable Gross Margins Rather Than Short-Term Maximization
On profitability, TSMC presented a remarkably disciplined philosophy despite operating in one of the industry's strongest demand environments. Although investors questioned why foundry GM should trail those recently reported by leading memory manufacturers, management made clear that maximizing shortterm margins is not the company's objective. Instead, TSMC aims to earn sufficient returns to continuously reinvest in technology leadership and capacity expansion while ensuring customers to remain competitive. As advanced-node complexity increases and AI demand remains robust, we believe TSMC's pricing power will naturally strengthen, we therefore expect TSMC's GM should remain resilient supported by favorable product mix, advanced-node migration, and premium packaging technologies despite the dilution from the most advanced node rampup and overseas dilution.
Solid position with long term order visibility, reiterate Buy
Overall, the company's message was unequivocal: AI demand remains significantly stronger than supply, advanced-node utilization should remain exceptionally high across both N3 and N2, advanced packaging will continue constraining industry growth, and TSMC's disciplined investment, pricing and technology strategies position it to sustain leadership throughout the remainder of this decade.
Reflecting its robust growth trend, better profitability and solid competitive landscape, we lift our earnings projection by 4%/2%/4% for 2026/2027/2028. We also lift our capex to US$62bn/77bn/86bn for 2026/2027/2028. We keep our TP NT$3,800 unchanged (25x of 2027 EPS estimate), reiterate Buy.
Figure 2. TSMC - 2Q26 results comparison
© 2026 Citigroup Inc. No redistribution without Citigroup's written permission.
Source: Citi Research, Bloomberg, Company Reports
65-67%
Figure s. loMe - sales Mix by Node
Figure 3. 1SMC - Sales Mix by Platform
100%
90%
100%
90%
80%
80%
70%
70%
60%
60%
50%
50%
40%
40%
30%
30%
20%
20%
10%
0%|
10%
0%
• 2nml
• 40/45nml
• Smartphone
@ 2026 Citigroun Inc. No redistribution without Citigroun's written nermission.
@ 2026 Citigroun Inc. No redistribution without Citigroun's written nermission.
Source: Citi Research
0911
13%
61%
259
26%
14%
60%
5 49
27%
5%
15%,
59%
22%
28%
Figure 4. 15MC - Sales by Platform
Figure o. loMe - sales by Node
US$mn|
40000
45,000
US$mn|
35000
40,000
30000
35,000
25000
30,000
20000
25,000
15000
20,000
15,000
10000
10,000
5000
5,000
14%
$7%
23%
3
10%
4%
$5%
289
32%
5%
14%
53%
2,691
35
17%1
$2%
15%
33%
7%
17%
$1%
34%
46%
19%
38%
43%
117931
43%
159
2Q23
Source: Citi Research
© 2026 Citigroup Inc. No redistribution without Citigroup's written permission.
Source: Citi Research, company data
© 2026 Citigroup Inc. No redistribution without Citigroup's written permission.
Source: Citi Research, company data
Figure 7. TSMC - Estimates Revisions
| 2026E | 2026E | 2026E | 2027E | 2027E | 2027E | 2028E | 2028E | 2028E | |
|---|---|---|---|---|---|---|---|---|---|
| (NT$mn) | New | Old | Chg. | New | Old | Chg. | New | Old | Chg. |
| Sales | 5,557,456 | 5,494,192 | 1.2% | 7,612,493 | 7,599,082 | 0.2% | 10,334,364 | 10,069,949 | 2.6% |
| YoYgrowth | 45.9% | 44.2% | 37.0% | 38.3% | 35.8% | 32.5% | |||
| Gross profit | 3,726,366 | 3,689,713 | 1.0% | 5,219,062 | 5,136,615 | 1.6% | 7,097,403 | 6,833,525 | 3.9% |
| Opex | 456,070 | 478,431 | -4.7% | 647,841 | 665,749 | -2.7% | 876,819 | 883,046 | -0.7% |
| Operating profit | 3,270,296 | 3,211,282 | 1.8% | 4,571,221 | 4,470,866 | 2.2% | 6,220,583 | 5,950,480 | 4.5% |
| Pre-tax profit | 3,467,591 | 3,340,143 | 3.8% | 4,787,734 | 4,683,755 | 2.2% | 6,531,563 | 6,251,579 | 4.5% |
| Net income | 2,871,487 | 2,752,835 | 4.3% | 3,940,141 | 3,855,921 | 2.2% | 5,374,291 | 5,145,557 | 4.4% |
| EPS(NT$) | 110.73 | 106.15 | 4.3% | 151.93 | 148.69 | 2.2% | 207.24 | 198.42 | 4.4% |
| Gross margin | 67.1% | 67.2% | -0.1 ppt | 68.6% | 67.6% +1.0 ppt | 67.6% +1.0 ppt | 68.7% | 67.9%+0.8ppt | 67.9%+0.8ppt |
| Opexratio | 8.2% | 8.7% | -0.5 ppt | 8.5% | 8.8% -0.3 ppt | 8.8% -0.3 ppt | 8.5% | 8.8% -0.3 ppt | 8.8% -0.3 ppt |
| Operating margin | 58.8% | 58.4% | +0.4 ppt | 60.0% | 58.8% +1.2 ppt | 58.8% +1.2 ppt | 60.2% | 59.1% +1.1 | ppt |
| Net margin | 51.7% | 50.1% | +1.6 ppt | 51.8% | 50.7% +1.0 ppt | 50.7% +1.0 ppt | 52.0% | 51.1%+0.9 | ppt |
© 2026 Citigroup Inc. No redistribution without Citigroup's written permission.
Source: Citi Research
Prepared for Kevin Lu
8%
8%
7%
7%
3%
44%
23%
33%
42%
16%|
39%
11%
60%
3094
3Q25
4Q25
Figure 10. I5MC - Forecast summary
Figure 8. 15MC - Forward P/E band
NT$
Unit: NT$bn
3000
Revenue
COGS
2500
Gross Profit
Operating Expense
2000
SG&A expenses
R&D expenses
1500
EBIT
1000
500
Pre Tax Profit
Tax Expense/(Credit)
Net Profit
0
EPS (NT$)
Margins (%)
2010
- TSMC
Gross Margin
Operating Margin
© 2026 Citigroup Inc. No redistribution without Citigroup's written permission.
Net Margin
Sequential Growth (%)
Revenue
Gross Profit
EBIT
Net Profit
EPS
Prepared for Kevin Lu
2025
20
933.8
-386.4
547.4
-84.5
-23.2
-61.3
463.4
30
989.9
-401.4
588.5
-87.8
-24.0
-63.7
1Q
1,134.1
-382.8
751.3
-94.0
-26.2
-67.8
659.0
2026
2Q
1,270.4
-410.1
860.3
-99.0
-25.8
-73.1
766.6
Figure 9. 15MC - Forward P/B band & ROE
NT$
3QE
3000
1,459.1
4QE
1,693.9
-485.5
2500
-552.8
973.6
-126.1
2000
-32.1
-94.0
1500
847.6
1,141.2
-144.0
-42.3
-101.6
997.2
1QE
1,764.1
-548.9
1,215.2
-146.7
-40.8
-105.8
1,068.5
3QE
1,944.9
-613.9
1,331.0
-163.4
-42.8
-120.6
1,167.6
4QE
1,971.8
-615.3
1,356.5
-177.5
-49.3
-128.2
1,179.1
2025
3,809.1
-1,527.8
2,281.3
-345.2
-99.2
-246.4
1,936.1
2026E
5,557.5
-1,831.1
3,726.4
-456.1
-126.5
-336.5
3,270.3
ROE
2027E
7,612.5
-2,393.4
-3,237.0
5,219.1
-647.8
-177.3
-470.5
4,571.2
-345.9
493.4
-85.2
-28.6
-56.5
407.1
40%
7,097.4
-876.8
-238.1
-638.7
35%
30%
6,220.6
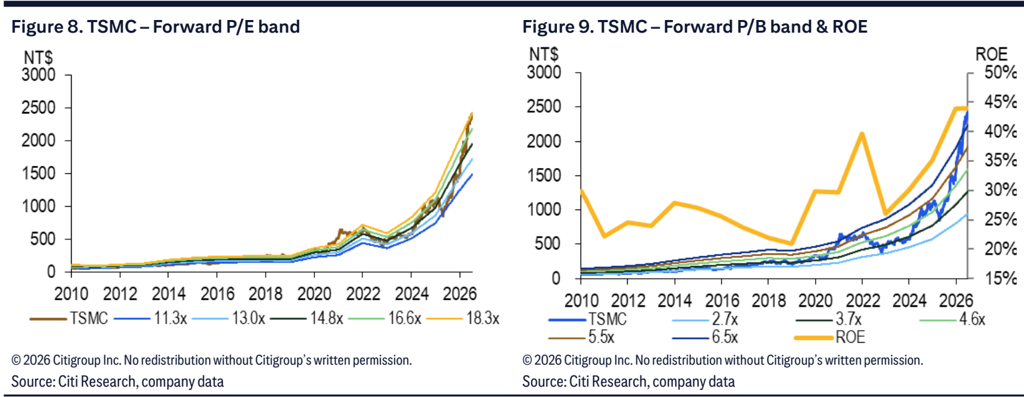
Figure 10. TSMC - Forecast Summary
© 2026 Citigroup Inc. No redistribution without Citigroup's written permission.
Source: Citi Research, company data
500.7
4Q
Prepared for Kevin Lu
Catalyst Watch on TSMC (2330.TW)
Direction:
Upside
Duration:
Within 30 Days (expires 03 Aug 2026)
Date Added:
03 Jul 2026
Catalyst:
Earnings
TSMC will host 2Q26 analyst meeting on July 16. We open a 30-day upside catalyst watch as we expect the company to further lift its revenue growth target for 2026 and long term revenue CAGR given sustained leading-edge demand and improving visibility in the longer term.
NT$
4,002
3,335
2,668
2,001
1,334
667
Jul 25
° Higher-than-expected utilization
4 62% Upside
NT$ 3,800.00
• 54% Upside
Bull/Bear: TSMC (2330.TW)
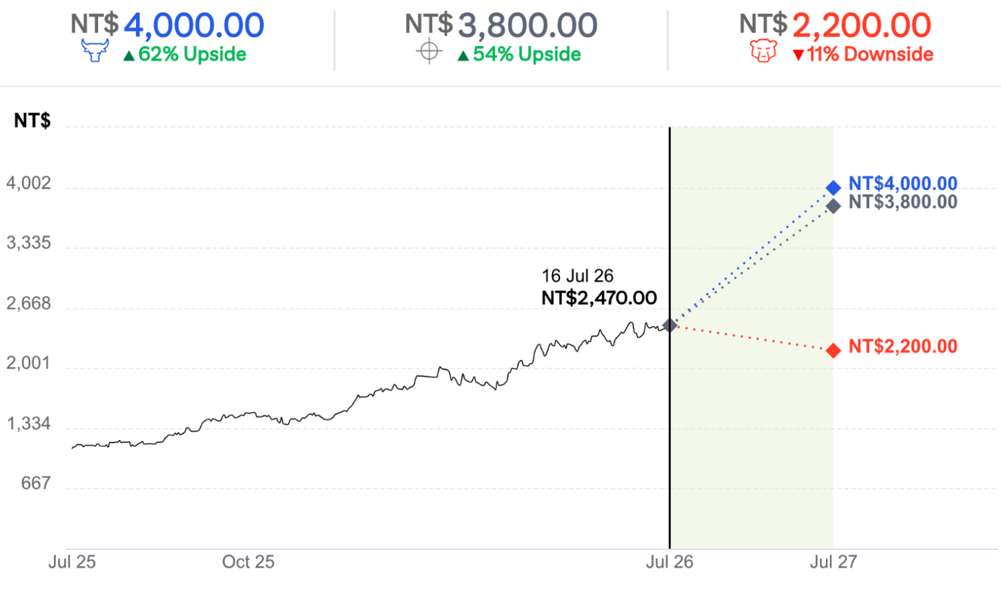
• Bull case TP to be based on its upcycle valuation of 27x PER
BASE Assumptions
- Solid sales CAGR of >35% in 2025-2028E
- GPM to be maintained above 60% level
- BEAR Assumptions
• Weaker-than-expected HPC demand globally
- Worse-than-expected margin contraction
• Bear case TP to be based on its valuation of 15x PER
Prepared for Kevin Lu
NT$ 2,200.00
• 11% Downside
Prepared for Kevin Lu
TSMC
Company description
TSMC is the founder and leader of the dedicated IC foundry segment. The company has built its reputation by offering advanced and "more-thanMoore" wafer production processes and unparalleled manufacturing efficiency. From its inception in 1987, TSMC has consistently offered the foundry segment's leading technologies and TSMC-compatible design services.
Investment strategy
We rate TSMC shares as Buy. We expect TSMC to deliver sales growth of >35% in recent years thanks to strong growth from HPC/AI as well as stable demand growth from smartphone, IoT, and automotive on tech migration and a shortened replacment cycle. CPU outsourcing to TSMC offers further growth upside potential. A rising cash dividend should also support the share price. While TSMC has been increasing capex meaningfully since 2009, its cost structure is maintained through continuous product mix improvements, efficiency enhancements, and cost reductions.
Valuation
Our target price for TSMC shares of NT$3,800 is based on 25x the average of our 2027E EPS, higher than its three-year average forward PER, versus global peers' average of 15-23x. We believe our PER target is justified by TSMC's leading position in advanced process node and robust AI demand growth outlook. Given its continuing leadership in the semiconductor foundry industry, we believe TSMC's stable order visibility and earnings outlook make it less vulnerable than peers to a potential global economic downturn. Our target price equates to 2026E/27E P/E of 34x/25x and 2026E/27E P/B of 13x/10x.
Risks
Key downside risks that could impede the shares from achieving our target price include: 1) weakness in the global semiconductor market; 2) largerthan-expected margin contractions due to depreciation cost hikes and strong NTD; 3) competitors entering the foundry business; 4) longer-than-expected digestion of inventory in the supply chain; and 5) a slowdown in demand either from a global economic downturn or a global trade disruption triggered by tariffs.
Analyst: Laura (Chia Yi) Chen
Prepared for Kevin Lu
TWD
2,000
1,000
If you are visually impaired and would like to speak to a Citi representative regarding the details of the graphics in this document, please call USA 1-888-500-5008 (TTY: 711), from outside the US +1-210-677-3788
Date
Appendix A-1
- 09-Apr-24 10:09:45
1|
*950.00
819.00
[10] 17-Apr-25 10:33:27
*1,030.00
804.00