PDF 原檔:260622_8046_南電_daiwa_NYPCB_original.pdf
原始內容
Taiwan
22 June 2026
Nan Ya Printed Circuit Board Corp (8046 TT)
5
Daiwa
3
2
1
→
Buy
Sheng Cheng (886) 2 8758 6253 sheng.cheng@daiwacm-cathay.com.tw
Allan Wang
(886) 2 8758 6249 allan.wang@daiwacm-cathay.com.tw
Forecast revisions (%)
| Year to 31 Dec | 26E | 27E | 28E |
|---|---|---|---|
| Revenue change | (1.9) | 19.8 | 30.1 |
| Net profit change | 10.8 | 32.5 | 49.1 |
| Core EPS (FD) change | 10.8 | 32.5 | 49.1 |
Source: Daiwa forecasts
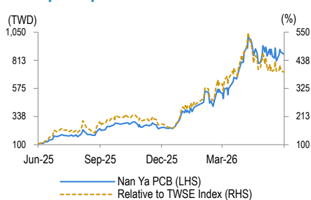
Share price performance
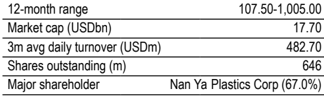
| 12-month range | 107.50-1,005.00 |
|---|---|
| Market cap (USDbn) | 17.70 |
| 3m avg daily turnover (USDm) | 482.70 |
| Shares outstanding (m) | 646 |
| Major shareholder | Nan Ya Plastics Corp (67.0%) |
Financial summary (TWD)
| Year to 31 Dec | 26E | 27E | 28E |
|---|---|---|---|
| Revenue (m) | 58,494 | 102,461 | 138,301 |
| Operating profit (m) | 12,367 | 36,180 | 62,239 |
| Net profit (m) | 10,600 | 29,979 | 51,319 |
| Core EPS (fully-diluted) | 16.405 | 46.395 | 79.421 |
| EPS change (%) | 444.5 | 182.8 | 71.2 |
| Daiwa vs Cons. EPS (%) | 16.1 | 44.6 | 57.3 |
| PER (x) | 52.7 | 18.6 | 10.9 |
| Dividend yield (%) | 0.9 | 2.7 | 4.6 |
| DPS | 8.2 | 23.2 | 39.7 |
| PBR (x) | 10.0 | 7.0 | 4.8 |
| EV/EBITDA (x) | 27.8 | 12.3 | 7.2 |
| ROE (%) | 20.8 | 44.2 | 52.2 |
Source: FactSet, Daiwa forecasts
Target price:
TWD1,444.00 (from TWD1,222.00)
Share price (22 Jun):
TWD864.00 | Up/downside: +67.1%
Stronger-than-expected margin profile
- Margin set to beat expectations on cost inflation and capacity shortage
- Likely no meaningful capacity expansion until end-2028
- Reaffirming our Buy (1) rating; raising 12M TP to TWD1,444
What's new: ABF substrate QTD price levels are tracking stronger than our estimates, leading us to adjust up our gross margins accordingly.
What's the impact: Stronger-than-expected price hike for substrate in 2Q26E. Based on the feedback from the supply chain, we believe the ABF/BT substrate shortage has turned more fierce over the past 3 months given the resilient AI server demand and the rising demand from generalpurpose server demand since early-2026 driven by agentic AI. In 2026E, the components will likely see the highest shortage levels within the supply chain should remain high-end foundry capacity, memory, substrate, and PCB, based on the feedback within our coverage. Besides, we highlight the AI data centre outlook has turned more promising given recent positive developments at AI companies. Compute providers believe they can lease all computing power they build to end customers in the near term, which we believe will trigger strong inflation in key component prices over our forecast horizon. We believe substrates will be one of the sectors to ride on this mega cost inflation trend. One of NYPCB's key competitors stated it plans to hike prices quarterly by 7-8% in 2H26 (vs. previous comment of 58%). We believe this supports our view that the pricing environment has recently turned more positive vs. our original expectation. We believe NYPCB has room to hike its ASP more than this competitor, supported by its business strategy. Based on our analysis, NYPCB likely won't significantly expand its capacity before 2028, and we note NYPCB's client base is broader than its global peers (ie, revenue derived more from smaller clients vs. peers). As such, we forecast its price hikes for ABF/BT substrate will be larger than its competitors over 2026-28E. If we look back to previous substrate upcycles when ABF/BT substrate gross margins hit c.50/30% levels, the historical record could be broken this time considering two sequential price hikes in 2026E. The first was triggered by component shortages, and the second will likely be driven by substrate capacity shortage from 2H26. As such, we lift our GM assumptions over our forecast period by 2.6-5.3pp to factor in the favourable pricing trend. GM in 2Q26E should come in at 21.3%, higher than the market consensus of 18-20%.
What we recommend: We raise our 2026-28E EPS by 11-49% to factor in higher-than-expected price hikes from both raw materials and substrates. We reaffirm our Buy (1) call and raise our 12-month TP to TWD1,444 (from TWD1,222), based on an unchanged target PER multiple of 49x applied to our 1-year-forward EPS. We view our target PER multiple as undemanding as 2026-28E PEG (EPS CAGR at 120%) comes in at only 0.4x. Downside risks: weaker-than-expected demand for switches/PCs/smartphones.
How we differ: Our 2026-28E EPS are 16-57% higher than Bloomberg consensus due likely to our more bullish view on the ABF/BT ASP increase.
Nan Ya Printed Circuit Board Corp (8046 TT): 22 June 2026
NYPCB: Daiwa revenue and earnings forecasts revisions vs. the consensus
| 2026E | 2026E | 2026E | 2027E | 2027E | 2027E | 2028E | 2028E | 2028E | |
|---|---|---|---|---|---|---|---|---|---|
| (TWDm) | Previous | New | Consensus | Previous | New | Consensus | Previous | New | Consensus |
| Revenue | 59,652 | 58,494 | 58,299 | 85,536 | 102,461 | 85,543 | 106,264 | 138,301 | 118,941 |
| Diff (%) | -1.9% | 0.3% | 19.8% | 19.8% | 30.1% | 16.3% | |||
| Gross Margin (%) | 21.5% | 24.0% | 20.6% | 34.0% | 37.1% | 29.0% | 41.1% | 46.4% | 30.5% |
| Operating profit | 11,104 | 12,367 | 10,059 | 27,199 | 36,180 | 23,431 | 41,597 | 62,239 | 38,656 |
| Op Margin (%) | 18.6% | 21.1% | 17.3% | 31.8% | 35.3% | 27.4% | 39.1% | 45.0% | 32.5% |
| t profit | 9,566 | 10,600 | 9,128 | 22,624 | 29,979 | 20,735 | 34,417 | 51,319 | 32,620 |
| EPS (TWD) | 14.80 | 16.41 | 14.13 | 35.01 | 46.39 | 32.09 | 53.26 | 79.42 | 50.48 |
| Diff (%) | 10.8% | 16.1% | 32.5% | 44.6% | 49.1% | 57.3% |
Source: Bloomberg, Daiwa forecasts
NYPCB: quarterly and annual P&L statement
| 2026E | 2026E | 2026E | 2026E | 2027E | 2027E | 2027E | 2027E | 2025 | 2026E | 2027E | 2028E | |
|---|---|---|---|---|---|---|---|---|---|---|---|---|
| (TWDm) | 1Q | 2QE | 3QE | 4QE | 1QE | 2QE | 3QE | 4QE | ||||
| Net revenue | 11,177 | 13,083 | 16,203 | 18,032 | 19,723 | 23,764 | 28,977 | 29,996 | 40,173 | 58,494 | 102,461 | 138,301 |
| COGS | (9,406) | (10,290) | (11,899) | (12,833) | (13,340) | (15,296) | (18,095) | (17,730) | (36,526) | (44,428) | (64,461) | (74,123) |
| Gross profit | 1,771 | 2,793 | 4,303 | 5,199 | 6,383 | 8,468 | 10,883 | 12,267 | 3,647 | 14,066 | 38,000 | 64,179 |
| Operating expenses | (419) | (425) | (425) | (430) | (440) | (450) | (460) | (470) | 1,665 | 1,699 | 1,820 | 1,940 |
| Operating profit | 1,352 | 2,368 | 3,878 | 4,769 | 5,943 | 8,018 | 10,423 | 11,797 | 1,982 | 12,367 | 36,180 | 62,239 |
| Non-operating profit | 246 | 112 | 110 | 111 | 106 | 106 | 108 | 111 | 363 | 579 | 432 | 436 |
| Pre-tax profit | 1,598 | 2,480 | 3,988 | 4,880 | 6,049 | 8,125 | 10,531 | 11,908 | 2,346 | 12,946 | 36,612 | 62,675 |
| Net profit | 1,309 | 2,030 | 3,266 | 3,996 | 4,953 | 6,653 | 8,623 | 9,750 | 1,947 | 10,600 | 29,979 | 51,319 |
| Net EPS (TWD) | 2.03 | 3.14 | 5.05 | 6.18 | 7.67 | 10.30 | 13.34 | 15.09 | 3.0 | 16.4 | 46.4 | 79.4 |
| Operating Ratios | ||||||||||||
| Gross margin | 15.8% | 21.3% | 26.6% | 28.8% | 32.4% | 35.6% | 37.6% | 40.9% | 9.1% | 24.0% | 37.1% | 46.4% |
| Operating margin | 12.1% | 18.1% | 23.9% | 26.4% | 30.1% | 33.7% | 36.0% | 39.3% | 4.9% | 21.1% | 35.3% | 45.0% |
| Pre-tax margin | 14.3% | 19.0% | 24.6% | 27.1% | 30.7% | 34.2% | 36.3% | 39.7% | 5.8% | 22.1% | 35.7% | 45.3% |
| Net margin | 11.7% | 15.5% | 20.2% | 22.2% | 25.1% | 28.0% | 29.8% | 32.5% | 4.8% | 18.1% | 29.3% | 37.1% |
| YoY (%) | ||||||||||||
| Net revenue | 32% | 37% | 48% | 62% | 76% | 82% | 79% | 66% | 24% | 46% | 75% | 35% |
| Gross profit | 312% | 263% | 310% | 272% | 260% | 203% | 153% | 136% | 920% | 286% | 170% | 69% |
| Operating profit | 3986% | 547% | 525% | 395% | 339% | 239% | 169% | 147% | -257% | 524% | 193% | 72% |
| Pre-tax profit | 524% | -1194% | 340% | 246% | 278% | 228% | 164% | 144% | 1338% | 452% | 183% | 71% |
| Net profit | 531% | -1183% | 351% | 232% | 278% | 228% | 164% | 144% | 856% | 445% | 183% | 71% |
| QoQ (%) | ||||||||||||
| Net revenue | 0% | 17% | 24% | 11% | 9% | 20% | 22% | 4% | ||||
| Gross profit | 27% | 58% | 54% | 21% | 23% | 33% | 29% | 13% | ||||
| Operating profit | 40% | 75% | 64% | 23% | 25% | 35% | 30% | 13% | ||||
| Pre-tax profit | 13% | 55% | 61% | 22% | 24% | 34% | 30% | 13% | ||||
| Net profit | 9% | 55% | 61% | 22% | 24% | 34% | 30% | 13% |
Source: Company, Daiwa forecasts
NYPCB: 1-year-forward PER bands
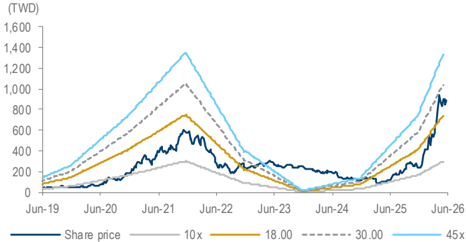
Source: TEJ, Daiwa forecasts
NYPCB: revenue breakdown by product
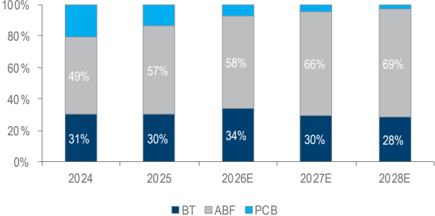
Source: Company, Daiwa forecasts
Daiwa
Financial summary
Key assumptions
| Year to 31 Dec | 2021 | 2022 | 2023 | 2024 | 2025 | 2026E | 2027E | 2028E |
|---|---|---|---|---|---|---|---|---|
| Global PC shipment (m) | 361 | 301 | 260 | 263 | 287 | 244 | 244 | 244 |
| Regular server shipment (m) | 14 | 15 | 12 | 14 | 16 | 18 | 22 | 26 |
| Global smartphone shipment (m) | 1,655 | 1,437 | 1,380 | 1,437 | 1,429 | 1,249 | 1,255 | 1,300 |
Profit and loss (TWDm)
| Year to 31 Dec | 2021 | 2022 | 2023 | 2024 | 2025 | 2026E | 2027E | 2028E |
|---|---|---|---|---|---|---|---|---|
| ABF | 25,805 | 38,250 | 25,758 | 15,797 | 22,701 | 34,164 | 67,645 | 94,844 |
| BT | 15,987 | 16,905 | 9,393 | 9,880 | 12,153 | 19,901 | 30,475 | 39,203 |
| Other Revenue | 10,437 | 9,492 | 7,101 | 6,606 | 5,320 | 4,429 | 4,341 | 4,254 |
| Total Revenue | 52,228 | 64,647 | 42,253 | 32,283 | 40,173 | 58,494 | 102,461 | 138,301 |
| Other income | 0 | 0 | 0 | 0 | 0 | 0 | 0 | 0 |
| COGS | (37,346) | (38,779) | (34,075) | (31,926) | (36,526) | (44,428) | (64,461) | (74,123) |
| SG&A | (2,012) | (2,293) | (1,847) | (1,624) | (1,665) | (1,699) | (1,820) | (1,940) |
| Other op.expenses | 0 | 0 | 0 | 0 | 0 | 0 | 0 | 0 |
| Operating profit | 12,871 | 23,575 | 6,330 | (1,267) | 1,982 | 12,367 | 36,180 | 62,239 |
| Net-interest inc./(exp.) | (32) | (22) | (19) | (18) | (14) | (15) | (15) | (15) |
| Assoc/forex/extraord./others | 257 | 1,809 | 796 | 1,447 | 377 | 594 | 446 | 451 |
| Pre-tax profit | 13,095 | 25,362 | 7,107 | 163 | 2,346 | 12,946 | 36,612 | 62,675 |
| Tax | (2,514) | (5,946) | (1,290) | 41 | (399) | (2,346) | (6,634) | (11,356) |
| Min. int./pref. div./others | 0 | 0 | 0 | 0 | 0 | 0 | 0 | 0 |
| Net profit (reported) | 10,582 | 19,416 | 5,817 | 204 | 1,947 | 10,600 | 29,979 | 51,319 |
| Net profit (adjusted) | 10,582 | 19,416 | 5,817 | 204 | 1,947 | 10,600 | 29,979 | 51,319 |
| EPS (reported)(TWD) | 16.376 | 30.047 | 9.002 | 0.315 | 3.013 | 16.405 | 46.395 | 79.421 |
| EPS (adjusted)(TWD) | 16.376 | 30.047 | 9.002 | 0.315 | 3.013 | 16.405 | 46.395 | 79.421 |
| EPS (adjusted fully-diluted)(TWD) | 16.376 | 30.047 | 9.002 | 0.315 | 3.013 | 16.405 | 46.395 | 79.421 |
| DPS (TWD) | 10.000 | 18.000 | 5.500 | 1.000 | 1.000 | 8.203 | 23.197 | 39.711 |
| EBIT | 12,871 | 23,575 | 6,330 | (1,267) | 1,982 | 12,367 | 36,180 | 62,239 |
| EBITDA | 16,505 | 27,919 | 12,226 | 5,193 | 8,876 | 19,468 | 42,571 | 67,990 |
Cash flow (TWDm)
| Year to 31 Dec | 2021 | 2022 | 2023 | 2024 | 2025 | 2026E | 2027E | 2028E |
|---|---|---|---|---|---|---|---|---|
| Profit before tax | 13,095 | 25,362 | 7,107 | 163 | 2,346 | 12,946 | 36,612 | 62,675 |
| Depreciation and amortisation | 3,634 | 4,344 | 5,896 | 6,460 | 6,894 | 7,101 | 6,391 | 5,752 |
| Tax paid | (2,514) | (5,946) | (1,290) | 41 | (399) | (2,346) | (6,634) | (11,356) |
| Change in working capital | (2,337) | (2,805) | 7,510 | (1,779) | (3,218) | (6,153) | (10,845) | (5,594) |
| Other operational CF items | 4,050 | 11,352 | (2,709) | (2,725) | (2,596) | 0 | 0 | 0 |
| Cash flow from operations | 15,929 | 32,307 | 16,513 | 2,160 | 3,027 | 11,548 | 25,524 | 51,477 |
| Capex | (8,451) | (16,922) | (11,779) | (2,379) | (2,422) | (2,543) | (2,416) | (2,295) |
| Net (acquisitions)/disposals | 0 | 0 | 0 | 0 | 0 | 0 | 0 | 0 |
| Other investing CF items | 3,061 | 53 | (471) | (223) | 700 | 7 | 24 | 15 |
| Cash flow from investing | (5,391) | (16,869) | (12,251) | (2,602) | (1,723) | (2,537) | (2,393) | (2,280) |
| Change in debt | 983 | (1,981) | 0 | 0 | 0 | 0 | 0 | 0 |
| Net share issues/(repurchases) | 0 | 0 | 0 | 0 | 0 | 0 | 0 | 0 |
| Dividends paid | (2,197) | (6,462) | (11,631) | (3,554) | (646) | (646) | (5,300) | (14,989) |
| Other financing CF items | (1,678) | (222) | (180) | (289) | (241) | (413) | 0 | 0 |
| Cash flow from financing | (2,892) | (8,665) | (11,811) | (3,843) | (887) | (1,059) | (5,300) | (14,989) |
| Forex effect/others | (25) | 76 | (166) | 436 | (309) | (72) | (76) | (85) |
| Change in cash | 7,621 | 6,850 | (7,714) | (3,849) | 109 | 7,881 | 17,755 | 34,122 |
| Free cash flow | 7,478 | 15,386 | 4,734 | (219) | 605 | 9,005 | 23,108 | 49,181 |
Source: FactSet, Daiwa forecasts
Nan Ya Printed Circuit Board Corp (8046 TT): 22 June 2026
Daiwa
Financial summary continued …
Balance sheet (TWDm)
| Year to 31 Dec | 2021 | 2022 | 2023 | 2024 | 2025 | 2026E | 2027E | 2028E |
|---|---|---|---|---|---|---|---|---|
| Cash & short-term investment | 13,194 | 20,044 | 12,567 | 8,587 | 8,706 | 16,587 | 34,342 | 68,465 |
| Inventory | 5,348 | 5,803 | 3,896 | 4,101 | 5,068 | 6,680 | 9,214 | 9,435 |
| Accounts receivable | 11,062 | 14,893 | 6,898 | 6,996 | 9,552 | 15,729 | 25,915 | 31,598 |
| Other current assets | 572 | 570 | 1,113 | 991 | 296 | 296 | 296 | 296 |
| Total current assets | 30,176 | 41,310 | 24,474 | 20,675 | 23,623 | 39,292 | 69,768 | 109,794 |
| Fixed assets | 25,668 | 39,926 | 45,476 | 41,804 | 37,085 | 32,527 | 28,553 | 25,097 |
| Goodwill & intangibles | 0 | 0 | 0 | 0 | 0 | 0 | 0 | 0 |
| Other non-current assets | 502 | 514 | 487 | 460 | 500 | 494 | 470 | 455 |
| Total assets | 56,345 | 81,750 | 70,437 | 62,938 | 61,207 | 72,313 | 98,791 | 135,346 |
| Short-term debt | 1,669 | 0 | 0 | 0 | 0 | 0 | 0 | 0 |
| Accounts payable | 6,710 | 8,895 | 5,808 | 3,672 | 3,979 | 5,614 | 7,490 | 7,800 |
| Other current liabilities | 2,137 | 4,794 | 3,292 | 2,992 | 3,210 | 3,210 | 3,210 | 3,210 |
| Total current liabilities | 10,516 | 13,689 | 9,100 | 6,664 | 7,189 | 8,825 | 10,700 | 11,010 |
| Long-term debt | 227 | 0 | 0 | 0 | 0 | 0 | 0 | 0 |
| Other non-current liabilities | 5,123 | 14,339 | 13,429 | 10,824 | 7,896 | 7,896 | 7,896 | 7,896 |
| Total liabilities | 15,866 | 28,028 | 22,530 | 17,488 | 15,085 | 16,720 | 18,596 | 18,906 |
| Share capital | 6,462 | 6,462 | 6,462 | 6,462 | 6,462 | 6,462 | 6,462 | 6,462 |
| Reserves/R.E./others | 34,017 | 47,261 | 41,446 | 38,989 | 39,661 | 49,131 | 73,733 | 109,979 |
| Shareholders' equity | 40,479 | 53,723 | 47,908 | 45,450 | 46,123 | 55,593 | 80,195 | 116,440 |
| Minority interests | 0 | 0 | 0 | 0 | 0 | 0 | 0 | 0 |
| Total equity & liabilities | 56,345 | 81,750 | 70,437 | 62,938 | 61,207 | 72,313 | 98,791 | 135,346 |
| EV | 546,990 | 538,243 | 545,720 | 549,700 | 549,581 | 541,700 | 523,945 | 489,823 |
| Net debt/(cash) | (11,298) | (20,044) | (12,567) | (8,587) | (8,706) | (16,587) | (34,342) | (68,465) |
| BVPS (TWD) | 62.645 | 83.141 | 74.142 | 70.339 | 71.379 | 86.035 | 124.109 | 180.202 |
Key ratios (%)
| Year to 31 Dec | 2021 | 2022 | 2023 | 2024 | 2025 | 2026E | 2027E | 2028E |
|---|---|---|---|---|---|---|---|---|
| Sales (YoY) | 35.6 | 23.8 | (34.6) | (23.6) | 24.4 | 45.6 | 75.2 | 35.0 |
| EBITDA (YoY) | 134.4 | 69.2 | (56.2) | (57.5) | 70.9 | 119.3 | 118.7 | 59.7 |
| Operating profit (YoY) | 213.3 | 83.2 | (73.1) | n.a. | n.a. | 523.8 | 192.6 | 72.0 |
| Net profit (YoY) | 188.6 | 83.5 | (70.0) | (96.5) | 855.6 | 444.5 | 182.8 | 71.2 |
| Core EPS (fully-diluted) (YoY) | 188.6 | 83.5 | (70.0) | (96.5) | 855.6 | 444.5 | 182.8 | 71.2 |
| Gross-profit margin | 28.5 | 40.0 | 19.4 | 1.1 | 9.1 | 24.0 | 37.1 | 46.4 |
| EBITDA margin | 31.6 | 43.2 | 28.9 | 16.1 | 22.1 | 33.3 | 41.5 | 49.2 |
| Operating-profit margin | 24.6 | 36.5 | 15.0 | n.a. | 4.9 | 21.1 | 35.3 | 45.0 |
| Net profit margin | 20.3 | 30.0 | 13.8 | 0.6 | 4.8 | 18.1 | 29.3 | 37.1 |
| ROAE | 29.1 | 41.2 | 11.4 | 0.4 | 4.3 | 20.8 | 44.2 | 52.2 |
| ROAA | 21.0 | 28.1 | 7.6 | 0.3 | 3.1 | 15.9 | 35.0 | 43.8 |
| ROCE | 34.0 | 49.1 | 12.5 | n.a. | 4.3 | 24.3 | 53.3 | 63.3 |
| ROIC | 36.6 | 57.4 | 15.0 | n.a. | 4.4 | 26.5 | 69.8 | n.a |
| Net debt to equity | net cash | net cash | net cash | net cash | net cash | net cash | net cash | net cash |
| Effective tax rate | 19.2 | 23.4 | 18.2 | 0.0 | 17.0 | 18.1 | 18.1 | 18.1 |
| Accounts receivable (days) | 70.7 | 73.3 | 94.1 | 78.5 | 75.2 | 78.9 | 74.2 | 75.9 |
| Current ratio (x) | 2.9 | 3.0 | 2.7 | 3.1 | 3.3 | 4.5 | 6.5 | 10.0 |
| Net interest cover (x) | 406.2 | 1,128.2 | 367.9 | 10.3 | 170.8 | 852.3 | 2,522.4 | 4,252.9 |
| Net dividend payout | 61.1 | 59.9 | 61.2 | n.a. | 33.2 | 50.0 | 50.0 | 50.0 |
| Free cash flow yield | 1.3 | 2.8 | 0.8 | n.a. | 0.1 | 1.6 | 4.1 | 8.8 |
Source: FactSet, Daiwa forecasts
Company profile
Nan Ya PCB originated as one of the business divisions of Nan Ya Plastics Corporation before transforming into a subsidiary in 1997, specialising in the manufacturing of printed circuit boards (PCBs) and integrated circuit (IC) substrates. The company's primary end applications include networking (c.50%), PCs (c.20%), consumer electronics (c.10%), automotive (c.10%) and other sectors. Its manufacturing facilities are located in Taiwan and China.
Nan Ya Printed Circuit Board Corp (8046 TT): 22 June 2026
Daiwa
Nan Ya Printed Circuit Board Corp (8046 TT): 22 June 2026
ESG analysis
ESG risks
| Risks | Management | Analyst comments |
|---|---|---|
| Executive/board quality | 2 | Nan Ya PCB's board of directors (BoD) is responsible for overseeing the company's operations and ensuring adherence to corporate governance principles. The board comprises individuals with diverse expertise, contributing to effective decision-making and strategic planning. The company emphasizes the importance of corporate governance as a set of processes, customs, policies, laws, and institutions affecting the way the corporation is directed, administered, or controlled. Principal stakeholders include stockholders, management, and the board of directors, among others. |
| Capital management | 2 | Nan Ya PCB maintains a prudent approach to capital management, ensuring financial stability and the availability of resources necessary for operational and strategic initiatives. The company's financial statements reflect a solid capital structure, supporting its growth and sustainability objectives. |
| Related party & transaction | 1 | The company adheres to strict policies regarding related party transactions to maintain transparency and fairness. Such transactions are conducted under terms comparable to those with independent third parties and are disclosed in financial reports to ensure compliance with regulatory standards and corporate governance best practices. For example, the company's consolidated financial statements provide details on transactions with related parties, ensuring transparency and accountability. |
| Supply chain management | 1 | Nan Ya PCB is committed to sustainable supply chain management, emphasizing environmental protection, procurement policies, and social responsibility. The company has established a comprehensive procurement policy that integrates sustainability considerations, ensuring that suppliers adhere to ethical standards and environmental regulations. This commitment is part of the company's broader sustainable responsibility policy, which includes areas such as corporate governance, environmental protection, and social welfare. |
| Data security | 1 | While specific details on Nan Ya PCB's data security measures are not extensively disclosed in the available sources, the company recognizes the importance of information security in its operations. As part of its corporate governance framework, Nan Ya PCB is likely to implement standard data protection practices to safeguard sensitive information and ensure compliance with relevant regulations. Stakeholders are encouraged to consult the company's official communications or contact the company directly for detailed information on data security policies. |
Note: Management score represents a company's ability to manage/benefit from certain ESG topics. The scores range from 1 to 3, with 1 being the strongest.
Update Date: 7 May 2026
Source: Daiwa, Company
Daiwa
圖片清單(已驗證 2026-07-02)
回補驗證:僅涵蓋已被 lib 頁嵌入的圖片,非全量驗證。
| 檔名 | size | 分類 | 親眼所見內容 |
|---|---|---|---|
260622_8046_南電_daiwa_NYPCB_003.png |
44KB | 真資料圖 | 股價與本益比倍數沿革圖,Y軸(TWD)0-1400,深藍色實際股價折線疊加10x/18x/30x/45x四條本益比倍數線,X軸Jun-19至Jun-26 |
260622_8046_南電_daiwa_NYPCB_004.png |
19KB | 真資料圖 | 產品組合佔比堆疊長條圖,Y軸0-100%,分BT/ABF/PCB三色區塊,X軸為2024/2025/2026E/2027E/2028E五個年度,圖上標示各區塊百分比數字 |