PDF 原檔:260616_daiwa_emc_original.pdf
原始內容
Taiwan
Elite Material (2383 TT)
Target price:
TWD6,022.00 (from TWD5,234.00)
Share price (15 Jun): TWD5,030.00 | Up/downside:
+19.7%
Solid position to ride on CCL spec upgrades
- Spec upgrade roadmap debate only short-term noise
- EMC to retain leading position in CCL with full range of solutions
- Reaffirming our Buy (1) rating; lifting 12M TP to TWD6,022
What's new: We provide our latest view on EMC.
What's the impact: On-track spec upgrade trend. We believe the spec upgrade trend remains the key growth driver for CCL vendors. As per EMC management, above M7-grade (including M7) revenue in 4Q25 was over 50% and would likely reach 70% by end-2026. Before 3Q25, EMC used M6 as the broader line to distinguish AI-related (or high-end) CCL, indicating the ongoing spec upgrade driven by high-speed data transmission requirements. We believe from 2026, M7-M9 would be the mainstream materials, while mainstream materials would gradually migrate to M8-M10 from 2027. Based on our assumption, CCL vendors should benefit by c.30% ASP hikes from every generation upgrade, which would be a key growth story for EMC. As in our previous note on TUC, we further lift our CCL ASP by c.10% from 2H26 to reflect the increasing cost from resin, which is the key reason why we lift our earnings forecasts by 9-26%.
CCL grade migration roadmap. In the near term, we believe there are several debates on the CCL migration roadmap, with Quartz glass (Q-glass) fibre and polytetrafluoroethylene (PTFE) resin at the centre of discussion. To meet the high-end CCL requirement on electrical properties, Q-glass and PFTE resin became key materials in 2025 given the original M8 resin (ie, hydrocarbon resin) took some time to migrate to M9/M10 resin (still hydrocarbon). We believe the M9/10 resin has gone under certification in 2026, which then dissipates the importance of Q-glass fibre and PTFE resin. Also, EMC has devoted its majority resources to test different formulas between advanced hydrocarbon resin/PTFE resin and fibres (including low dk2, low dk3 glass, and Q glass). In fact, we believe the cost performance ratio for reaching M9/10 CCL requirements by adopting advanced hydrocarbon resins might be the easier way. However, considering the potential shortage of high-end glass fibre, we believe end customers will likely verify multiple solutions to meet end demand. In sum, we see EMC maintaining its lead position on advanced CCL with several solutions (different combinations of resin, glass fibre, and copper foil) and >50% market share in AI server and high-speed switches. Of note, EMC will also ramp up c.0.9m (c.10% capacity) of ABF CCL in 2027E, which could be another key ASP driver.
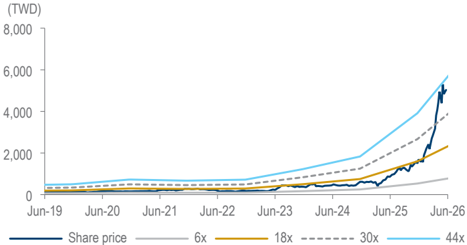
What we recommend: We reaffirm our Buy (1) rating. We raise our 12month TP to TWD6,022, based on a higher 48x PER (vs. prior: 43x) on 1year-forward EPS due to the steeper earnings trajectory growth. Key downside risk: weaker-than-expected AI server demand.
How we differ: Our 2026-28E EPS are 2-4% below the Bloomberg consensus, likely due to our higher opex ratio assumptions.
15 June 2026
5
Daiwa
3
→
2
1
Buy
Sheng Cheng
(886) 2 8758 6253
sheng.cheng@daiwacm-cathay.com.tw
Stacy Lin (886) 2 8758 6252 stacy.lin@daiwacm-cathay.com.tw
Forecast revisions (%)
| Year to 31 Dec | 26E | 27E | 28E |
|---|---|---|---|
| Revenue change | 6.5 | 10.3 | 12.3 |
| Net profit change | 9 | 19.4 | 26.4 |
| Core EPS (FD) change | 8.9 | 19.3 | 26.3 |
Source: Daiwa forecasts
Share price performance
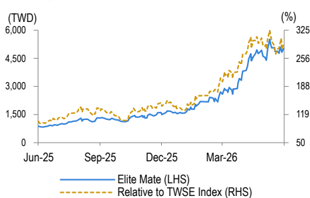
| 12-month range | 834.00-5,505.00 |
|---|---|
| Market cap (USDbn) | 57.00 |
| 3m avg daily turnover (USDm) | 390.08 |
| Shares outstanding (m) | 358 |
| Major shareholder | Yu Chang Investment Co Ltd (7.4%) |
Financial summary (TWD)
| Year to 31 Dec | 26E | 27E | 28E |
|---|---|---|---|
| Revenue (m) | 168,675 | 270,192 | 394,466 |
| Operating profit (m) | 41,090 | 75,568 | 117,298 |
| Net profit (m) | 31,867 | 58,978 | 91,549 |
| Core EPS (fully-diluted) | 88.877 | 164.489 | 255.329 |
| EPS change (%) | 113.3 | 85.1 | 55.2 |
| Daiwa vs Cons. EPS (%) | (1.5) | (3.7) | (1.7) |
| PER (x) | 56.6 | 30.6 | 19.7 |
| Dividend yield (%) | 1.1 | 2.0 | 3.0 |
| DPS | 53.4 | 98.8 | 153.3 |
| PBR (x) | 26.2 | 16.5 | 10.8 |
| EV/EBITDA (x) | 41.5 | 23.0 | 14.8 |
| ROE (%) | 53.4 | 66.1 | 66.3 |
Source: FactSet, Daiwa forecasts
EMC: Daiwa's revenue and earnings forecast revisions
| 2026E | 2026E | 2026E | 2027E | 2027E | 2027E | 2028E | 2028E | 2028E | |
|---|---|---|---|---|---|---|---|---|---|
| (TWDm) | Previous | New | Consensus | Previous | New | Consensus | Previous | New | Consensus |
| Revenue | 158,433 | 168,675 | 166,386 | 244,880 | 270,192 | 271,800 | 351,176 | 394,466 | 394,150 |
| Diff (%) | 6.5% | 1.4% | 10.3% | -0.6% | 12.3% | 0.1% | |||
| Gross margin (%) | 31.9% | 32.1% | 32.2% | 33.9% | 35.2% | 35.0% | 34.5% | 36.7% | 35.5% |
| Operating profit | 37,878 | 41,090 | 41,457 | 63,520 | 75,568 | 78,948 | 93,000 | 117,298 | 117,147 |
| Operating margin (%) | 23.9% | 24.4% | 24.9% | 25.9% | 28.0% | 29.0% | 26.5% | 29.7% | 29.7% |
| Net profit | 29,244 | 31,867 | 32,072 | 49,415 | 58,978 | 60,185 | 72,434 | 91,549 | 93,070 |
| EPS (TWD) | 81.61 | 88.88 | 90.26 | 137.90 | 164.49 | 170.78 | 202.14 | 255.33 | 259.67 |
| Diff (%) | 8.9% | -1.5% | 19.3% | -3.7% | 26.3% | -1.7% |
Source: Daiwa forecasts, Bloomberg
EMC: quarterly and annual P&L statement
| 2026E | 2026E | 2026E | 2026E | 2027E | 2025 | 2026E | 2027E | 2028E | ||||
|---|---|---|---|---|---|---|---|---|---|---|---|---|
| (TWDm) | 1Q | 2QE | 3QE | 4QE | 1QE | 2QE | 3QE | 4QE | ||||
| Net revenue | 33,067 | 42,246 | 44,778 | 48,584 | 56,111 | 64,103 | 70,711 | 79,267 | 94,261 | 168,675 | 270,192 | 394,466 |
| COGS | -23,338 | -28,913 | -30,135 | -32,209 | -36,769 | -41,680 | -45,708 | -50,901 | -66,141 | -114,594 | -175,058 | -249,555 |
| Gross profit | 9,729 | 13,334 | 14,643 | 16,375 | 19,342 | 22,423 | 25,003 | 28,366 | 28,120 | 54,081 | 95,134 | 144,911 |
| Operating expenses | 2,601 | 3,295 | 3,403 | 3,692 | 4,152 | 4,615 | 5,091 | 5,707 | 9,012 | 12,991 | 19,566 | 27,613 |
| Operating profit | 7,128 | 10,038 | 11,240 | 12,683 | 15,190 | 17,807 | 19,912 | 22,658 | 19,108 | 41,090 | 75,568 | 117,298 |
| Non-operating profit | 66 | -35 | 37 | 40 | 41 | 42 | -20 | -24 | -232 | 108 | 39 | 66 |
| Pre-tax profit | 7,194 | 10,004 | 11,277 | 12,723 | 15,231 | 17,849 | 19,892 | 22,634 | 18,876 | 41,197 | 75,607 | 117,364 |
| Net profit | 5,340 | 7,805 | 8,798 | 9,925 | 11,882 | 13,924 | 15,517 | 17,656 | 14,649 | 31,867 | 58,978 | 91,549 |
| Net EPS (TWD) | 14.90 | 21.78 | 24.55 | 27.70 | 33.16 | 38.86 | 43.31 | 49.27 | 41.7 | 88.9 | 164.5 | 255.3 |
| Operating Ratios | ||||||||||||
| Gross margin | 29.4% | 31.6% | 32.7% | 33.7% | 34.5% | 35.0% | 35.4% | 35.8% | 29.8% | 32.1% | 35.2% | 36.7% |
| Operating margin | 21.6% | 23.8% | 25.1% | 26.1% | 27.1% | 27.8% | 28.2% | 28.6% | 20.3% | 24.4% | 28.0% | 29.7% |
| Pre-tax margin | 21.8% | 23.7% | 25.2% | 26.2% | 27.1% | 27.8% | 28.1% | 28.6% | 20.0% | 24.4% | 28.0% | 29.8% |
| Net margin | 16.1% | 18.5% | 19.6% | 20.4% | 21.2% | 21.7% | 21.9% | 22.3% | 15.5% | 18.9% | 21.8% | 23.2% |
| YoY (%) | ||||||||||||
| Net revenue | 53% | 88% | 78% | 95% | 70% | 52% | 58% | 63% | 46% | 79% | 60% | 46% |
| Gross profit | 48% | 95% | 93% | 130% | 99% | 68% | 71% | 73% | 56% | 92% | 76% | 52% |
| Operating profit | 57% | 116% | 125% | 157% | 113% | 77% | 77% | 79% | 57% | 115% | 84% | 55% |
| Pre-tax profit | 54% | 124% | 120% | 175% | 112% | 78% | 76% | 78% | 56% | 113% | 84% | 55% |
| Net profit | 54% | 124% | 122% | 166% | 123% | 78% | 76% | 78% | 53% | 113% | 85% | 55% |
| QoQ (%) | ||||||||||||
| Net revenue | 33% | 28% | 6% | 9% | 15% | 14% | 10% | 12% | ||||
| Gross profit | 37% | 37% | 10% | 12% | 18% | 16% | 12% | 13% | ||||
| Operating profit | 44% | 41% | 12% | 13% | 20% | 17% | 12% | 14% | ||||
| Pre-tax profit | 56% | 39% | 13% | 13% | 20% | 17% | 11% | 14% | ||||
| Net profit | 43% | 46% | 13% | 13% | 20% | 17% | 11% | 14% |
Source: Company, Daiwa forecasts
EMC: 1-year forward PER bands
Source: TEJ, Daiwa forecasts
Elite Material (2383 TT): 15 June 2026
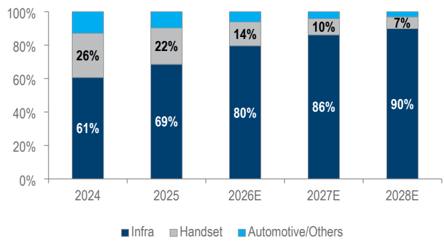
EMC: revenue breakdown by product
Source: Company, Daiwa forecasts
Daiwa
Financial summary
Key assumptions
| Year to 31 Dec | 2021 | 2022 | 2023 | 2024 | 2025 | 2026E | 2027E | 2028E |
|---|---|---|---|---|---|---|---|---|
| Global PC shipment (m) | 361 | 301 | 260 | 263 | 287 | 244 | 244 | 244 |
| Regular server shipment (m) | 14 | 15 | 12 | 14 | 16 | 18 | 22 | 26 |
| Global smartphone shipment (m) | 1,655 | 1,437 | 1,381 | 1,439 | 1,429 | 1,249 | 1,255 | 1,300 |
Profit and loss (TWDm)
| Year to 31 Dec | 2021 | 2022 | 2023 | 2024 | 2025 | 2026E | 2027E | 2028E |
|---|---|---|---|---|---|---|---|---|
| Infra | 12,089 | 15,289 | 21,125 | 39,046 | 64,617 | 134,338 | 232,735 | 354,444 |
| Handset | 19,413 | 16,378 | 14,716 | 17,033 | 20,538 | 24,005 | 26,303 | 27,549 |
| Other Revenue | 6,998 | 7,005 | 5,455 | 8,297 | 9,106 | 10,333 | 11,155 | 12,473 |
| Total Revenue | 38,500 | 38,673 | 41,296 | 64,377 | 94,261 | 168,675 | 270,192 | 394,466 |
| Other income | 0 | 0 | 0 | 0 | 0 | 0 | 0 | 0 |
| COGS | (28,431) | (28,962) | (29,964) | (46,407) | (66,141) | (114,594) | (175,058) | (249,555) |
| SG&A | (2,379) | (2,532) | (2,717) | (4,048) | (6,320) | (9,002) | (13,631) | (19,244) |
| Other op.expenses | (767) | (953) | (1,269) | (1,770) | (2,692) | (3,990) | (5,935) | (8,368) |
| Operating profit | 6,923 | 6,225 | 7,346 | 12,152 | 19,108 | 41,090 | 75,568 | 117,298 |
| Net-interest inc./(exp.) | (76) | (184) | (319) | (459) | (476) | (499) | (496) | (494) |
| Assoc/forex/extraord./others | 66 | 255 | 392 | 440 | 244 | 607 | 535 | 560 |
| Pre-tax profit | 6,912 | 6,296 | 7,420 | 12,133 | 18,876 | 41,197 | 75,607 | 117,364 |
| Tax | (1,412) | (1,220) | (1,931) | (2,564) | (4,231) | (9,336) | (16,634) | (25,820) |
| Min. int./pref. div./others | (7) | (3) | 0 | 9 | 4 | 6 | 5 | 5 |
| Net profit (reported) | 5,493 | 5,073 | 5,488 | 9,578 | 14,649 | 31,867 | 58,978 | 91,549 |
| Net profit (adjusted) | 5,493 | 5,073 | 5,488 | 9,578 | 14,649 | 31,867 | 58,978 | 91,549 |
| EPS (reported)(TWD) | 16.500 | 15.238 | 16.349 | 27.807 | 41.667 | 88.935 | 164.596 | 255.495 |
| EPS (adjusted)(TWD) | 16.500 | 15.238 | 16.349 | 27.807 | 41.667 | 88.935 | 164.596 | 255.495 |
| EPS (adjusted fully-diluted)(TWD) | 16.472 | 14.798 | 15.797 | 27.552 | 41.667 | 88.877 | 164.489 | 255.329 |
| DPS (TWD) | 10.000 | 8.407 | 9.979 | 16.575 | 24.996 | 53.359 | 98.758 | 153.297 |
| EBIT | 6,923 | 6,225 | 7,346 | 12,152 | 19,108 | 41,090 | 75,568 | 117,298 |
| EBITDA | 7,642 | 7,000 | 8,648 | 13,921 | 20,958 | 43,804 | 79,282 | 122,012 |
Cash flow (TWDm)
| Year to 31 Dec | 2021 | 2022 | 2023 | 2024 | 2025 | 2026E | 2027E | 2028E |
|---|---|---|---|---|---|---|---|---|
| Profit before tax | 6,912 | 6,296 | 7,420 | 12,133 | 18,876 | 41,197 | 75,607 | 117,364 |
| Depreciation and amortisation | 719 | 774 | 1,302 | 1,769 | 1,849 | 2,714 | 3,714 | 4,714 |
| Tax paid | (1,412) | (1,220) | (1,931) | (2,564) | (4,231) | (9,336) | (16,634) | (25,820) |
| Change in working capital | 7,481 | (4,810) | 12,237 | 16,078 | 25,148 | 52,606 | 98,933 | 71,286 |
| Other operational CF items | (9,679) | 6,457 | (16,138) | (20,153) | (29,674) | (78,876) | (126,121) | (93,183) |
| Cash flow from operations | 4,022 | 7,498 | 2,890 | 7,263 | 11,968 | 8,306 | 35,500 | 74,361 |
| Capex | (2,470) | (6,493) | (3,281) | (5,867) | (9,490) | (18,664) | (21,463) | (24,683) |
| Net (acquisitions)/disposals | (26) | 0 | 6 | 13 | (18) | 1 | (9) | (4) |
| Other investing CF items | (122) | (103) | (782) | (47) | (380) | (8) | 0 | 0 |
| Cash flow from investing | (2,618) | (6,596) | (4,057) | (5,901) | (9,888) | (18,671) | (21,472) | (24,687) |
| Change in debt | 1,719 | 2,732 | 2,954 | 5,296 | 8,721 | 11,241 | 9,530 | 9,748 |
| Net share issues/(repurchases) | 0 | 0 | 0 | 0 | 0 | 0 | 0 | 0 |
| Dividends paid | (2,333) | (3,333) | (2,830) | (3,439) | (5,894) | (8,957) | (19,120) | (35,387) |
| Other financing CF items | 194 | 3,289 | (15) | 2,259 | (51) | 3,109 | 0 | 0 |
| Cash flow from financing | (420) | 2,687 | 109 | 4,116 | 2,776 | 5,394 | (9,590) | (25,639) |
| Forex effect/others | (73) | 211 | (126) | 251 | 163 | 800 | 786 | 700 |
| Change in cash | 910 | 3,802 | (1,185) | 5,729 | 5,020 | (4,172) | 5,224 | 24,735 |
| Free cash flow | 1,551 | 1,005 | (391) | 1,397 | 2,478 | (10,358) | 14,037 | 49,678 |
Source: FactSet, Daiwa forecasts
Elite Material (2383 TT): 15 June 2026
Daiwa
Financial summary continued …
Balance sheet (TWDm)
| Year to 31 Dec | 2021 | 2022 | 2023 | 2024 | 2025 | 2026E | 2027E | 2028E |
|---|---|---|---|---|---|---|---|---|
| Cash & short-term investment | 6,642 | 10,444 | 9,259 | 14,989 | 20,008 | 15,836 | 21,061 | 45,796 |
| Inventory | 5,465 | 4,236 | 6,135 | 9,437 | 16,752 | 26,597 | 44,965 | 56,283 |
| Accounts receivable | 13,274 | 11,683 | 17,327 | 25,897 | 36,115 | 69,085 | 113,779 | 149,052 |
| Other current assets | 463 | 217 | 955 | 1,171 | 1,106 | 1,110 | 1,110 | 1,110 |
| Total current assets | 25,844 | 26,580 | 33,675 | 51,494 | 73,980 | 112,629 | 180,914 | 252,240 |
| Fixed assets | 10,721 | 16,803 | 19,746 | 24,568 | 33,933 | 51,105 | 68,854 | 88,822 |
| Goodwill & intangibles | 0 | 0 | 0 | 0 | 0 | 0 | 0 | 0 |
| Other non-current assets | 0 | 0 | 6 | 18 | 0 | (1) | 8 | 12 |
| Total assets | 36,565 | 43,382 | 53,427 | 76,080 | 107,913 | 163,733 | 249,776 | 341,075 |
| Short-term debt | 2,717 | 5,299 | 7,866 | 7,781 | 11,264 | 15,405 | 19,226 | 22,909 |
| Accounts payable | 10,969 | 9,802 | 14,491 | 21,199 | 33,285 | 55,816 | 91,689 | 116,384 |
| Other current liabilities | 799 | 659 | 716 | 1,202 | 1,682 | 4,098 | 4,098 | 4,098 |
| Total current liabilities | 14,485 | 15,760 | 23,073 | 30,182 | 46,231 | 75,319 | 115,013 | 143,391 |
| Long-term debt | 721 | 4,218 | 2,109 | 8,772 | 8,219 | 15,799 | 21,508 | 27,573 |
| Other non-current liabilities | 1,585 | 1,330 | 1,435 | 2,032 | 3,027 | 3,726 | 3,726 | 3,726 |
| Total liabilities | 16,791 | 21,308 | 26,617 | 40,986 | 57,477 | 94,844 | 140,247 | 174,690 |
| Share capital | 3,329 | 3,329 | 3,432 | 3,466 | 3,583 | 3,583 | 3,583 | 3,583 |
| Reserves/R.E./others | 16,424 | 18,745 | 23,378 | 31,644 | 46,872 | 65,332 | 105,977 | 162,839 |
| Shareholders' equity | 19,753 | 22,075 | 26,809 | 35,111 | 50,456 | 68,915 | 109,560 | 166,422 |
| Minority interests | 21 | 0 | 0 | (17) | (20) | (26) | (31) | (37) |
| Total equity & liabilities | 36,565 | 43,382 | 53,427 | 76,080 | 107,913 | 163,733 | 249,776 | 341,075 |
| EV | 1,799,172 | 1,801,429 | 1,803,071 | 1,803,902 | 1,801,809 | 1,817,696 | 1,821,996 | 1,807,004 |
| Net debt/(cash) | (3,203) | (926) | 716 | 1,564 | (525) | 15,368 | 19,673 | 4,686 |
| BVPS (TWD) | 59.332 | 66.306 | 79.860 | 101.931 | 143.516 | 192.329 | 305.760 | 464.451 |
Key ratios (%)
| Year to 31 Dec | 2021 | 2022 | 2023 | 2024 | 2025 | 2026E | 2027E | 2028E |
|---|---|---|---|---|---|---|---|---|
| Sales (YoY) | 41.5 | 0.4 | 6.8 | 55.9 | 46.4 | 78.9 | 60.2 | 46 |
| EBITDA (YoY) | 44.4 | (8.4) | 23.6 | 61 | 50.5 | 109.0 | 81 | 53.9 |
| Operating profit (YoY) | 47.8 | (10.1) | 18.0 | 65.4 | 57.2 | 115.0 | 83.9 | 55.2 |
| Net profit (YoY) | 48.9 | (7.7) | 8.2 | 74.5 | 52.9 | 117.5 | 85.1 | 55.2 |
| Core EPS (fully-diluted) (YoY) | 48.9 | (10.2) | 6.7 | 74.4 | 51.2 | 113.3 | 85.1 | 55.2 |
| Gross-profit margin | 26.2 | 25.1 | 27.4 | 27.9 | 29.8 | 32.1 | 35.2 | 36.7 |
| EBITDA margin | 19.8 | 18.1 | 20.9 | 21.6 | 22.2 | 26.0 | 29.3 | 30.9 |
| Operating-profit margin | 18.0 | 16.1 | 17.8 | 18.9 | 20.3 | 24.4 | 28 | 29.7 |
| Net profit margin | 14.3 | 13.1 | 13.3 | 14.9 | 15.5 | 18.9 | 21.8 | 23.2 |
| ROAE | 30.1 | 24.3 | 22.5 | 30.9 | 34.2 | 53.4 | 66.1 | 66.3 |
| ROAA | 17.1 | 12.7 | 11.3 | 14.8 | 15.9 | 23.5 | 28.5 | 31 |
| ROCE | 33.2 | 22.7 | 21.5 | 27.5 | 31.4 | 48.3 | 60.4 | 63.9 |
| ROIC | 37.6 | 26.6 | 22.3 | 29.9 | 34.3 | 47.4 | 55.2 | 60.9 |
| Net debt to equity | net cash | net cash | 2.7 | 4.5 | net cash | 22.3 | 18 | 2.8 |
| Effective tax rate | 20.4 | 19.4 | 26.0 | 21.1 | 22.4 | 22.7 | 22 | 22 |
| Accounts receivable (days) | 110.0 | 117.8 | 128.2 | 122.5 | 120.1 | 113.8 | 123.5 | 121.6 |
| Current ratio (x) | 1.8 | 1.7 | 1.5 | 1.7 | 1.6 | 1.5 | 1.6 | 1.8 |
| Net interest cover (x) | 0.9 | 0.4 | 0.2 | 0.3 | 0.4 | 0.8 | 1.5 | 2.4 |
| Net dividend payout | 60.6 | 55.2 | 61.1 | 59.6 | 60.0 | 60.0 | 60 | 60 |
| Free cash flow yield | 0.1 | 0.1 | n.a. | 0.1 | 0.1 | n.a. | 0.8 | 2.8 |
Source: FactSet, Daiwa forecasts
Company profile
Established in 1992 and listed on the Taiwan Stock Exchange in 1996, Elite Material Co. (EMC) is a leading manufacturer of copper clad laminate (CCL) and prepreg (PP), and a mass lamination foundry for PCB players. The company is also the world's largest green (halogen-free) CCL supplier.
Elite Material (2383 TT): 15 June 2026
Daiwa
ESG analysis
ESG risks
| Risks | Risks | Management | Analyst comments |
|---|---|---|---|
| G | Executive/board quality | 2 | EMC has incorporated 3 independent members into its 7-people board of directors in pursuit of better governance. Besides, EMC's Chairman and CEO roles are held separately, which reduce the risk of conflict of interest and excessive concentration of power. In addition, the company has 2 committees: the Audit Committee and the Remuneration Committee to assist the Board of Directors in performing their supervisory duties |
| G | Capital management | 1 | EMC has declared a dividend payout ratio of over 50% in the past ten years, which we view as a shareholder-friendly dividend policy. |
| G | Related party & transaction | 2 | Revenue from related parties accounted for <1% of total revenue, and the purchases from related parties comprised <1% of cost of sales. We see limited risk from related-party transactions |
| S | Product design & lifecycle management | 2 | EMC strives to create a safe and healthy workplace for every employee. EMC has introduced the occupational safety and health management systems (ISO 45001) in its Headquarters and all production plants to reduce the workplace hazards and enhance its safety and health management level. |
| S GHG | emissions | 2 | To ensure data security, EMC has formulated its Directions for Information Security Management based on three principles for information security management, which are confidentiality, integrity, and availability. In 2023, there were no incidents involving the violation of information-security-related laws and regulations, and no information security incidents occurred. |
| Company specific | Company specific | Management | Analyst comments |
| E | GHG emissions | 2 | EMC follows ISO 14061-1 2018 standards to conduct GHG emissions inventory and propose feasible solutions for greenhouse gas reduction. Besides, a third-party inspection agency is appointed to perform external verification. |
Note: Management score represents a company's ability to manage/benefit from certain ESG topics. The scores range from 1 to 3, with 1 being the strongest.
Update Date: 30 Jul 2025
Source: Daiwa, Company
Elite Material (2383 TT): 15 June 2026
Daiwa
圖片清單(已驗證 2026-07-02)
回補驗證:僅涵蓋已被 lib 頁嵌入的圖片,非全量驗證。
| 檔名 | size | 分類 | 親眼所見內容 |
|---|---|---|---|
260616_daiwa_emc_001.png |
23KB | 真資料圖 | 台光電(Elite Mate)股價走勢圖,藍線為股價(TWD,左軸),橘色虛線為相對台灣加權指數表現(%,右軸),時間軸 Jun-25 至 Mar-26 |
260616_daiwa_emc_002.png |
30KB | 真資料圖 | 股價與本益比區間圖,深藍線為股價,灰/橘/淺藍虛線分別標示 6x/18x/30x/44x 本益比帶,時間軸 Jun-19 至 Jun-26 |
260616_daiwa_emc_003.png |
24KB | 真資料圖 | 收入結構堆疊長條圖,Infra(深藍)/Handset(灰)/Automotive-Others(淺藍)三類占比,橫軸 2024 至 2028E,Infra 占比標示由 61% 升至 90% |