PDF 原檔:260615_2458_義隆_ubs_elan-resume_original.pdf
原始內容
Elan Microelectronics
Spec upgrades and AI initiatives support growth
Sustained revenue growth despite softer notebook shipments
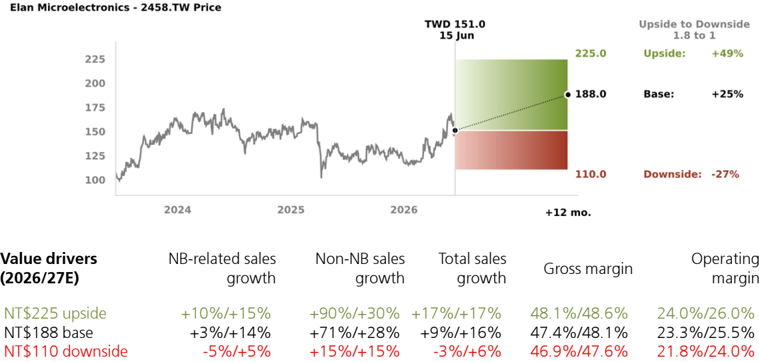
We assume coverage of Elan at Buy with a PT of NT$188 (previously NT$139), based on 16x 2027E PE (prior 15x 2025E) post Q1 analyst meeting. Despite softer NB unit demand (UBSe -9% YoY) in 2026 on higher memory cost and CPU constraints, we believe Elan can sustain sales growth at 9% YoY in 2026E on touchpad spec-upgrades, higher premium/commercial mix for NB, and new opportunities in AI. We expect sales and EPS growth to accelerate in 2027-28E for +12%/+23% YoY, respectively, on a PC demand recovery; content growth from larger size and haptic adoption for touchpads, as well as fingerprint sensors and touch ICs; and growth from AI business (16% of sales by 2028E vs 5% in 2025). We think accelerating revenue growth and GM recovery could support potential OPM expansion, and earnings and valuation upside.
Spec/content upgrades supporting ASP expansion and GM recovery
We believe Elan is well positioned to monetise HMI (Human Machine Interface) spec and content upgrades, which should drive both ASP and unit growth, outperforming overall NB shipments. We expect its NB-related business (touchpad, touch IC, point-stick, and fingerprint sensors), which collectively accounts for ~90% of sales, to see an 8% CAGR over 2025-28E (vs -2% CAGR for NB unit shipments) on touchpad shifting to larger size and rising penetration of haptic touchpads, growth of touch IC as technology shifts from DLOC (Double Layer On-Cell) to SLOC (Single Layer On-Cell), and rising adoption of fingerprint sensors. New features such as stylus, waterproof, and glove-operable were added to its touch solutions in recent years, as well as lower power consumption designs should drive an ASP uplift. Given rising foundry and OSAT costs, Elan is also raising its pricing from Q326, and we believe this should support a GM recovery.
AI set to become a new driver from 2027
Elan has been expanding into AI-related applications, including edge-AI such as smartcity, ADAS, and drone, as well as aiming to supply EIC (Electronic IC) for NPO (NearPackaged Optics)/CPO (Co-Packaged Optics) through partnering with PETA. Although the majority of AI-related sales in H126 were exposed to smart-city and ADAS, we expect sales for drone to see a meaningful pick-up from H226 as it ramps its integrated solutions such as AI-box, camera module, touchpad and miniLED controller unit, lifting ASP from US$10-30 for a single camera module to over-US$300 for AI-box plus camera module. We forecast its AI-business to see a 49% sales CAGR in 2025-30E, excluding the potential revenue contribution from EIC, outpacing its traditional HMI business.
Valuation: Assume coverage at Buy with a NT$188 price target
Our PT of NT$188 is based on 16x 2027E P/E, the upcycle average after 2020. We lower 2026E EPS by 9% on softer NB demand, but raise 2027E/28E EPS by 4%/12% on content growth for touch business and AI opportunities. We believe the share price does not fully reflect the improving earnings profile and potential AI opportunities.
| Highlights (NT$m) | 12/23 | 12/24 | 12/25 | 12/26E | 12/27E | 12/28E | 12/29E | 12/30E |
|---|---|---|---|---|---|---|---|---|
| Revenues | 12,059 | 12,696 | 12,326 | 13,390 | 15,549 | 17,472 | 19,505 | 21,478 |
| EBIT (UBS) | 2,434 | 3,066 | 2,982 | 3,115 | 3,961 | 4,663 | 5,430 | 6,175 |
| Net earnings (UBS) | 2,144 | 2,736 | 2,442 | 2,730 | 3,407 | 3,995 | 4,637 | 5,262 |
| EPS (UBS, diluted) (NT$) | 7.46 | 9.52 | 8.48 | 9.42 | 11.76 | 13.79 | 16.00 | 18.16 |
| DPS (net) (NT$) | 5.12 | 7.83 | 7.16 | 8.00 | 9.99 | 11.71 | 13.59 | 15.42 |
| Net (debt) / cash | 3,932 | 3,952 | 3,023 | 2,170 | 2,317 | 2,612 | 2,852 | 3,400 |
| Profitability/valuation | 12/23 | 12/24 | 12/25 | 12/26E | 12/27E | 12/28E | 12/29E | 12/30E |
| EBIT (UBS) margin% | 20.2 | 24.1 | 24.2 | 23.3 | 25.5 | 26.7 | 27.8 | 28.7 |
| ROIC (EBIT)% | 67.5 | 89.7 | 63.2 | 50.8 | 55.1 | 58.1 | 61.0 | 63.2 |
| EV/EBITDA (UBS core) x | 10.1 | 11.1 | 9.9 | 10.9 | 8.8 | 7.4 | 6.4 | 5.6 |
| P/E (UBS, diluted) x | 15.9 | 16.1 | 15.6 | 16.0 | 12.8 | 11.0 | 9.4 | 8.3 |
| Equity FCF (UBS) yield% | 9.4 | 4.3 | 2.3 | 3.6 | 6.0 | 7.9 | 8.9 | 11.0 |
| Dividend yield (net)% | 4.3 | 5.1 | 5.4 | 5.3 | 6.6 | 7.8 | 9.0 | 10.2 |
Source: Company accounts, LSEG Eikon, UBS estimates. Metrics marked as (UBS) have had analyst adjustments applied. Valuations: based on an average share price that year, (E): based on a share price of NT$ 151.00 on 15-Jun-2026
| Equities | Equities | Equities | Equities |
|---|---|---|---|
| Taiwan | Taiwan | Taiwan | Taiwan |
| Semiconductors | Semiconductors | Semiconductors | Semiconductors |
| 12-month rating | 12-month rating | 12-month rating | Buy |
| 12m price target | 12m price target | 12m price target | NT$188.00 Prior : NT$139.00 |
| Price (15 Jun 2026) | Price (15 Jun 2026) | Price (15 Jun 2026) | NT$151.00 |
| RIC: 2458.TW BBG: 2458 TT | RIC: 2458.TW BBG: 2458 TT | RIC: 2458.TW BBG: 2458 TT | RIC: 2458.TW BBG: 2458 TT |
| Trading data and key metrics 52-wk | range | Trading data and key metrics 52-wk | NT$167.50-115.50 |
| Market cap. | Market cap. | Market cap. | NT$43.2b/US$1.37b |
| Shares o/s | Shares o/s | Shares o/s | 286m (ORD) |
| Free float | Free float | Free float | 76% |
| Avg. daily volume ('000) | Avg. daily volume ('000) | Avg. daily volume ('000) | 3,965 |
| Avg. daily value (m) | Avg. daily value (m) | Avg. daily value (m) | NT$568.5 |
| Common s/h equity (12/26E) | Common s/h equity (12/26E) | Common s/h equity (12/26E) | NT$10.6b |
| P/BV (12/26E) | P/BV (12/26E) | P/BV (12/26E) | 4.1x |
| Net debt to EBITDA (12/26E) | Net debt to EBITDA (12/26E) | Net debt to EBITDA (12/26E) | NM |
| EPS (UBS, diluted) (NT$) | EPS (UBS, diluted) (NT$) | EPS (UBS, diluted) (NT$) | EPS (UBS, diluted) (NT$) |
| From | To | %ch Cons. | |
| 12/26E | 10.39 | 9.42 | -9 9.62 |
| 12/27E | 11.32 | 11.76 | 4 10.77 |
| 12/28E | 12.28 | 13.79 | 12 10.44 |
Jerry Su
Analyst jerry.su@ubs.com +886-28-722 7306
Annie Chen
Associate Analyst annie.chen@ubs.com +886-2-8722 7281
Elan Microelectronics - 2458.TW Price
200
Thesis Map UBS Research THESIS MAP a guide to our thinking and what´s where in this report
Pivotal Questions
100
2024
Q: Can Elan grow its revenue amid softer PC/NB demand?
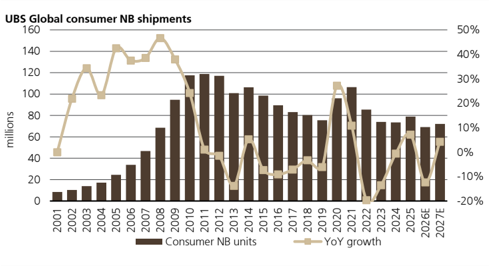
Likely. We expect Elan to sustain its leading position for NB human machine interface and grow its content value on increasing adoption of haptic touchpad, rising fingerprint sensor penetration, and more controller IC required as touch screen technology shifts from DLOC toward SLOC for lower total cost, despite the overall NB market facing a contraction in 2026E as higher memory pricing and CPU shortages could dampen demand. Elan is also expanding into AI-related applications including smartcity, ADAS, drone, and EIC for NPO/CPO. We forecast 2026/27E sales to grow 9%/16% YoY, vs UBSe global NB unit growth of -9.5% and +1.7%, respectively.
Q: Can Elan sustain or further expand its profitability?
Likely. We believe mix shift toward higher dollar content and better margin product lines could support Elan's profit expansion, while OPEX increase should be slower than top-line growth, leading to operating leverage. We also believe Elan will be able to reflect foundry and OSAT cost hikes to its customers as NB HMI suppliers have consolidated in the past few years. Elan's GM recovered to 48.6% in 2025 from 45.0% in 2023, despite topline being similar. Although GM is likely to contract YoY in 2026E to 47.4% on foundry/OSAT price hikes in H126 and less favourable mix, we believe its GM should recover from H226 as it adjusts ASPs and ramps higher-GM products. We forecast Elan's GM to expand to 48.1% in 2027E and 48.6% in 2028E, while OPM should see faster expansion from 23.3% in 2026E to 25.5% in 2027E and 26.7% in 2028E on operating leverage.
We assume coverage at Buy with a PT of NT$188 (from NT$139), based on 16x 2027E PE (from 15x 2025E PE), the upcycle average after 2020 (vs 7-20x historical range). We believe Elan is a good proxy for the NB replacement cycle and agentic AI PC entering 2027-28E and can deliver content growth in ASP for its touch segment via migration to higher-end products such as larger size and haptic touchpad, fingerprint sensor, and touch screen IC. Diversification into edge AI applications, leveraging its expertise in HMI and sensing, could be a new growth driver from 2027, reducing its reliance on the PC/NB cycle. We expect 2026 EPS of NT$9.42, up 11% YoY, with growth to accelerate in 2027/28E with EPS of NT$11.76/13.79 as NB demand recovers and AI product sales ramp up.
Elan is well positioned to maintain its HMI market share on its robust R&D for new features and costeffective solutions, when increasing its value-add through new product offerings. Its revenue was broadly stable during 2023-25 but its GM expanded by 3.6ppt to 48.6% in 2025. This was due to new product launches such as larger size touchpads, SLOC touch IC, and a more favourable mix. It has been developing haptic touchpads for several years and recently penetrated into Microsoft's Surface laptop with broadening adoption by other leading brands expected in the coming quarters.
The market generally associates Elan with NB demand given its roughly 90% sales exposure to that segment, but we think investors could be overlooking the potential ASP uplift benefits coming from HMI spec upgrades and new opportunities in the edge AI businesses. The stock is trading at 14x 12month fwd consensus EPS versus its historical 7-20x, below peer average. We believe the current share price does not fully reflect the improving earnings profile and potential AI opportunities. com
| Value drivers (2026/27E) | NB-related sales growth | Non-NB sales growth | Total sales growth | Gross margin | Operating margin |
|---|---|---|---|---|---|
| NT$225 upside | +10%/+15% | +90%/+30% | +17%/+17% | 48.1%/48.6% | 24.0%/26.0% |
| NT$188 base | +3%/+14% | +71%/+28% | +9%/+16% | 47.4%/48.1% | 23.3%/25.5% |
| NT$110 downside | -5%/+5% | +15%/+15% | -3%/+6% | 46.9%/47.6% | 21.8%/24.0% |
Source: UBS estimates
Elan Microelectronics is an IC design house specialising in human-machine interface.
kevinlu@ lenovo.com kevinlu@ lenovo.com
UBS VIEW
EVIDENCE
WHAT´S PRICED IN?
Upside/Downside Spectrum
Company Description
2025
TWD 151.0
15 Jun
225.0
Upside to Downside
1.8 to 1
Upside:
+49%
Q126 results and outlook
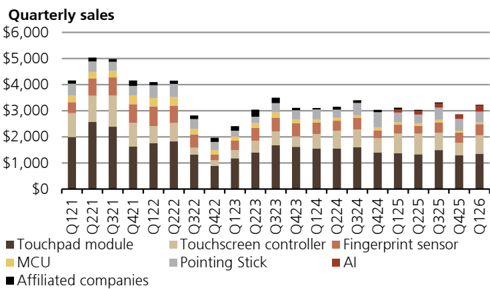
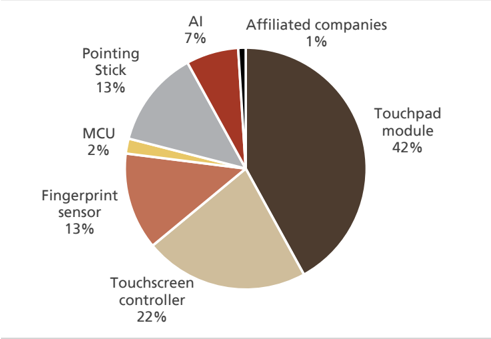
Elan held an analyst meeting on 8 June to review its Q126 result. The company also discussed the business outlook, summarized the products it exhibited at Computex and provided an update on its latest developments for AI-related projects. Q126 sales grew 13% QoQ to NT$3.23bn, in line with guidance of NT$3.2-3.4bn as pull-ins ahead of memory inflation offset the traditional slow season. By key product lines, touchpad accounted for 42% of Q126 sales (vs 45% in Q425), touch controller IC 22% (17%), fingerprint sensor 13% (14%), and point stick 13% (16%), while AI-related increased to 7% of Q126 sales from 6% in Q425.
Q126 GM came in at 47.6%, down 1.7ppt QoQ due to less favourable mix, and rising costs for raw materials and production. Its opex-to-sales ratio improved from 26.2% in Q425 to 23.5% in Q126, supported by government R&D subsidy programs, driving OpM to 24.2%. With non-op of NT$61m, Q126 EPS came in at NT$2.43.
Figure 1: Elan's revenue, by product-AI-related business contribution growing
Source: Company data
Figure 2: Elan's revenue mix by product-touchpad remains the largest revenue driver (Q126)
Source: Company data
For Q226, management guided a similar revenue range QoQ at NT$3.2-3.4bn with NB rush orders likely to extend, and gross margin to remain stable at 46.5-49.5% as rising foundry and OSAT costs create near-term margin pressure. Price adjustments are under discussion and are expected to gradually take effect from July 1, although a richer mix of high-margin products should help mitigate the impact. OpM is guided at 21.4% to 25.9%, reflecting higher photomask and R&D expenses. We forecast Q2 sales to grow 2% QoQ to NT$32.8bn with stronger momentum from point-stick and AI segments, while we expect touchpad, touch screen IC, fingerprint IC, and MCU sales to be flattish to down slightly QoQ. In terms of margins, we forecast GM to contract 0.2ppt QoQ to 47.4% on rising production cost and OPM of 22.9% (-1.2ppt QoQ) on higher opex.
Figure 3: UBS vs. consensus estimates
| s)3U | s33Uu | s33Uu | s43Uu | s43Uu | 3(39 3(3Uu | 3(39 3(3Uu | 3(3,u | 3(3,u | |
|---|---|---|---|---|---|---|---|---|---|
| VhbMm: | iZtu'l | ynpü | uikon | ynpü | uikon | iZtu'l ynpü | uikon | ynpü | uikon |
| wüvünuü | 4T339 | 4T3,% | 4T49E | 4TE%D | 4T99( | )3T43U | )4T4%( )4TEDE | )9T9E% | )ET,94 |
| I íoí)g)+o+ | -=fAp | -f/p | ,f?p | Nf/p | bfOp | I=fOp | AfNp Of,p | -Nf-p | Of,p |
| gross/profit | )T94, | )T99E | )TU(E | )TUE9 | )T,)( | 9T%%U | UT4E3 UTE9E | ,TED9 | ,T()U |
| I 'ross)m©rgin | ,/fNp | ,/f,p | ,/fAp | ,/f?p | ,Af=p | ,AfNp | ,/f,p ,/fOp | ,Af-p | ,/fNp |
| epür'ting/profit | ,,% | ,93 | D3U | D)( | %)E | 3T%D3 | 4T))9 4T434 | 4T%U) | 4T,EE |
| I Zâ)m©rgin | =,f-p | ==fOp | =,fNp | =wf=p | =bfAp | =,f=p | =wfwp =,fNp | =bfbp | =bf,p |
| hon$ep/ | U) | 3D | 39 | 4U | 3E | $)43 | )9) )4U | )33 | ))U |
| vrü$t'x/profit | DE( | ,D( | D93 | DEU | %4D | 3TD9( | 4T3UU 4TE9% | ET(D4 | 4TDU( |
| b'x | )UE | )9U | )U3 | )U% | )D3 | 9E4 | UE% U9, | D), | ,E) |
| I ü©x)r©te | I=?p | I=?p | I-Op | I=?p | I-Op | I-Op | I=?p I-Op | I=?p | I-Op |
| hüt/profit | ,(9 | U9) | ,(, | ,(U | ,%) | 3TEE3 | 3T,4( 3TDE) | 4TE(, | 4T)9D |
| lilutü"/uvp/VhbM: | 38E4 | 3839 | 38EE | 38EE | 38,4 | D8ED | %8E3 %8D) | ))8,U | )(8%( |
Source: UBS estimates, LSEG
kevinlu@ lenovo.com
PC units by form factor (m)
Desktops
YoY growth
Notebooks
YoY growth
QoQ growth
YoY growth
Chromebooks
YoY growth
Total PC Units
QOQ qrowth
YoY growth
YoY growth
YoY growth
YoY growth
YoY growth
Q126E
16.4
6.4%
41.8
5.4%
Quarterly Trends
Q226E
Q326E
15.2
-6.7%|
41.2
-5.1%
14.1
-20.8%|
41.6
-16.8%|
Q426E
13.9
-26.0%
40.6
-17.8% |
New Estimates
2025
2026E
2027E
68.3
11.8%
182.6
8.7%
59.6
-12.7%
165.3
-9.5%
60.4
1.3%
168.2
1.7%
Original Estimates
2025E
2026E
2027E
65.8
7.7%
179.4
6.7%
61.7
-6.2%|
174.5
-2.7%|
62.2
0.8%
178.3
2.2%
Into H226, the PC market remains challenged due to ongoing supply constraints and price increases across various components such as memory and CPU. Despite the uncertainty and potentially softer outlook, Elan indicated its customer order trends remain broadly stable, noting that it expects revenue growth to be supported by several upcoming product launches (including project wins in high-end Chromebook (Googlebook)), rising penetration of touch screen and premium touchpad solutions for top-5 notebook brands, and RTX Spark expected for September debut. Elan's recent penetration into Microsoft's Surface laptop represents a key validation milestone, which we expect to drive broader adoption across other tier-one brands such as HP , Dell, and Lenovo in their premium models, supporting ASP expansion from c.~US$3 for traditional touchpads to ~US$10-15 for haptics. It also sees better demand from commercial over consumer customers, in line with UBS hardware team's expectations, while brands are also aiming to launch more premium models including features such as larger screen size, narrow border design and advanced touchpad to justify price hikes amidst a higher component-cost environment.
Figure 4: UBS recently lowered global PC units from -4%/+2% to -11%/+2% for 2026E/2027E
Source: Gartner, UBS estimates
Figure 5: Global consumer NB volumes expected to drop more than commercial, at -12% YoY in 2026E
Source: Gartner, UBS estimates
Figure 6: Global commercial NB shipments at -9% YoY in 2026E
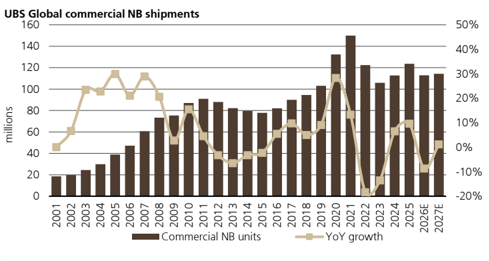
Source: Gartner, UBS estimates
Amid the rising cost of such components as CPU and memory, NB OEMs are aiming to adopt cost-effective SLOC (single layer on-cell) touch display technology versus the current DLOC (double layer on-cell) to further reduce the overall cost structure. As SLOC only requires one layer of ITO sensor (vs 4 layers of ITO for DLOC) to detect a capacitance change and to sense the point of touch, the production process is less complicated for SLOC than DLOC, although SLOC requires more touch controller ICs (3-4 chips for SLOC vs 1 chip for DLOC) to ensure touch sensing accuracy, which is positive for Elan's touch IC business. But despite requiring more chips, SLOC touch panels still have a lower BOM cost than DLOC given the less complicated panel production process, and we think the advent of SLOC could be the catalyst to drive down touch display cost and push adoption by NB brands, particularly under the current environment of rising BOM costs. With overall NB demand expected to recover from 2027, we believe Elan's touch IC business should also recover after a softer 2026.
kevinlu@ lenovo.com
% Chg. in UBS Est.
2025E
2026E
2027E
3.8%
1.8%
-3.4%
-5.2%
-3.0%
-5.6%
Figure 7: SLOC touch has lower cost but requires more touch IC controllers
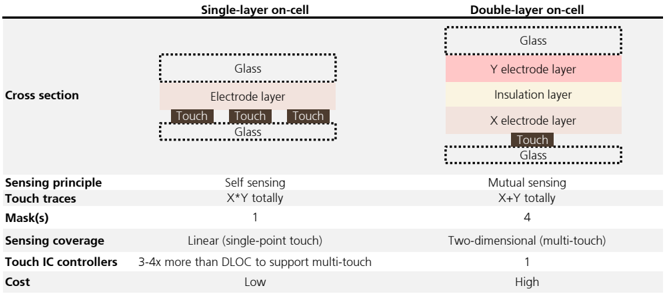
Source: Company data, UBS
In terms of margins, we expect Elan's like-to-like GM to improve in H226, while overall GM will depend on its product mix as the AI-business could carry lower-GM, despite higher ASP and OP dollar. OPEX is expected to remain largely stable, with spending still R&D-driven. Management also aims to reallocate R&D resources by shifting MCU engineers to drone-related development, and aims to apply more government R&D subsidies to contain overall OPEX growth.
For 2026, we expect Elans's NB-related sales (touchpad, touch screen IC, fingerprint IC, and point stick) to grow 3% YoY, vs overall NB shipment decline of 9% YoY, while we expect non-NB sales (MCU and AI) to grow 71% YoY on accelerated growth in AI business from a growing drone business with higher shipments of AI box and integrated camera modules. Net-net, we forecast Elan's 2026 revenue to grow 9% YoY with AI mix increasing to 11% of total sales, from 5% in 2025.
AI business driven by increasing content in drones from H226 onwards
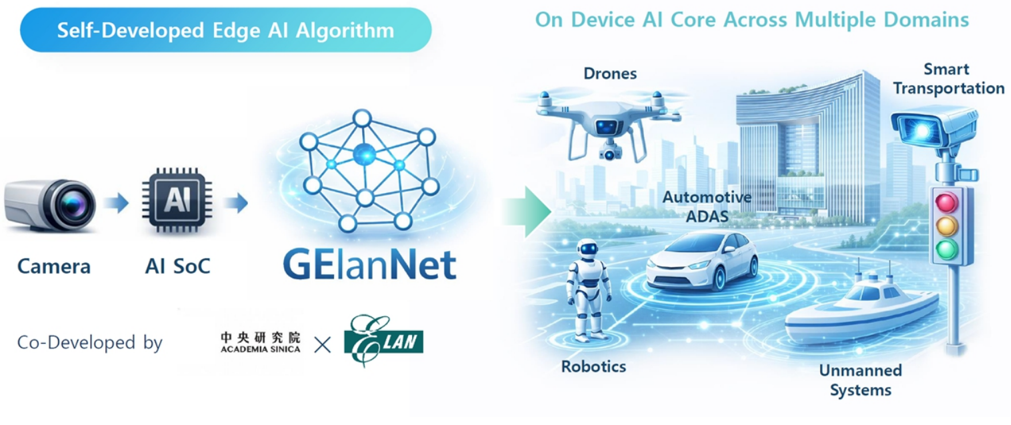
Elan has been expanding into AI-related applications, including edge-AI applications such as smart-city and ADAS for commercial vehicles, leveraging its edge AI and computer vision capabilities to pivot beyond its traditional consumer HMI business. It has also started shipments of ISP (Image Signal Processors) and local dimming IC for Chinese drone customers from mid-2025, lifting overall AI-related revenue to 7% of total sales in Q126, up from 4% in Q125. It is now working with Taiwanese drone makers and transforming its business model from providing ISP , touch IC and local dimming controllers, into full-stack camera modules (ASP ranging from US$300-400 for fixed focus to US$500-600 for zoom configurations, rising to over US$1,000 for thermal sensing cameras), HMI controller modules for ground control stations (GCS), and AI boxes, meaningfully expanding its content per drone as Elan is now positioned as a system-level solutions provider, instead of a component/IC vendor. com kevinlu@ lenovo.com
kevinlu@ lenovo.com
Communication
Module
Camera
Co-Developed by
Al Target Detection
Drones
Long-Distance
Communication
Source: Company data
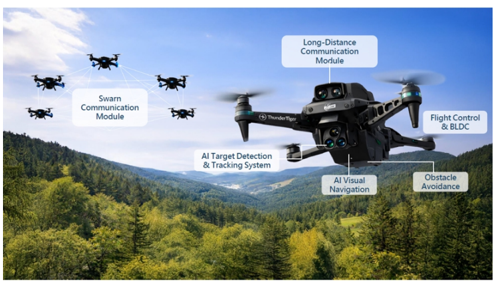
According to Elan, its drone product offering now includes AI target detection and tracking, AI visual navigation, obstacle avoidance, a flight control system, BLDC (brushless direct current) motor, and both swarm and long-distance communication modules. The ground control station (GCS) complements this with similarly differentiated hardware: a waterproof, glove-operable touchscreen, a mini-LED local dimming display solution for better sunlight readability, precision joystick, fingerprint reader, and smart antenna arrays, which are purpose-built for military-grade useability in harsh outdoor environments. The GCS is priced at NT$70-90k per unit, while management noted the local dimming controller module alone (priced at US$150-200 per GCS unit) faces limited competition given the dual requirement of operating underwater and with gloved touch, providing a meaningful differentiating factor versus peers.
Figure 9: Elan's drone product offering
Source: Company data
Figure 10: Elan's ground control station (GCS) product offering
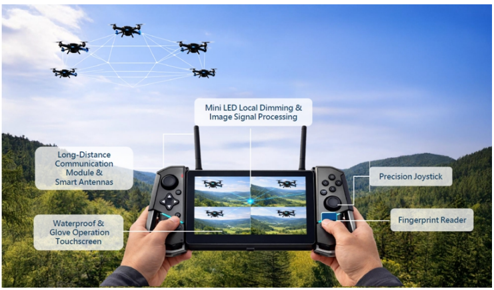
Source: Company data
Although the Taiwan government's annual budget (including drone spending) is still under review, management highlighted that the opportunity for its drone business is primarily for the overseas market. Elan noted the global UAV drone shipment forecast of 11.2mn units in 2024, with consumers accounting for 54%, enterprise 29%, and military 17%. It expects the global enterprise and military-use drone shipments to reach a combined 5.5mn units in 2026, much larger than the domestic volume estimated at ~30k per annum, based on the Taiwan government's plan of ~200k units over six years. Notably, the overseas market is increasingly seeking non-China supply chain kevinlu@ lenovo.com
& Tracking System
Long-Distance
Communication
Module
Flight Control
& BLDC
Mini LED Local Dimming &
Image Signal Processing
Smart
Transportation
alternatives, which Elan believes could be a structural tailwind for its positioning.
In the near-term, Elan will begin shipping higher value-added modules for its domestic drone customers from June, with volumes expected to step up meaningfully in July to 500 units per month. Management guides drone-related revenue to reach a low-singledigit share of total revenue in 2026F, scaling to over 5% in 2027F with some upside, and potentially reaching 10% of total sales in 2028F.
Figure 11: Elan's GM remains resilient despite evolving product mix
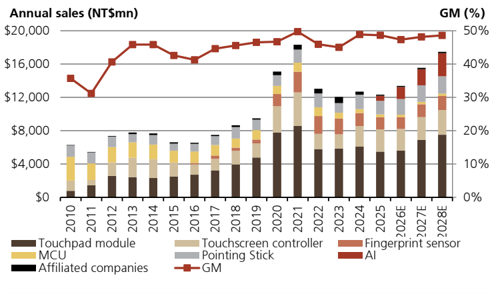
Source: Company data, UBS estimates
Partnering with PETA to capture NPO/CPO opportunities
Elan announced at its analyst meeting that it has made a strategic investment in the USbased silicon photonics startup PETA Optronics, acquiring approximately a 15-16% stake and becoming its largest institutional shareholder, while the founding management team retains majority ownership. Under this partnership, PETA is expected to focus on the development and supply of photonic integrated circuits (PICs), while Elan is responsible for developing electronic IC (EIC) components, such as transimpedance amplifiers (TIAs) and driver ICs, jointly delivering a comprehensive optical module solution. Management highlighted that the partnership leverages Elan's optical sensing know-how at subsidiary Eminent and Elan's SiGe (Silicon-Germanium) design expertise, which are particularly relevant for TIA and driver ICs.
In terms of product roadmap, PETA is advancing quickly in high-speed optical interconnects with 800G and 1.6T pluggable transceiver modules, with 1.6T pluggable transceiver module shipments targeted in 2026 followed by a transition to in-house PIC deployment by 2027. PETA's current PIC technology supports 200G per channel, with ongoing development toward 400G per channel. The company's customer base primarily consists of US-based module houses in California and Texas, while its FAU partner is a leading Taiwan optical module manufacturer. Tower Semi is its current foundry partner but it plans to expand to additional partners including TSMC for NPO and CPO applications.
Beyond pluggable transceiver, PETA and Elan are jointly developing 3.2T NPO solutions for data center scale-out demand, with engineering samples anticipated by early 2027 and commercial products by late 2027, targeting to supply into US CSPs. Looking further ahead, PETA is also progressing on CPO development, with expectations to begin recognizing NRE revenue from CPO projects in 2026 and targeting 6.4T CPO product readiness by 2028.
Given the uncertainties of technology development and the lengthy qualification process for NPO/CPO EICs, we do not include the potential revenue contribution from EIC into our estimates for Elan for now. Nevertheless, with the ramp of higher valueadded modules for its drone customers from H226, its capability to offer solutions that can operate underwater and with gloved touch, and the overseas drone market seeking for non-China supply chain partners, we expect robust growth for its drone business. We think this could support Elan's overall AI-business to achieve a 49% sales CAGR in 2025-30E, outpacing its traditional HMI business.
kevinlu@ lenovo.com
Figure 12: Elan's OPM may further improve on operating leverage
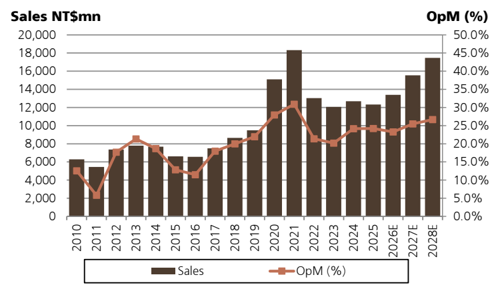
Source: Company data, UBS estimates
Figure 13: Elan's operating metrics - AI business to see a 49% CAGR in 2025-2030E
| VhbMm: | 3()% | 3(3( | 3(3) | 3(33 | 3(34 | 3(3E | 3(39 | 3(3Uu | 3(3,u | 3(3Du | 3(3%u | 3(4(u | 39$4(u/cigw |
|---|---|---|---|---|---|---|---|---|---|---|---|---|---|
| nrü'k"own/'y/pro"uZt/linü | |||||||||||||
| bouZhp'"/mo"ulü | ,x//N | /x//? | Axb/, | bx/O/ | bxA/N | Nx?Ow | bx,Ab | bxN-- | NxAOb | /xb=? | Ax=Nb | Ox?Nw | ))y |
| - YoY chg | 21% | 63% | 10% | -32% | 1% | 4% | -10% | 2% | 23% | 9% | 10% | 10% | |
| bouZhsZrüün/Zontrollür | -x/-, | wx-/? | ,x?w- | -xAw- | -xNOA | =x,/O | =xN/O | =xN?b | =x/w- | =xO/w | wx-bA | wxwbN | 9y |
| - YoY chg | 4% | 85% | 27% | -55% | -7% | 46% | 8% | -3% | 5% | 9% | 6% | 6% | |
| dingürprint/sünsor | ,,/ | -x,NN | =x,/, | =x-=b | -xA/? | -xbbO | -x,,w | -x,=, | -xbb= | -xN/A | -x/AN | -xAO= | Uy |
| - YoY chg | 25% | 228% | 69% | -14% | -12% | -17% | -7% | -1% | 9% | 8% | 6% | 6% | |
| tcy | -x-,, | OAw | -x?Aw | -x?N= | /-N | ,bA | wbw | =A/ | =A? | =A- | =A= | =Aw | $Ey |
| - YoY chg | 2% | -14% | 10% | -2% | -33% | -36% | -23% | -19% | -2% | 0% | 0% | 0% | |
| vointing/stiZk | -x=,, | -x=/w | -xbAw | -xN/? | -x-b= | -x/,- | -xN=, | -xAAw | -xOAA | =x?A? | =x-b- | =x==/ | ,y |
| - YoY chg | -9% | 2% | 24% | 6% | -31% | 51% | -7% | 16% | 6% | 5% | 3% | 4% | |
| iffili'tü"/Zomp'niüs | -Nw | ,wO | bAw | b,N | /,N | wNN | -=O | -,= | -b? | -bb | -N? | -Nb | 9y |
| - YoY chg | -24% | 170% | 33% | -6% | 37% | -51% | -65% | 11% | 5% | 3% | 3% | 3% | |
| io | ? | ? | ? | ? | ? | ? | N-, | -x,wO | -xObw | =x/AN | wx/?= | ,x,Ow | E%y |
| - YoY chg | 135% | 36% | 43% | 33% | 21% | ||||||||
| bot'l/rüvünuü | Ox,AA | -bx-?? | -Axw=A | -wx?w? | -=x?bO | -=xNON | -=xw=N | -wxwO? | -bxb,O | -/x,/= | -Oxb?b | =-x,/A | )3y |
| - YoY chg | 10% | 59% | 21% | -29% | -7% | 5% | -3% | 9% | 16% | 12% | 12% | 10% |
Source: Company data, UBS estimates
Figure 14: Elan's annual P&L
| biZkür ph'rüs/outst'n"ing/Vmn: | 3E9D8b- 3DU84 | currünt/vriZü/VhbM: tkt/Z'p/VhbM/mn: | currünt/vriZü/VhbM: tkt/Z'p/VhbM/mn: | M)9)8( ME4T349 | ||
|---|---|---|---|---|---|---|
| ?ü'r | 3(39 | 3(3Uu | 3(3,u | 3(3Du | 3(3%u | 3(4(u |
| wüvünuüs/VhbM/mn: | M)3T43U | M)4T4%( | M)9T9E% | M),TE,3 | M)%T9(9 | M3)TE,D |
| ?o?/growth/Vy: | D8Uy | )U8)y | )38Ey | ))8Uy | )(8)y | |
| 'ross)profit)v@üFmny | FbxOON | FNxw,= | F/x,Ab | FAx,O? | FOxbw/ | F-?xbN, |
| gt/Vy: | ED8Uy | E,8Ey | ED8)y | ED8Uy | ED8%y | E%83y |
| Zper©ting)profit)v@üFmny | F=xOA= | Fwx--b | FwxON- | F,xNNw | Fbx,w? | FNx-/b |
| evt/Vy: | 3E83y | 3484y | 3989y | 3U8,y | 3,8Dy | 3D8,y |
| @et)profit)v@üF)mny | F=x,,= | F=x/w? | Fwx,?/ | FwxOOb | F,xNw/ | Fbx=N= |
| uvp/VhbM: | MD8ED | M%8E3 | M))8,U | M)48,% | M)U8(( | M)D8)U |
| jâ´)growth)vpy | I--p | --f-p | =,fAp | -/fwp | -Nf-p | -wfbp |
| vHu/Vx: | ),8D | )U8( | )38D | ))8( | %8E | D84 |
| 'ividend)yield)vpy | ,f/p | bfwp | NfNp | /fAp | Of?p | -?f=p |
| vHn/Vx: | E83 | E8) | 48D | 489 | 484 | 48( |
| áZj)vpy | =wf/p | =bfOp | =OfNp | w=fwp | w,fbp | wNfwp |
Source: Company data, UBS estimates. Priced as of 15 June.
Figure 15: Elan's annual and quarterly forecasts
| su'rtürs | s)39 | s339 | s439 | sE39 | s)3U | s33Uu | s43Uu | sE3Uu |
|---|---|---|---|---|---|---|---|---|
| wüvünuüs/VhbM/mn: | M4T))% | M4T(43 | M4T4)U | M3TDU( | M4T339 | M4T3,% | M4TE%D | M4T4D% |
| ))))II)íoí)'rowth)vpy | =f/p | I=fAp | Of,p | I-wfAp | -=fAp | -f/p | Nf/p | Iwf-p |
| ))))II)+o+)'rowth)vpy | ?f,p | IwfAp | I=fbp | IbfAp | wf,p | Af-p | bfbp | -Afbp |
| gross/profit | M)T9UE | M)TE9, | M)T9UU | M)TE)( | M)T94, | M)T99E | M)TUE9 | M)TU(, |
| -- Gross Margin (%) | 50.1% | 48.0% | 47.2% | 49.3% | 47.6% | 47.4% | 47.0% | 47.4% |
| epür'ting/profit | M,D9 | M,EE | M,%3 | MUU) | M,,% | M,93 | MD)( | M,,E |
| -- OP Margin (%) | 25.2% | 24.5% | 23.9% | 23.1% | 24.1% | 22.9% | 23.2% | 22.8% |
| hon$op | VMUU: | VM43E: | M)9) | M)(U | MU) | M3D | M4U | M3U |
| vrü$t'x/profit/VhbM/mn: | M,)% | ME3( | M%E4 | M,UD | MDE( | M,D( | MDEU | MD(( |
| b'x | M3(E | M))( | M),4 | M99 | M)UE | M)9U | M)U% | M)U( |
| -- tax rate (%) | 28.4% | 26.2% | 18.3% | 7.2% | 19.5% | 20.0% | 20.0% | 20.0% |
| hüt/profit/VhbM/mn: | M9ED | M49E | MD(E | M,4U | M,(9 | MU9) | M,(U | MUUD |
| ))))II)íoí)'rowth)vpy | IOf-p | Iwbfbp | -=/f,p | IAfNp | I,f-p | I/f/p | Afbp | Ibf,p |
| ))))II)+o+)'rowth)vpy | I-Of/p | Ib=f-p | -wf?p | ==f?p | =AfNp | A,f?p | I-=f=p | IOf=p |
| uvp/VhbM: | M)8%( | M)834 | M38,% | M389, | M38E4 | M3839 | M38EE | M384( |
Source: Company data, UBS estimates
.com kevinlu@ lenovo.com
kevinlu@ lenovo.com
| 3(3E | 3(39 | 3(3Uu | 3(3,u | 3(3Du |
|---|---|---|---|---|
| M)3TU%U | M)3T43U | M)4T4%( | M)9T9E% | M),TE,3 |
| bfwp MUT3(E 48.9% | I=fOp M9T%%U 48.6% 24.2% | AfNp MUT4E3 47.4% 23.3% M)9) MUE% 19.9% | -Nf-p M,TED9 48.1% M4T%U) 25.5% M)33 MET(D4 MD), 20.0% M4TE(, | -=f,p MDTE%( 48.6% |
| M3T,4U | M3T%D3 | |||
| M4T(UU | M4T))9 | METUU4 | ||
| 24.1% | 26.7% | |||
| M3(, | VM)43: | M)3E | ||
| M4T3,4 | M3TD9( | M4T3UU | MET,D, | |
| MUD( | M9E4 | M%9, | ||
| 20.8% | 19.0% | 20.0% | ||
| M3TEE3 | M3T,4( | M4T%%9 | ||
| =/fNp | I-?f/p | --fAp | =,fAp | -/fwp |
| M%893 | MD8ED | M%8E3 | M))8,U | M)48,% |
What´s Priced In?
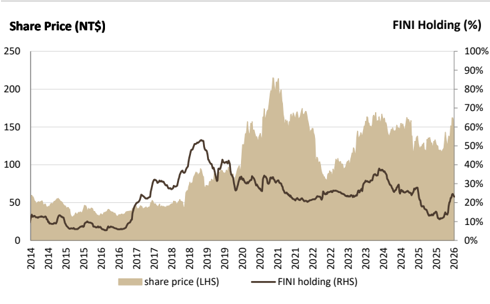
WHAT´S PRICED IN? Elan stock has traded sideways over the past month, although year-to-date its share price is up 24%, underperforming the TAIEX's +53%. We believe the underperformance is mainly because the market generally associates Elan with NB demand, given its roughly 90% sales exposure to that segment. Nevertheless, we think investors could be overlooking the potential ASP uplift benefits coming from HMI spec upgrades and new opportunities in the edge AI business. Based on UBS estimates, Elan stock is trading at 15.4x/12.5x 2026E/2027E PE, or 14x 12-month forward consensus EPS, which is near the middle of its historical 7-20x range and below current peer averages. The stock is also supported by a ~6% dividend yield. We believe the improving earnings outlook on content growth for the touch business and AI opportunities has not been fully priced in, and we expect the stock to further re-rate as its revenue and earnings growth outperforms NB shipments, especially as its foreign institutional investor (FINI) holdings are below 24%, versus the 30-50% of previous upcycles.
Figure 16: Elan trades below its peak multiple, despite accelerating earnings growth
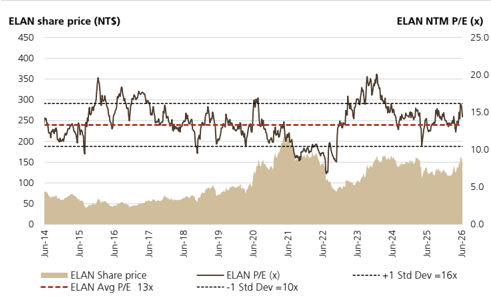
Source: LSEG
Figure 17: Elan's FINI ownership recovering from near-term trough
Source: TEJ
Figure 18: Elan trades at a discount to industry peer average P/E
| comp'ny/n'mü | biZkür | t'rküt/c'p | ph'rü/vriZü | uvp/VacM: | uvp/VacM: | uvp/growth/Vy: | uvp/growth/Vy: | vHu/Vx: | vHu/Vx: | vHn./Vx: | vHn./Vx: | weu/Vy: | weu/Vy: |
|---|---|---|---|---|---|---|---|---|---|---|---|---|---|
| VypMmn: | Vac: | 3(3Uu | 3(3,u | 3(3Uu | 3(3,u | 3(3Uu | 3(3,u | 3(3Uu | 3(3,u | 3(3Uu | 3(3,u | ||
| jl©n)_icroelectronics)'orp | =,bAfüô | -x,-- | -,/ | Of, | --fA | --f- | =,fA | -Nf? | -=fA | ,f- | wfA | =bfO | =OfN |
| â');©|less | |||||||||||||
| *Novatek Microelectronics Corp | 3034.TW | 9,419 | 489 | 29.2 | 32.7 | 9.8 | 11.9 | 16.7 | 14.9 | 4.1 | 3.9 | 25.1 | 25.8 |
| *Realtek Semiconductor Corp | 2379.TW | 10,095 | 618 | 31.5 | 36.2 | 6.5 | 15.0 | 19.6 | 17.1 | 5.6 | 5.1 | 30.5 | 31.0 |
| Parade Technologies Ltd | 4966.TWO | 1,686 | 675 | 33.9 | 42.5 | -3.9 | 25.2 | 19.9 | 15.9 | 2.3 | 2.1 | 11.6 | 13.9 |
| Silergy Corp | 6415.TW | 5,997 | 487 | 10.2 | 17.4 | 60.0 | 69.7 | 47.5 | 28.0 | 4.6 | 4.1 | 10.0 | 15.2 |
| Asmedia Technology Inc | 5269.TW | 3,231 | 1,375 | 93.1 | 106.2 | 29.3 | 14.0 | 14.8 | 13.0 | 2.6 | 2.3 | 18.2 | 18.8 |
| PixArt Imaging Inc | 3227.TWO | 1,028 | 216 | 12.2 | 14.6 | -1.0 | 19.4 | 17.7 | 14.8 | 2.4 | 2.5 | 14.3 | 16.8 |
| Synaptics Inc | SYNA.N | 5,349 | 138 | 4.6 | 5.3 | 26.2 | 14.8 | 30.0 | 26.2 | 3.9 | 3.6 | 7.9 | 11.9 |
| Gver©ge | =wfA | -AfN | wf/ | wf, | -NfA | -Of- | |||||||
| éG°)©nd)defense | |||||||||||||
| Coretronic Corp | 5371.TWO | 841 | 68 | 1.2 | 2.3 | 42.7 | 96.2 | 56.9 | 29.0 | 1.1 | 1.5 | 1.6 | 4.0 |
| Aerospace Industrial Development Corp | 2634.TW | 1,407 | 47 | 1.8 | 2.8 | 200.5 | 54.3 | 26.4 | 17.1 | 2.3 | 2.2 | 9.6 | 12.7 |
| Evergreen Aviation Technologies Corp | 2645.TW | 1,976 | 167 | 9.1 | 10.3 | 64.5 | 12.8 | 18.3 | 16.2 | 4.1 | 4.0 | 20.3 | 24.6 |
| Lungteh Shipbuilding Co Ltd | 6753.TW | 446 | 120 | 7.5 | 6.7 | 33.0 | -11.2 | 15.9 | 17.9 | 2.8 | 2.5 | 17.6 | 13.9 |
| Getac Holdings Corp | 3005.TW | 2,081 | 106 | 8.7 | 9.4 | 5.7 | 8.1 | 12.1 | 11.2 | 2.4 | 2.3 | 19.4 | 19.7 |
| Gver©ge | =bfO | -Afw | =fb | =fb | -wf/ | -bf? |
Source: Company data, LSEG, UBS estimates. Prices as of June 12, 2026. Note: All estimates of peers are based on Eikon.
kevinlu@ lenovo.com
Elan Microelectronics - 2458.TW Price
200
Upside/Downside Spectrum
Upside/Downside Spectrum
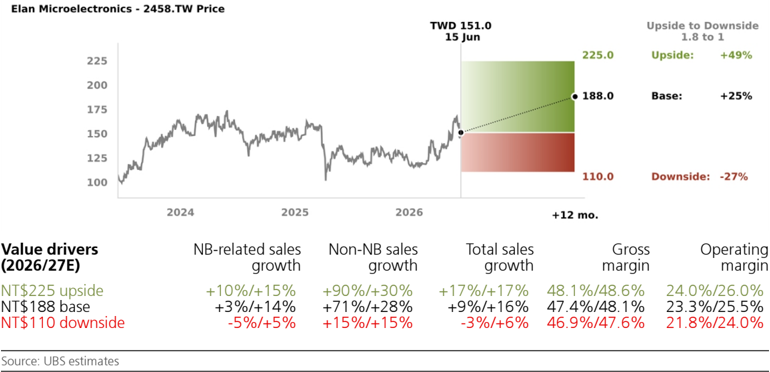
Risk to the current share price skewed (1.8:1) to the upside
Elan is trading at NT$151.0 (as of 15 June 2026).
UPSIDE (NT$225): Our upside scenario reflects better-than-expected demand for NBs and faster adoption of premium HMI features, and a quicker ramp of drone and edge-AI applications. Our upside scenario lifts 2026/2027E sales growth from our 9%/16% base case to 17%/17%, with GM expanding from 47.4%/48.1% to 48.1%/48.6% and OPM rising from 23.3%/25.5% in our base case to 24.0%/26.0%. Our upside valuation of NT $225 assumes 17.5x 2027E P/E.
BASE (NT$188): We expect 9%/16% YoY sales growth in 2026/2027, with a GM of 47.4%/48.1%, based on sustaining market position and content gain increases despite overall weaker NB demand of -10% YoY units decline in 2026E. Our price target of NT $188 is based on 16x 2027E P/E, the average upcycle P/E after 2020.
DOWNSIDE (NT$110): We assume downside risk from softer NB demand and slower adoption of HMI features as well as delay of AI-related opportunities (drones, ADAS). In our downside scenario, we assume 2026/2027 sales growth of -3%/+6% YoY, with 2026/2027E GM falling to 46.9%/47.6% and OPM contracting to 21.8%/24.0%. Our downside valuation of NT$110 assumes 12x 2027E P/E. com kevinlu@ lenovo.com
kevinlu@ lenovo.com
TWD 151.0
15 Jun
225.0
• 188.0
Upside to Downside
1.8 to 1
Upside:
+49%
Base:
+25%
Elan is trading at NT $151.0 (as of 15 June 2026).
Elan Microelectronics (2458.TW)
| Income Statement (NT$m) | 12/23 | 12/24 | 12/25 | 12/26E | %ch | 12/27E | %ch | 12/28E | 12/29E | 12/30E |
|---|---|---|---|---|---|---|---|---|---|---|
| Revenues | 12,059 | 12,696 | 12,326 | 13,390 | 8.6 | 15,549 | 16.1 | 17,472 | 19,505 | 21,478 |
| Gross profit | 5,432 | 6,204 | 5,996 | 6,342 | 5.8 | 7,485 | 18.0 | 8,490 | 9,537 | 10,564 |
| EBITDA (UBS) | 2,797 | 3,381 | 3,282 | 3,580 | 9.1 | 4,467 | 24.8 | 5,302 | 6,156 | 6,984 |
| Depreciation & amortisation | (363) | (315) | (300) | (464) | -54.8 | (506) | -8.9 | (638) | (726) | (809) |
| EBIT (UBS) | 2,434 | 3,066 | 2,982 | 3,115 | 4.5 | 3,961 | 27.1 | 4,663 | 5,430 | 6,175 |
| Associates & investment income | (35) | (114) | (182) | (17) | 90.6 | 0 | - | 0 | 0 | 0 |
| Other non-operating income | 37 | 259 | (7) | 141 | - | 100 | -29.0 | 100 | 100 | 100 |
| Net interest | 37 | 62 | 56 | 27 | -52.3 | 22 | -19.4 | 24 | 27 | 31 |
| Exceptionals (incl goodwill) | 0 | 0 | 0 | 0 | - | 0 | - | 0 | 0 | 0 |
| Pre-tax profit | 2,473 | 3,273 | 2,850 | 3,266 | 14.6 | 4,083 | 25.0 | 4,787 | 5,557 | 6,305 |
| Tax | (488) | (680) | (543) | (649) | -19.6 | (817) | -25.8 | (957) | (1,111) | (1,261) |
| Profit after tax | 1,985 | 2,593 | 2,307 | 2,617 | 13.4 | 3,266 | 24.8 | 3,830 | 4,445 | 5,044 |
| Preference dividends | 0 | 0 | 0 | 0 | - | 0 | - | 0 | 0 | 0 |
| Minorities | 158 | 143 | 135 | 113 | -16.2 | 141 | 24.8 | 165 | 192 | 218 |
| Extraordinary | 0 | 0 | 0 | 0 | - | 0 | - | 0 | 0 | 0 |
| items Net earnings (local GAAP) | 2,144 | 2,736 | 2,442 | 2,730 | 11.8 | 3,407 | 24.8 | 3,995 | 4,637 | 5,262 |
| Net earnings (UBS) | 2,144 | 2,736 | 2,442 | 2,730 | 11.8 | 3,407 | 24.8 | 3,995 | 4,637 | 5,262 |
| Tax rate (%) | 19.7 | 20.8 | 19.0 | 19.9 | 4.4 | 20.0 | 0.6 | 20.0 | 20.0 | 20.0 |
| Per Share (NT$) | 12/23 | 12/24 | 12/25 | 12/26E | %ch | 12/27E | %ch | 12/28E | 12/29E | 12/30E |
| EPS (UBS, diluted) | 7.46 | 9.52 | 8.48 | 9.42 | 11.1 | 11.76 | 24.8 | 13.79 | 16.00 | 18.16 |
| EPS (local GAAP, diluted) | 7.46 | 9.52 | 8.48 | 9.42 | 11.1 | 11.76 | 24.8 | 13.79 | 16.00 | 18.16 |
| EPS (UBS, basic) | 7.53 | 9.58 | 8.53 | 9.53 | 11.8 | 11.90 | 24.8 | 13.95 | 16.20 | 18.38 |
| DPS (net) (NT$) | 5.12 | 7.83 | 7.16 | 8.00 | 11.8 | 9.99 | 24.8 | 11.71 | 13.59 | |
| Cash EPS (UBS, diluted) 1 | 8.72 | 10.62 | 9.52 | 11.02 | 15.8 | 13.50 | 22.5 | 15.99 | 18.51 | 15.42 20.95 |
| Book value per share | 30.99 | 34.34 | 36.25 | 36.88 | 1.7 | 40.19 | 9.0 | 43.22 | 46.88 | 50.64 |
| Average shares (diluted) | 287 | 287 | 288 | 290 | 0.6 | 290 | 0.0 | 290 | 290 | 290 |
| Balance Sheet (NT$m) | 12/23 | 12/24 | 12/25 | 12/26E | %ch | 12/27E | %ch | 12/28E | 12/29E | 12/30E |
| Cash and equivalents | 4,441 | 4,551 | 4,192 | 3,390 | -19.1 | 3,536 | 4.3 | 3,831 | 4,071 | 4,619 |
| Other current assets | 4,183 | 4,111 | 3,818 | 4,247 | 11.2 | 4,962 8,499 | 16.8 | 5,419 | 6,202 10,273 | 6,567 |
| Total current assets | 8,624 | 8,662 | 8,010 | 7,636 | -4.7 | 5,864 | 11.3 | 9,250 | 11,187 | |
| Net tangible fixed assets | 1,518 | 2,788 | 4,398 | 5,590 | 27.1 | 4.9 | 6,186 | 6,558 | 6,975 | |
| Net intangible fixed assets | 598 | 489 | 392 | 488 | 24.5 | 641 | 31.4 | 729 | 801 | 864 |
| Investments / other assets | 3,280 | 3,078 | 2,773 | 2,784 | 0.4 | 2,943 | 5.7 | 3,043 | 3,213 | 3,296 |
| Total assets | 14,019 | 15,017 | 15,572 | 16,498 | 5.9 | 17,947 | 8.8 | 19,209 | 20,846 | 22,321 |
| Trade payables & other ST liabilities | 3,284 | 3,458 | 2,958 | 3,447 | 16.5 | 3,619 | 5.0 | 3,732 | 3,927 | 4,012 |
| Short term debt | 40 | 130 | 200 | 292 | 46.0 | 292 | 0.0 | 292 | 292 | 292 |
| Total current liabilities Long term debt | 3,324 469 | 3,588 469 | 3,158 969 | 3,739 927 | 18.4 -4.3 | 3,911 927 | 4.6 0.0 | 4,024 927 | 4,219 927 | 4,304 |
| Other long term | 999 | 7.4 | 1,251 | 17.7 | 1,369 | 1,569 | 927 | |||
| liabilities Preferred shares | 0 | 960 | 990 | 1,063 | - | 0 | - | 0 | 0 | 1,666 0 |
| Total liabilities (incl pref shares) | 4,792 | 0 | 0 | 0 5,730 | 12.0 | 6,089 | 6.3 | 6,320 | 6,715 | 6,898 |
| Common s/h equity | 8,820 | 5,016 | 5,116 | 11,508 | 9.0 | 12,374 | 13,423 | 14,498 | ||
| Minority interests | 408 | 9,773 228 | 10,316 139 | 10,559 209 | 2.4 49.9 | 350 | 67.5 | 515 | 707 | 925 |
| Total liabilities & equity | 14,019 | 15,017 com | 15,572 | 16,498 | 5.9 | 17,947 | 8.8 | 19,209 | 20,846 | 22,321 |
| Cash Flow (NT$m) | 12/23 | 12/24 | 12/25 | 12/26E | 12/27E | %ch | 12/28E | 12/29E | 12/30E | |
| Net income (before | 2,144 | 2,736 | 2,442 | 2,730 | %ch | 3,407 | 24.8 | 3,995 | 4,637 | 5,262 |
| pref divs) Depreciation & amortisation | 363 | 315 | 300 | 464 | 11.8 54.8 | 506 | 8.9 | 638 | 726 | 809 |
| Net change in working capital | 1,499 | 5 | 37 | (389) | - | (375) 1 | 3.6 -99.8 | (238) | (408) 42 | (192) |
| Other operating | 202 | 254 | (129) | 469 | - | 77 | 145 | |||
| Operating cash flow | 4,208 | 3,309 | 2,650 | 3,274 | 23.5 | 3,538 | 8.1 | 4,472 | 4,998 | 6,024 |
| Tangible capital expenditure | (700) | (1,371) | (1,709) | (1,343) | 21.4 | (466) | 65.3 | (524) | (585) | (644) |
| Intangible capital expenditure | (353) | (55) | (388) | NM | (466) | -20.2 | (524) | (585) | (644) | |
| Net (acquisitions) & disposals | (102) | (56) 0 | 37 | - | 0 | - | 0 | 0 | 0 | |
| Other investing | (1,117) | 630 | 0 (489) | 1,013 | - | 0 | - | 0 | 0 | 0 |
| Investing cash flow | (2,273) | (797) | (2,253) | (680) | 69.8 | (933) | -37.1 | (1,048) | (1,170) | (1,289) |
| Equity dividends paid | (2,329) | (2,039) | (1,835) 16 | (2,431) | -32.5 | (2,459) | -1.2 | (3,129) | (3,588) | (4,187) 0 |
| Share issues / (buybacks) | 0 | 258 | 0 | 0 | - | 0 | 0 | |||
| - | - | 0 | ||||||||
| Other financing Change in debt & pref | (84) | (166) | (20) 570 | (8) 28 | 60.5 -95.0 | 0 0 | 0 0 | 0 0 | 0 | |
| shares Financing cash flow | 429 (1,984) | 90 (1,857) | (1,269) | (2,410) | -89.9 | (2,459) | - -2.0 | (3,129) | (3,588) | (4,187) |
| Cash flow inc/(dec) in cash | (49) | 183 | - | 147 | -19.8 | 295 | 549 | |||
| FX / non cash items | 656 | (872) 513 | (985) | - | 0 | - | 0 | 240 | 0 | |
| Balance sheet inc/(dec) in cash | 1,038 | (545) | (802) | 147 | 0 | |||||
| 988 | 110 | 240 | ||||||||
| (359) | -123.4 | - | 295 | 549 |
Source: Company accounts, UBS estimates. (UBS) metrics use reported figures which have been adjusted by UBS analysts. 1 Cash EPS (UBS, diluted) is calculated using UBS net income adding back depreciation and amortization.
kevinlu@ lenovo.com kevinlu@ lenovo.com
Elan Microelectronics (2458.TW)
| Valuation (x) | 12/23 | 12/24 | 12/25 | 12/26E | 12/27E | 12/28E | 12/29E | 12/30E |
|---|---|---|---|---|---|---|---|---|
| P/E (local GAAP, diluted) | 15.9 | 16.1 | 15.6 | 16.0 | 12.8 | 11.0 | 9.4 | 8.3 |
| P/E (UBS, diluted) | 15.9 | 16.1 | 15.6 | 16.0 | 12.8 | 11.0 | 9.4 | 8.3 |
| P/CEPS | 13.4 | 14.3 | 13.8 | 13.5 | 11.0 | 9.3 | 8.1 | 7.1 |
| Equity FCF (UBS) yield% | 9.4 | 4.3 | 2.3 | 3.6 | 6.0 | 7.9 | 8.9 | 11.0 |
| Dividend yield (net)% | 4.3 | 5.1 | 5.4 | 5.3 | 6.6 | 7.8 | 9.0 | 10.2 |
| P/BV | 3.8 | 4.4 | 3.7 | 4.1 | 3.8 | 3.5 | 3.2 | 3.0 |
| EV/revenues (core) | 2.3 | 3.0 | 2.6 | 2.9 | 2.5 | 2.3 | 2.0 | 1.8 |
| EV/EBITDA (UBS core) | 10.1 | 11.1 | 9.9 | 10.9 | 8.8 | 7.4 | 6.4 | 5.6 |
| EV/EBIT (core) | 11.6 | 12.3 | 10.9 | 12.5 | 9.9 | 8.4 | 7.2 | 6.3 |
| EV/OpFCF (core) | 10.7 | 11.7 | 10.4 | 11.4 | 9.2 | 7.7 | 6.6 | 5.8 |
| EV/op. invested capital | 7.8 | 11.0 | 6.9 | 6.3 | 5.5 | 4.9 | 4.4 | 4.0 |
| Enterprise value (NT$m) | 12/23 | 12/24 | 12/25 | 12/26E | 12/27E | 12/28E | 12/29E | 12/30E |
| Market cap. | 33,677 | 43,485 | 37,704 | 43,235 | 43,235 | 43,235 | 43,235 | 43,235 |
| Net debt (cash) | (3,632) | (3,942) | (3,488) | (2,597) | (2,244) | (2,464) | (2,732) | (3,126) |
| Buy out of minorities | 570 | 318 | 184 | 174 | 279 | 433 | 611 | 816 |
| Pension provisions/other | 0 | 0 | 0 | 0 | 0 | 0 | 0 | 0 |
| Total enterprise value | 30,614 | 39,861 | 34,400 | 40,812 | 41,271 | 41,203 | 41,114 | 40,925 |
| Non core assets | (2,339) | (2,166) | (1,878) | (1,882) | (1,882) | (1,882) | (1,882) | (1,882) |
| Core enterprise value | 28,276 | 37,695 | 32,522 | 38,931 | 39,389 | 39,321 | 39,233 | 39,043 |
| Growth (%) | 12/23 | 12/24 | 12/25 | 12/26E | 12/27E | 12/28E | 12/29E | 12/30E |
| Revenue | (7.5) | 5.3 | (2.9) | 8.6 | 16.1 | 12.4 | 11.6 | 10.1 |
| EBITDA (UBS) | (10.1) | 20.9 | (2.9) | 9.1 | 24.8 | 18.7 | 16.1 | 13.5 |
| EBIT (UBS) | (12.6) | 25.9 | (2.7) | 4.5 | 27.1 | 17.7 | 16.4 | 13.7 |
| EPS (UBS, diluted) | 0.2 | 27.7 | (10.9) | 11.1 | 24.8 | 17.3 | 16.1 | 13.5 |
| Net DPS | (16.7) | 53.1 | (8.6) | 11.8 | 24.8 | 17.3 | 16.1 | 13.5 |
| Margins & Profitability (%) | 12/23 | 12/24 | 12/25 | 12/26E | 12/27E | 12/28E | 12/29E | 12/30E |
| Gross profit margin | 45.0 | 48.9 | 48.6 | 47.4 | 48.1 | 48.6 | 48.9 | 49.2 |
| EBITDA margin | 23.2 | 26.6 | 26.6 | 26.7 | 28.7 | 30.3 | 31.6 | 32.5 |
| EBIT (UBS) margin | 20.2 | 24.1 | 24.2 | 23.3 | 25.5 | 26.7 | 27.8 | 28.7 |
| Net earnings (UBS) margin | 17.8 | 21.5 | 19.8 | 20.4 | 21.9 | 22.9 | 23.8 | 24.5 |
| ROIC (EBIT) | 67.5 | NM | 63.2 | 50.8 | 55.1 | 58.1 | 61.0 | 63.2 |
| ROIC post tax | 54.4 | 71.7 | 51.9 | 40.7 | 44.1 | 46.5 | 48.8 | 50.6 |
| ROE (UBS) | 24.2 | 29.4 | 24.3 | 26.2 | 30.9 | 33.5 | 36.0 | 37.7 |
| Capital structure & Coverage (x) | 12/23 | 12/24 | 12/25 | 12/26E | 12/27E | 12/28E | 12/29E | 12/30E |
| Net debt / EBITDA | (1.4) | (1.2) | (0.9) | (0.6) | (0.5) | (0.5) | (0.5) | (0.5) |
| Net debt / total equity% | (42.6) | (39.5) | (28.9) | (20.2) | (19.5) | (20.3) | (20.2) | (22.0) |
| Net debt / (net debt + total equity)% | (74.3) | (65.3) | (40.7) | (25.2) | (24.3) | (25.4) | (25.3) | (28.3) |
| Net debt/EV% | (11.9) | (9.9) | (10.1) | (6.4) | (5.4) | (6.0) | (6.6) | (7.6) |
| Capex / depreciation% | NM | NM | NM | NM | NM | NM | NM | NM |
| Capex / revenue% | 5.8 | 10.8 | 13.9 | 10.0 | 3.0 | 3.0 | 3.0 | 3.0 |
| EBIT / net interest | - | - | - | - | - | - | - | - |
| Dividend cover (UBS) | 1.5 | 1.2 | 1.2 | 1.2 | 1.2 | 1.2 | 1.2 | 1.2 |
| Div. payout ratio (UBS)% | 67.9 | 81.8 | 83.9 | 83.9 | 83.9 | 83.9 | 83.9 | 83.9 |
| Revenues by division (NT$m) | 12/23 | 12/24 | 12/25 | 12/26E | 12/27E | 12/28E | 12/29E | 12/30E |
| Touchpad module | 5,876 | 6,093 | 5,485 | 5,611 | 6,895 | 7,520 | 8,265 | 9,063 |
| Touchscreen controller | 1,698 | 2,479 | 2,679 | 2,605 | 2,731 | 2,973 | 3,158 | 3,356 |
| Point Stick | 1,152 | 1,741 | 1,624 | 1,883 | 1,988 | 2,080 | 2,151 | 2,227 |
| Fingerprint sensor | 1,870 | 1,559 | 1,443 | 1,424 | 1,552 | 1,678 | 1,786 | 1,892 |
| MCU | 716 | 458 | 353 | 287 | 280 | 281 | 282 | 283 |
| Affiliated companies | 746 | 366 | 129 | 142 | 150 | 155 | 160 | 165 |
| Others | 1 | 0 | 613 | 1,438 | 1,953 | 2,785 | 3,703 | 4,492 |
| Total | 12,059 | 12,696 | 12,326 | 13,390 | 15,549 | 17,472 | 19,505 | 21,478 |
| EBIT (UBS) by division (NT$m) Others | 12/23 2,434 | 12/24 3,066 | 12/25 2,982 | 12/26E 3,115 | 12/27E 3,961 | 12/28E 4,663 | 12/29E 5,430 | 12/30E 6,175 |
| Total | 2,434 | 3,066 | 2,982 | 3,115 | 3,961 | 4,663 | ||
| 5,430 | 6,175 |
Source: Company accounts, UBS estimates. (UBS) metrics use reported figures which have been adjusted by UBS analysts.
kevinlu@ lenovo.com
Forecast returns
| Forecast price appreciation | 24.5% |
|---|---|
| Forecast dividend yield | 5.3% |
| Forecast stock return | 29.8% |
| Market return assumption | 6.2% |
| Forecast excess return | 23.6% |
Company Description
Elan Microelectronics is a Taiwan-based fabless IC design house specialising in humanmachine interface including touchscreen controllers, touchpad modules, pointing stick modules and fingerprint sensors, specifically for notebook PCs. It started with microcontrollers (MCUs) for PC peripherals and consumer electronics upon establishment in 1994, and further expanded the reach into notebook PC input devices through the acquisition of a related subsidiary under KOA Corporation in 2003.
Valuation Method and Risk Statement
Our price target is based on a target PE multiple.
Fabless integrated circuit (IC) design houses face a variety of uncertainties, including rapidly changing technology, end-market demand, competition, employee turnover and foundry wafer costs. They are also vulnerable to legal disputes over intellectual property rights.
For Elan, we believe key risks include: 1) PC and NB demand dynamics, with any slowdown in these end-markets potentially directly impacting Elan's growth and its new product roll-outs; 2) a longer-than-expected product qualification cycle or slower-than-expected product adoption among clients, particularly for new products; 3) fiercer-than-expected price competition from global and Asian peers negatively impacting growth and gross margin; and 5) faster-than-expected foundry and assembly cost increases negatively impacting gross margin.
kevinlu@ lenovo.com
Quantitative Research Review
UBS Global Research publishes a quantitative assessment of its analysts' responses to certain questions about the likelihood of an occurrence of a number of short term factors in a product known as the 'Quantitative Research Review'. The views for this month can be found below. Views contained in this assessment on a particular stock reflect only the views on those short term factors which are a different timeframe to the 12-month timeframe reflected in any equity rating set out in this note. For previous responses please make reference to (i) previous UBS Global Research reports; and (ii) where no applicable research report was published that month, the Quantitative Research Review which can be found at https://neo.ubs.com/quantitative, or contact your UBS sales representative for access to the report or the Quantitative Research Team on ubs-quant-answers@ubs.com. A consolidated report which contains all responses is also available and again you should contact your UBS sales representative for details and pricing or the Quantitative Research Team on the email above.
Elan Microelectronics
| Question | Response |
|---|---|
| 1. Is the industry structure facing the firm likely to improve or deteriorate over the next six months? Rate on a scale of 1-5 (1 = getting worse, 3 = no change, 5 = getting better, N/A = no view) | 2 |
| 2. Is the regulatory/government environment facing the firm likely to improve or deteriorate over the next six months? Rate on a scale of 1-5 (1 = getting tougher 3 = no change, 5 = getting better, N/A = no view) | 3 |
| 3. Over the last 3-6 months in broad terms have things been improving/no change/getting worse for this stock? Rate on a scale of 1-5 (1 = getting a lot worse, 3 = not much change, 5 = getting a lot better, N/A = no view) | 3 |
| 4. Relative to the current CONSENSUS EPS forecast, is the next company EPS update likely to lead to: (1 = negative surprise vs consensus, 3 = in-line with consensus, 5 = positive surprise vs consensus expectations, N/A = no view) | 3 |
| 5. What's driving the difference? | |
| 6. Relative to YOUR current earnings forecast, is there relatively greater risk at the next earnings result of:(1 = downside skew risk to earnings, 3 = equal upside or downside risk to earnings, 5 = upside skew risk to earnings, N/A = no view) | 3 |
| 7. What's driving the difference? | |
| 8. Is there an upcoming catalyst for the company over the next three months? | No Catalyst |
| 9. Is there an actual or approximate date for the catalyst? | |
| 10. Is the catalyst date an actual or approximate date? | N/A |
| 11. What is the catalyst? |
kevinlu@ lenovo.com
Required Disclosures
This document has been prepared by UBS Securities Pte. Ltd., Taipei Branch, an affiliate of UBS AG. UBS AG, its subsidiaries, branches and affiliates, including former Credit Suisse AG and its subsidiaries, branches and affiliates are referred to herein as "UBS".
For information on the ways in which UBS manages conflicts and maintains independence of its UBS Global Research product; historical performance information; certain additional disclosures concerning UBS Global Research recommendations; and terms and conditions for certain third party data used in research report, please visit https://www.ubs.com/disclosures. Unless otherwise indicated, information and data in this report are based on company disclosures including but not limited to annual, interim, quarterly reports and other company announcements. The figures contained in performance charts refer to the past; past performance is not a reliable indicator of future results. Additional information will be made available upon request. UBS Securities Co. Limited is licensed to conduct securities investment consultancy businesses by the China Securities Regulatory Commission. UBS acts or may act as principal in the debt securities (or in related derivatives) that may be the subject of this report. This recommendation was finalized on: 15 June 2026 08:55 AM GMT. UBS has designated certain UBS Global Research department members as Derivatives Research Analysts where those department members publish research principally on the analysis of the price or market for a derivative, and provide information reasonably sufficient upon which to base a decision to enter into a derivatives transaction. Where Derivatives Research Analysts coauthor research reports with Equity Research Analysts or Economists, the Derivatives Research Analyst is responsible for the derivatives investment views, forecasts, and/or recommendations. Quantitative Research Review: UBS Global Research publishes a quantitative assessment of its analysts' responses to certain questions about the likelihood of an occurrence of a number of short term factors in a product known as the 'Quantitative Research Review'. Views contained in this assessment on a particular stock reflect only the views on those short term factors which are a different timeframe to the 12-month timeframe reflected in any equity rating set out in this note. For the latest responses, please see the Quantitative Research Review Addendum at the back of this report, where applicable. For previous responses please make reference to (i) previous UBS Global Research reports; and (ii) where no applicable research report was published that month, the Quantitative Research Review which can be found at https://neo.ubs.com/ quantitative, or contact your UBS sales representative for access to the report or the Quantitative Research Team on ubs-quantanswers@ubs.com. A consolidated report which contains all responses is also available and again you should contact your UBS sales representative for details and pricing or the Quantitative Research team on the email above.
圖片清單(已驗證 2026-07-02)
回補驗證:僅涵蓋已被 lib 頁嵌入的圖片,非全量驗證。
| 檔名 | size | 分類 | 親眼所見內容 |
|---|---|---|---|
260615_2458_義隆_ubs_elan-resume_007.png |
364KB | 真資料圖 | 左側標題「Self-Developed Edge AI Algorithm」,流程圖 Camera→AI SoC→GElanNet(神經網路示意圖),下方「Co-Developed by 中央研究院 Academia Sinica × Elan」標誌;右側標題「On Device AI Core Across Multiple Domains」,五個應用情境插圖與文字標籤:Drones、Automotive ADAS、Smart Transportation、Robotics、Unmanned Systems |
260615_2458_義隆_ubs_elan-resume_009.png |
202KB | 真資料圖 | 無人機地面控制站產品示意圖,背景森林、雙手持握遙控器,文字標籤:Long-Distance Communication Module & Smart Antennas、Mini LED Local Dimming & Image Signal Processing、Waterproof & Glove Operation Touchscreen、Precision Joystick、Fingerprint Reader,中央螢幕顯示四宮格無人機空拍畫面;圖中未顯示任何價格數字 |